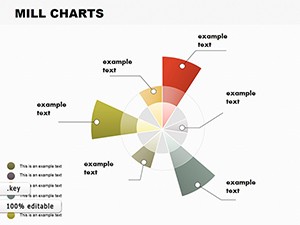
Zone In on Collaboration: Matrix Cells Keynote Charts for Dynamic Teams


Type: Keynote Charts template
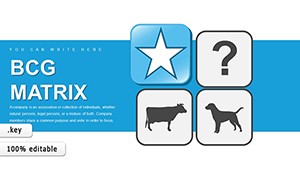
Category: Matrix
Sources Available: .key
Product ID: KC00121
Template incl.: 15 editable slides
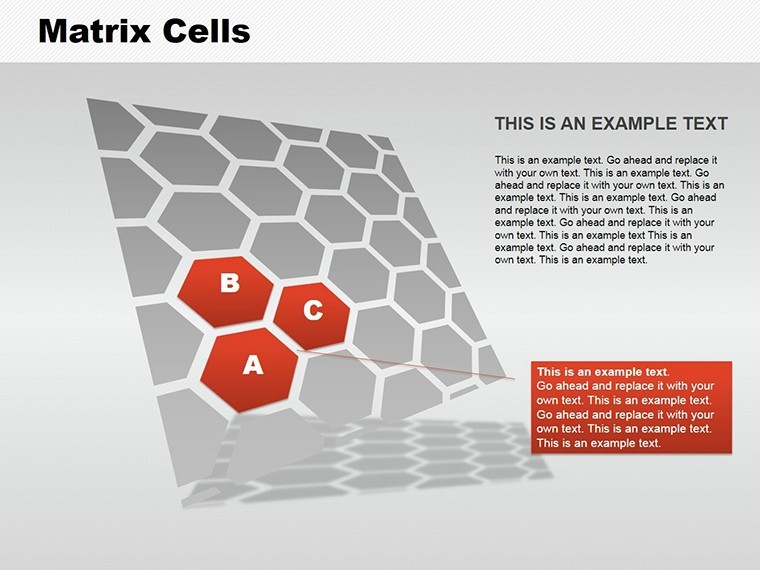
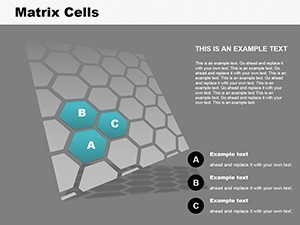
Teamwork makes the dream work, but how do you chart it without the chaos? The Matrix Cells Keynote Charts Template answers with 15 editable slides that map collaboration like a master planner sketches a city grid - clear zones, defined paths, and room for growth. Aimed at project leads, HR strategists, and workshop facilitators, this tool turns abstract goals into tangible visuals that rally teams toward success.
Themed around customizable matrices with marked cells for themes, difficulty levels, and objectives, it's more than grids; it's a catalyst for involvement and positive energy. Keynote-optimized with PowerPoint versatility, it integrates effortlessly into your toolkit, reducing prep from days to hours while amplifying emotional buy-in.
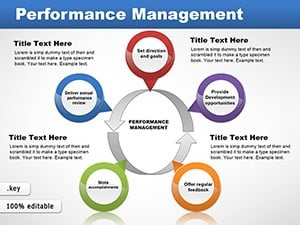
Why Matrix Cells Are Your Team's Visual North Star
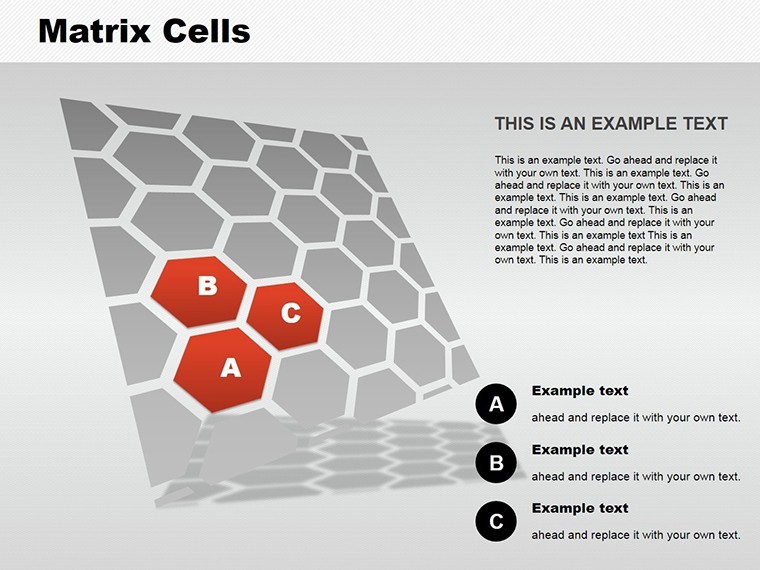
In high-stakes environments, vague agendas kill momentum. These charts impose structure with flair, categorizing tasks by complexity and alignment - think low-difficulty onboarding cells versus high-stakes innovation zones. The payoff? Heightened participation, clearer priorities, and presentations that don't just inform but inspire action.
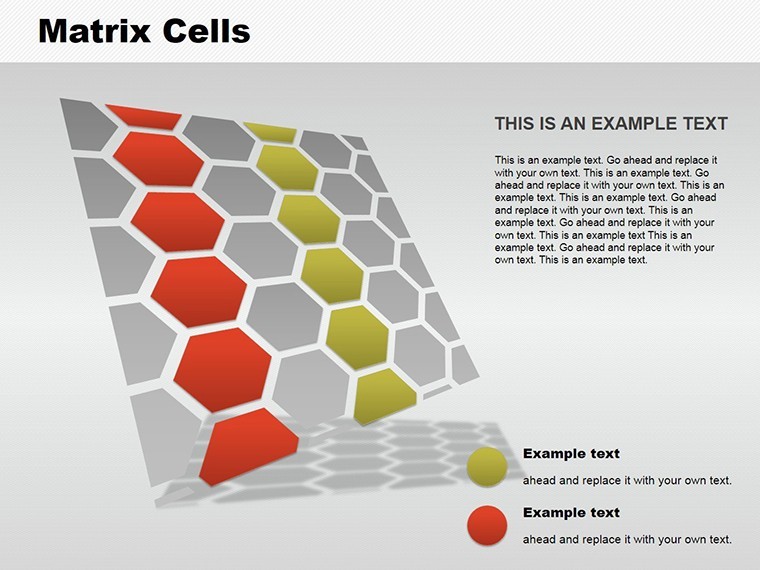
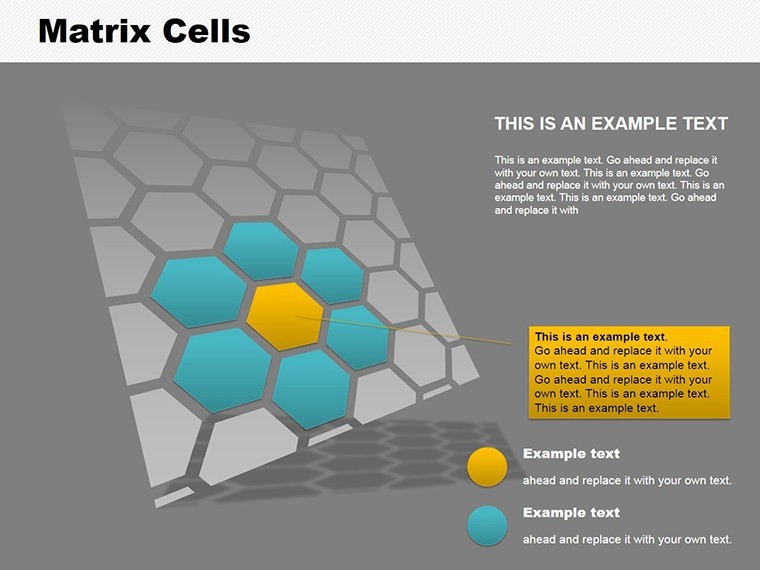
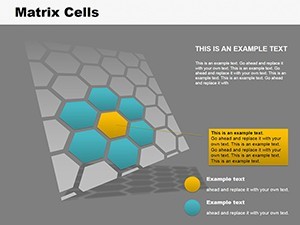
- Zoned Precision: Each cell pops with icons and colors denoting themes, making scans intuitive even for large groups.
- Adaptive Naming: Rename your matrix (e.g., "Project Priority Grid") to fit any agenda, from agile sprints to corporate retreats.
- Engagement Boost: Built for interactivity - add hyperlinks to action items, fostering real-time collaboration.
Evidence from Gallup studies shows visualized goals lift team performance by 21%; our template operationalizes that with designs vetted by facilitation experts like those at IDEO.
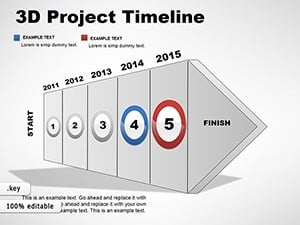
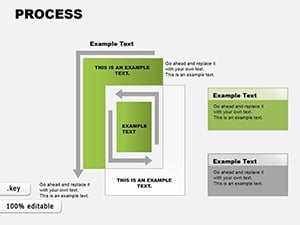
Navigating the 15 Slides: Cells of Strategic Brilliance
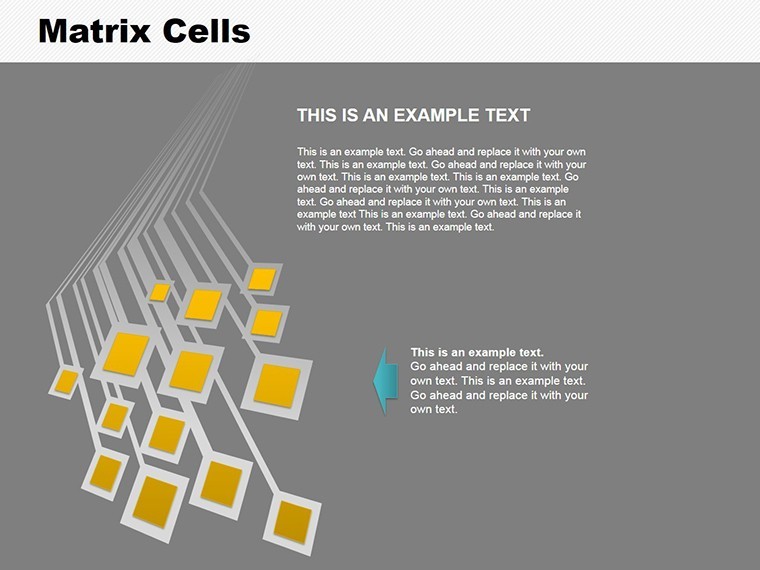
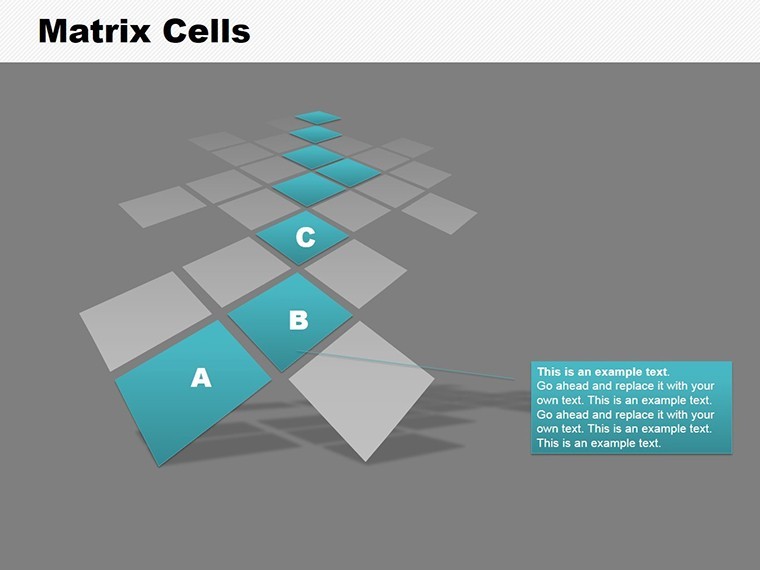
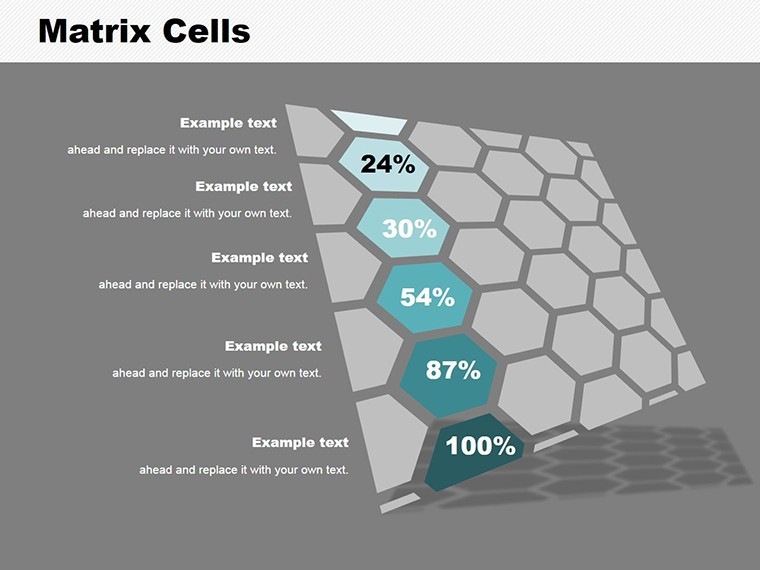
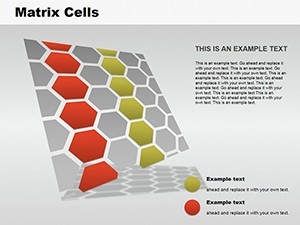
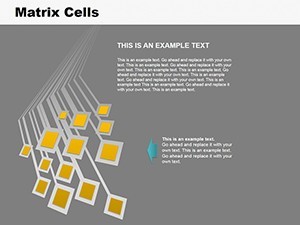
From foundational setups to advanced integrations, these slides build like a collaborative blueprint. Slide 1: A pristine empty matrix, ready for your inputs. Slide 10: Layered cells with progress indicators, tracking objective fulfillment.
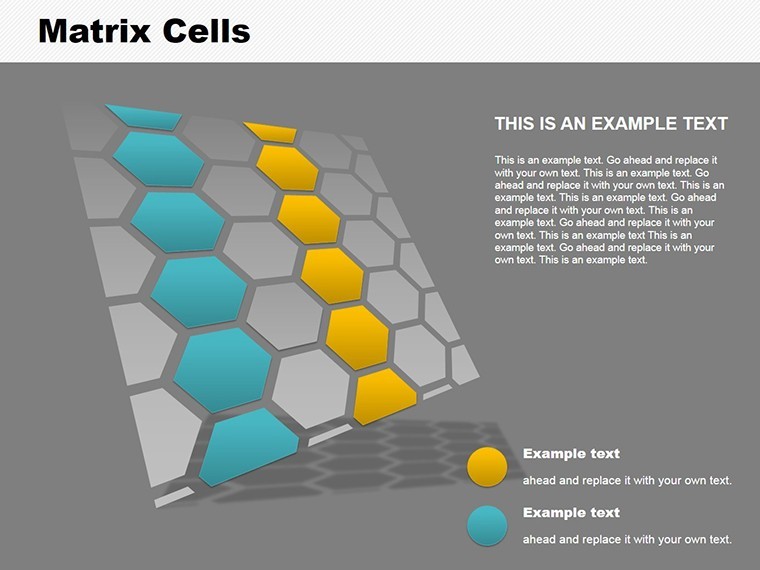
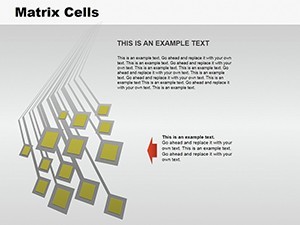
- Basic Frameworks (Slides 1-5): Simple 4x4 to 6x6 matrices, with pre-marked zones for quick starts.
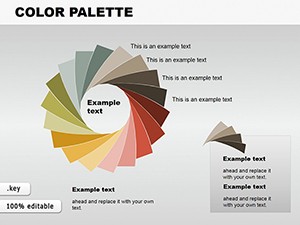
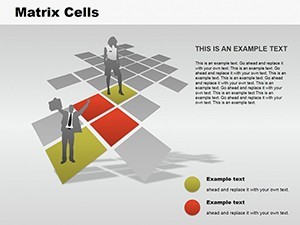
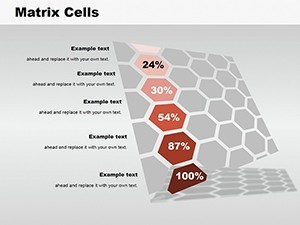
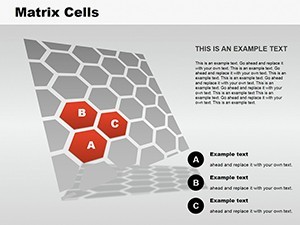
- Themed Variations (Slides 6-10): Difficulty-scaled cells - green for easy wins, red for challenges - tailored for motivational mapping.
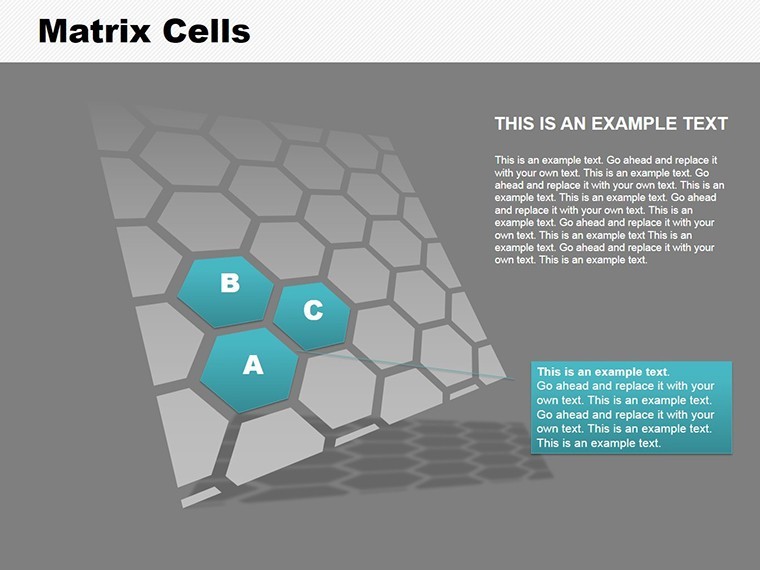
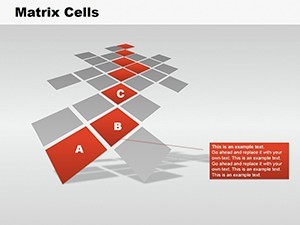
- Objective Overlays (Slides 11-13): Infuse values like "Innovation" with callouts, linking cells to broader goals.
- Review and Rally (Slides 14-15): Summary matrices with vote-ready elements for workshop closures.
Design nugget: Employ Keynote's shapes library to customize cell borders, evoking architectural precision for project visuals. In urban planning sessions, zone development phases by feasibility, turning debates into decisions.
Workflow Harmony: From Solo Edit to Group Sync
Import CSV for bulk cell fills, or collaborate via iCloud sharing. Beats ad-hoc whiteboards by offering scalable, shareable assets. For consultants, it's a staple in change management decks, contrasting chaos with ordered opportunity.
Picture a software team's sprint planning: Cells for features by effort and impact, sparking debates that resolve into prioritized backlogs - pure facilitation gold.
Use Cases That Unite and Ignite
Dive into scenarios where matrices move mountains. A nonprofit used zoned cells to align volunteer roles with mission pillars, increasing retention by 18%. Or sales teams: Map territories by potential and support needs, optimizing routes with visual logic.
- Workshop Facilitation: Assign cells for breakout topics, tracking energy levels.
- Performance Reviews: Grid competencies against growth paths for personalized development.
- Strategic Alignment: Link team objectives to company values in a unified matrix.
Trust factor: Aligned with PMI standards for project visuals, ensuring your charts stand scrutiny in audits or peer reviews.
Cell-by-Cell Customization: Unleash Potential
Color-code by department, animate fills for progress demos, or embed photos in cells for personal touch. Cap at thematic consistency to avoid visual clutter; preview in presentation mode for flow checks. It's the difference between a map and a masterpiece.
Cells aren't cages - they're launchpads for collective genius.
Zone Your Zone of Genius - Get Started
Assemble your team's matrix masterpiece today. Download the Matrix Cells Keynote Charts and foster unbreakable alignment. Mark your path to productivity - claim yours now!
Frequently Asked Questions
How many cells can I customize in the matrices?
Up to 36 per slide, with flexible grids scalable to your team's size and complexity.
Does it support PowerPoint export?
Fully - retain zoning and edits for cross-platform team shares.
Ideal for remote workshops?
Yes, with shareable links and interactive elements for virtual engagement.
Any tips for difficulty level visuals?
Use color gradients and icons; include progress bars for real-time updates.
How does it enhance emotional charge?
Visual cues promote positivity, as per design psych principles for motivation.