BCG Matrix Keynote Charts Template: Master Product Portfolio Strategy


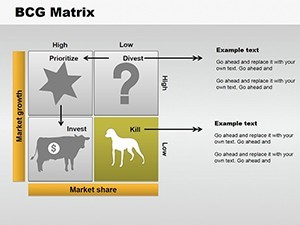
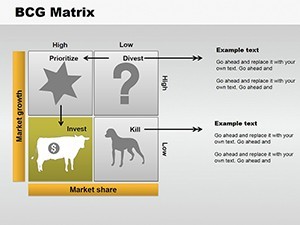

Picture this: You're in a high-stakes boardroom, unveiling a product strategy that could redefine your company's trajectory. Our BCG Matrix Keynote Charts Template equips you with 13 meticulously crafted, editable slides to make that vision a reality. Tailored for business analysts, product managers, and executives, this template demystifies the Boston Consulting Group's iconic framework, helping you categorize products into Stars, Cash Cows, Question Marks, and Dogs with visual elegance. Say goodbye to tedious chart-building and hello to insightful, data-backed presentations that spark strategic dialogues. Whether optimizing resource allocation or identifying divestment opportunities, these slides deliver clarity and impact, drawing on real-world applications seen in companies like Procter & Gamble, as noted in BCG's own case studies.
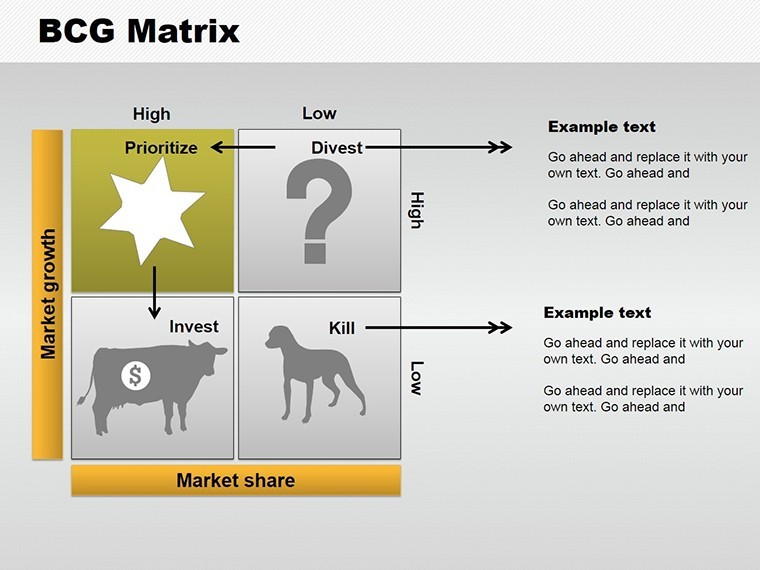
Delve into the BCG Matrix Framework
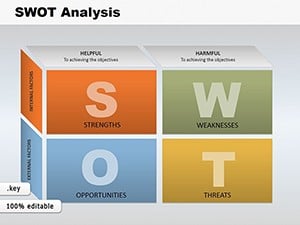
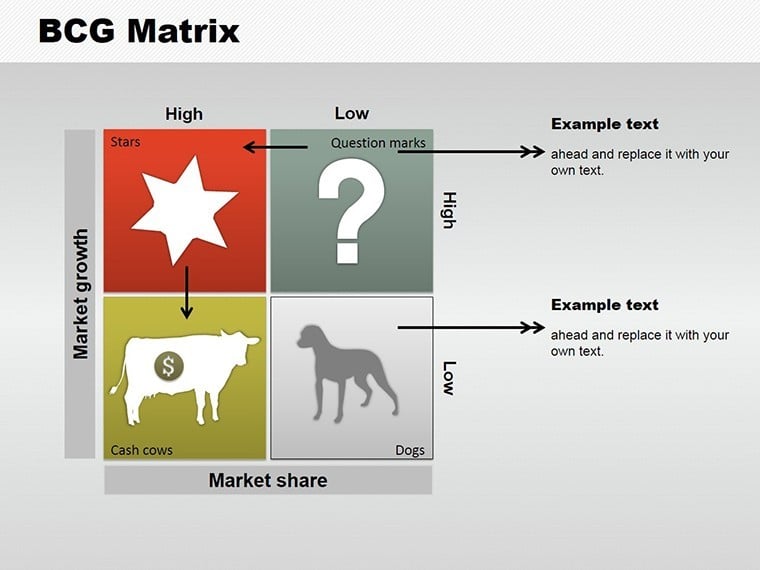
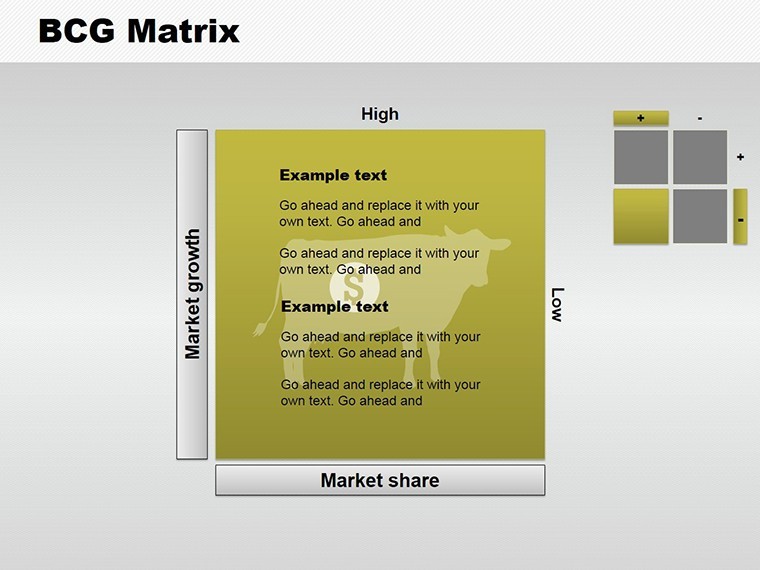
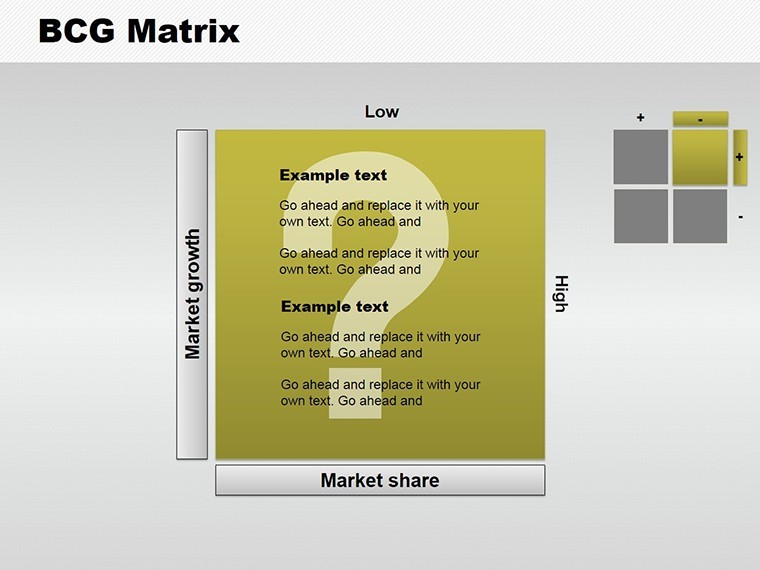
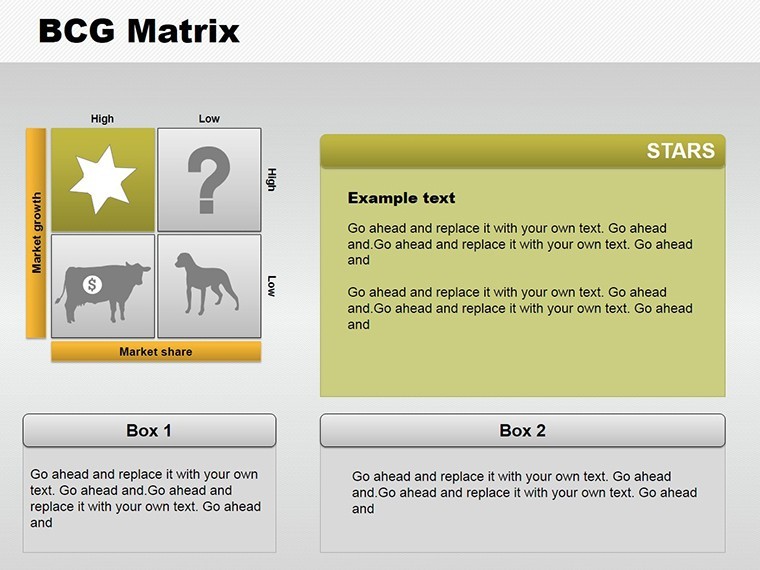
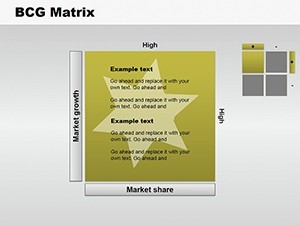
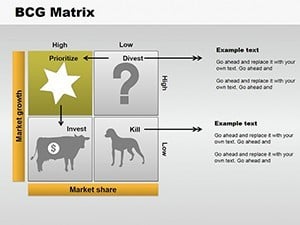
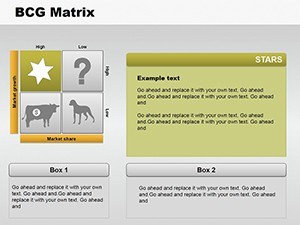
Developed in 1970 by Bruce Henderson for the Boston Consulting Group, the BCG Matrix has guided countless organizations in portfolio management. Our template enhances this tool with matrix and table designs, offering 13 slides that range from standard quadrants to advanced iterations. Edit everything in Keynote - from market share axes to growth rate labels - ensuring alignment with your data. Slide 1 introduces the classic matrix, while Slide 4 incorporates bubble charts for proportional sizing based on revenue, adding depth to your analysis.
Standout Features for Strategic Excellence
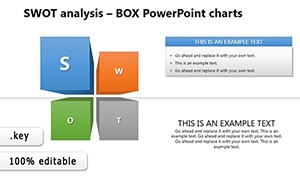
- Diverse Layouts: Includes grid matrices, tabular breakdowns, and hybrid views for comprehensive reviews.
- Full Editability: Adjust colors to your brand palette, resize bubbles, and input custom data points seamlessly.
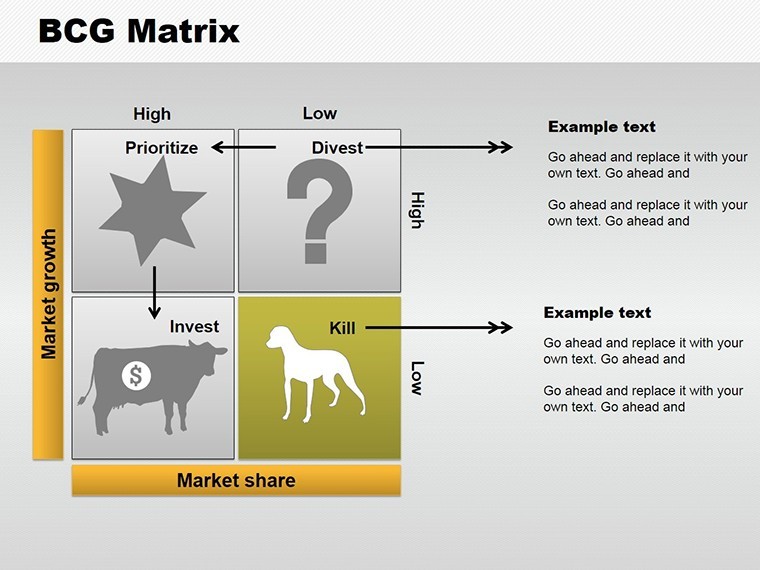
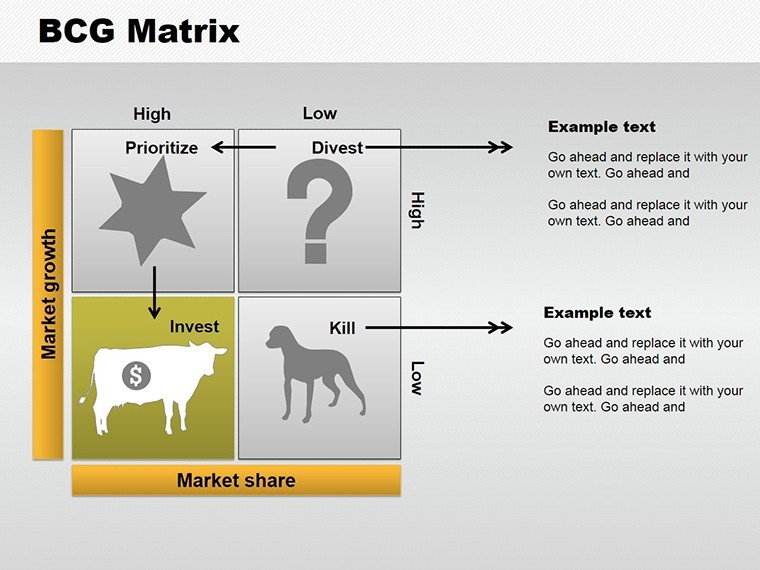
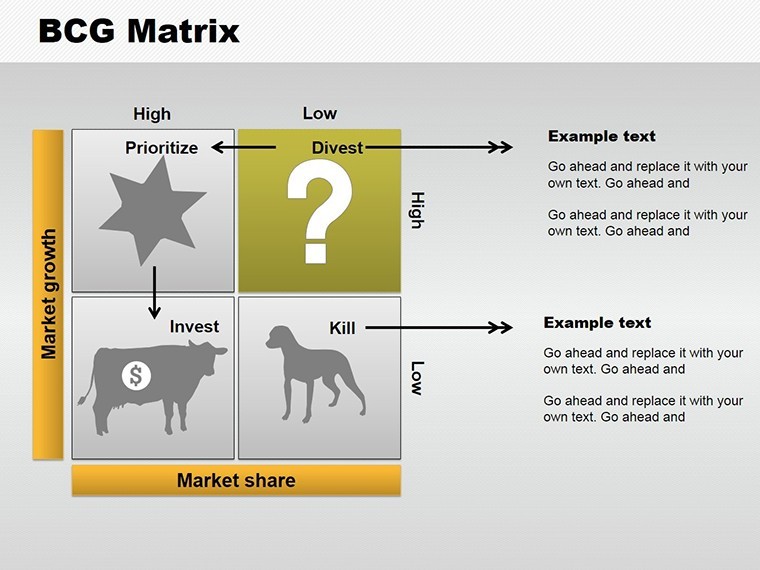
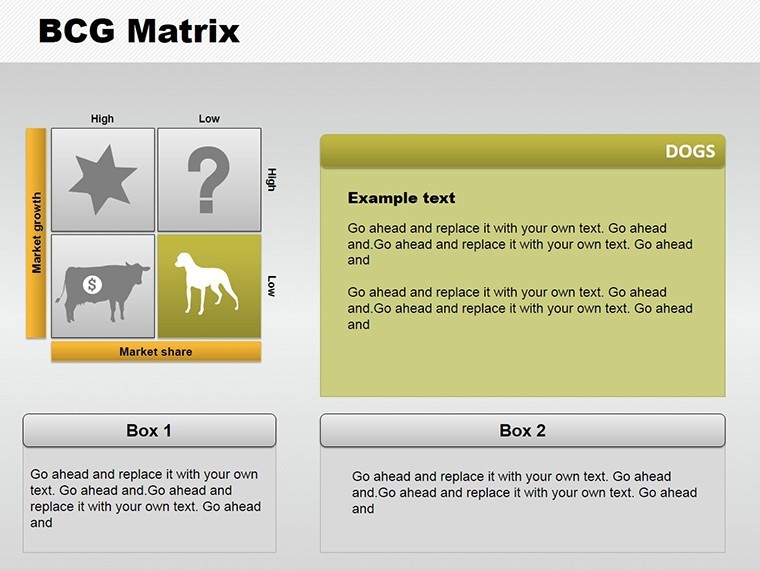
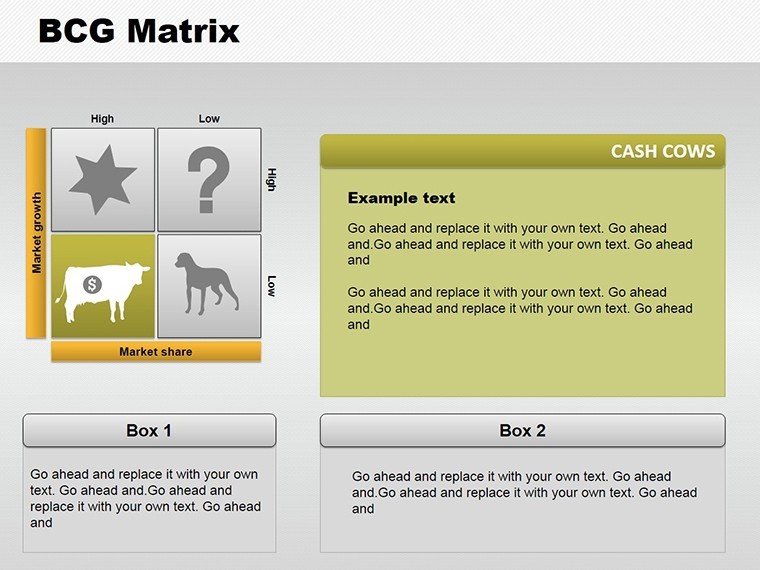
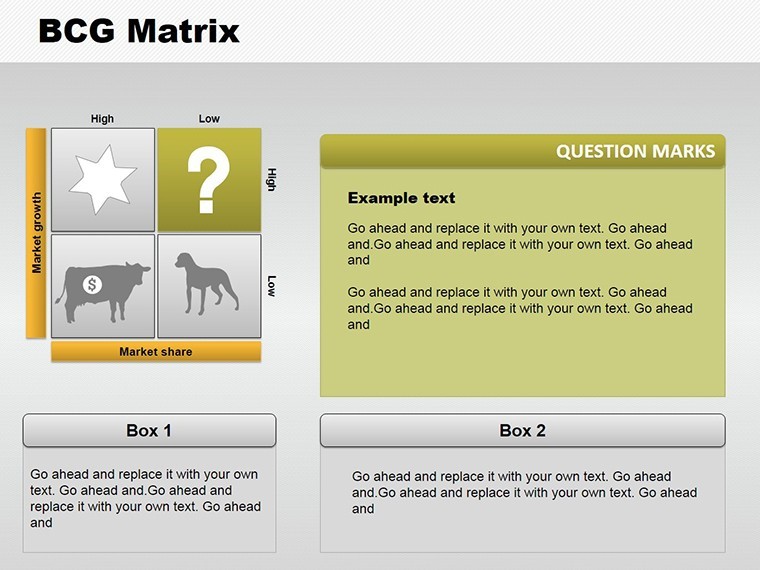
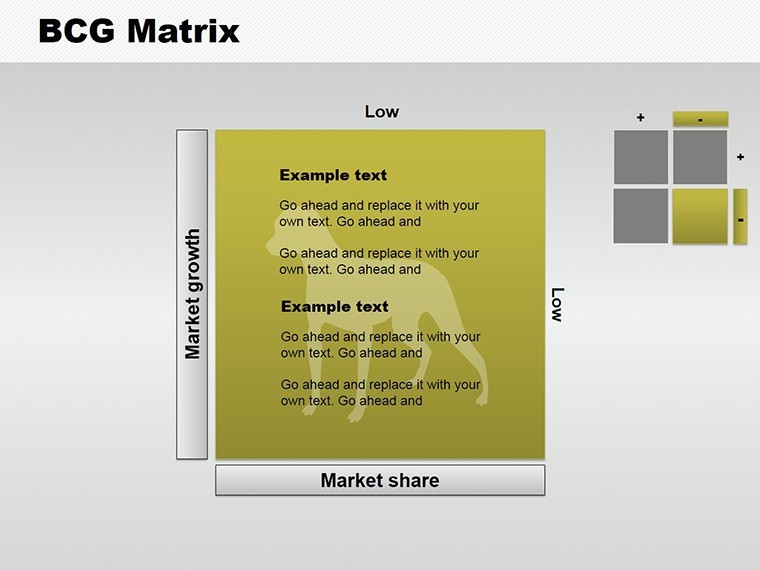
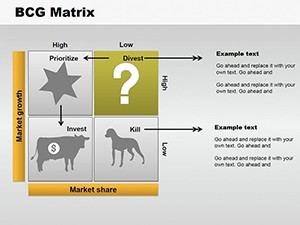
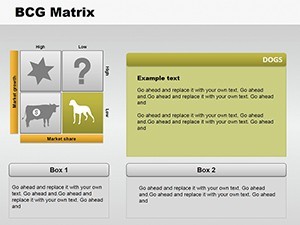
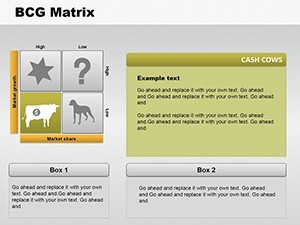
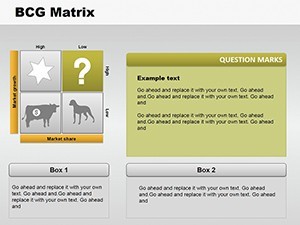
- Integrated Graphics: Vector icons for each quadrant (e.g., star for high-growth leaders) enhance visual storytelling.
- Data Compatibility: Link to spreadsheets for automatic updates, keeping your matrix current.
- Professional Polish: Pre-set animations reveal quadrants one by one, building narrative tension.
The benefits extend beyond design: This template addresses the frustration of mismatched visuals in strategy sessions. A tech firm, inspired by BCG methodologies, used similar matrices to pivot their portfolio, boosting efficiency by 30%, per a McKinsey report on strategic tools.
Practical Scenarios: Applying the BCG Matrix
Harness this template across industries. For e-commerce leaders, map product lines on Slide 6's detailed matrix to spot Cash Cows funding Question Marks. In pharmaceuticals, use Slide 9's comparative tables to evaluate R&D investments against market growth, aligning with FDA timelines and industry benchmarks.
Guided Workflow: Building a Portfolio Review
- Gather Data: Input market share and growth rates into Slide 2's foundational chart.
- Categorize Products: Assign items to quadrants on Slide 5, with tooltips for explanations.
- Analyze Implications: Use Slide 8 for strategy recommendations, like harvesting Dogs.
- Present Findings: Conclude with Slide 12's summary dashboard for executive overviews.
Such workflows mirror how Amazon employs BCG principles to manage diverse offerings, from AWS (a Star) to mature retail segments (Cash Cows), fostering sustained growth.
Pro Tips from a Strategy Specialist
Incorporate terms like "product lifecycle management" organically to enhance search relevance. For trustworthiness, reference authoritative sources - BCG publications or Gartner reports - to bolster your . Avoid generic slides by personalizing with your metrics.
- Integration Ideas: Sync with Google Sheets for collaborative editing.
- Design Advice: Balance quadrants with equal spacing for aesthetic harmony.
- Engagement Hacks: Add hyperlinks to detailed reports within slides.
Unlike rudimentary Keynote options, this template's tables offer sortable data, elevating your analysis from static to interactive.
Secure Your Strategic Advantage Now
Empower your decisions with the BCG Matrix Keynote Charts Template. Tailor it to your needs and lead with confidence. Why wait? Download and revolutionize your portfolio strategy today.
Frequently Asked Questions
What makes this BCG Matrix template unique?
It combines matrix and table formats with editable elements, tailored for professional strategy sessions.
Does it support data import from other tools?
Yes, easily import from Excel or Sheets for real-time synchronization.
Is the template suitable for beginners?
Absolutely, with intuitive edits and pre-filled examples to guide you.
What versions of Keynote are compatible?
Works with Keynote 6.0 and above on Mac devices.
Can I customize the quadrant icons?
Yes, swap or modify icons to fit your branding.