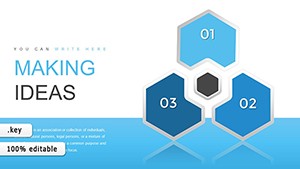
Hexagon with Eccentric Keynote Charts


When it comes to dissecting multifaceted concepts in architecture, nothing beats a visually striking tool that breaks down parameters into digestible parts. Enter the Hexagon with Eccentric Keynote Charts template - a geometric powerhouse designed to highlight six key conditions or variables, represented by a central hexagon and orbiting 'balls' labeled for clarity. With 18 editable slides, this template is a boon for architects tackling complex analyses, like evaluating eco-friendly building materials against cost, durability, and aesthetics. Imagine presenting a LEED-certified project where each eccentric element spotlights a sustainability metric, turning abstract data into an interactive story that engages clients and stakeholders alike.
Drawing from real-world expertise, such as AIA guidelines on sustainable design, this template helps you align presentations with industry standards, fostering trust and authority. Its cycle and analysis focus makes it ideal for iterative processes, where variables evolve - think refining a building's energy efficiency model through successive reviews. The eccentric design adds a modern twist, differentiating your slides from mundane bar graphs, and with full editability, you can adapt it to any project narrative.
Standout Features for Precision Visualization
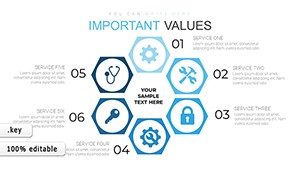
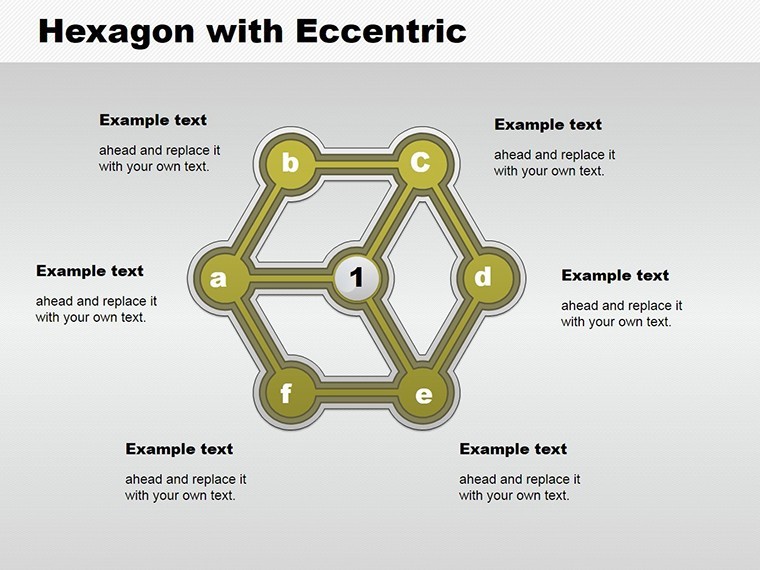
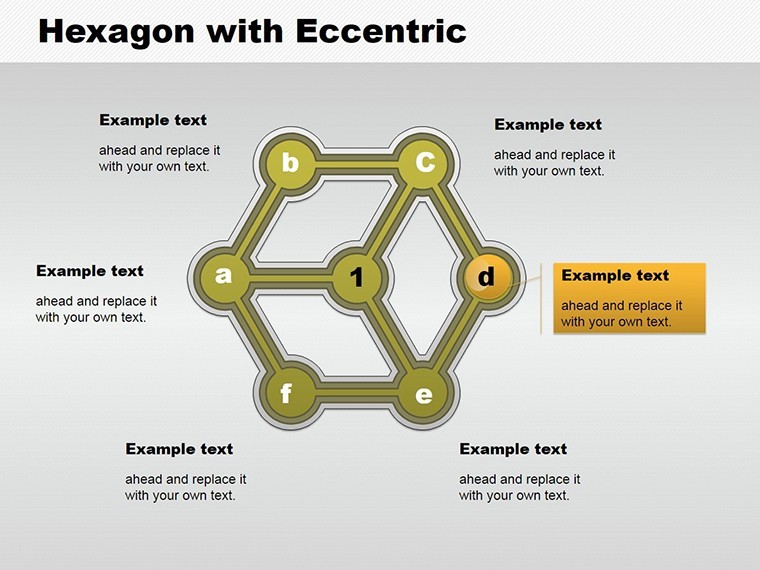
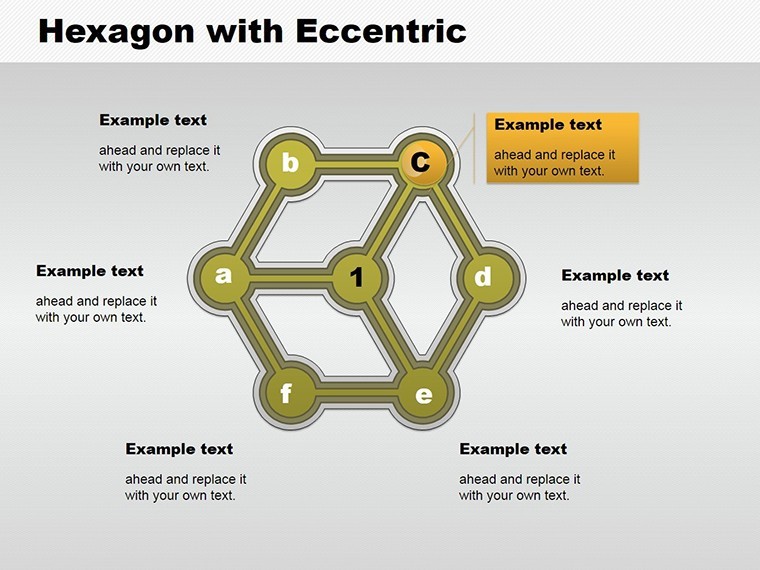
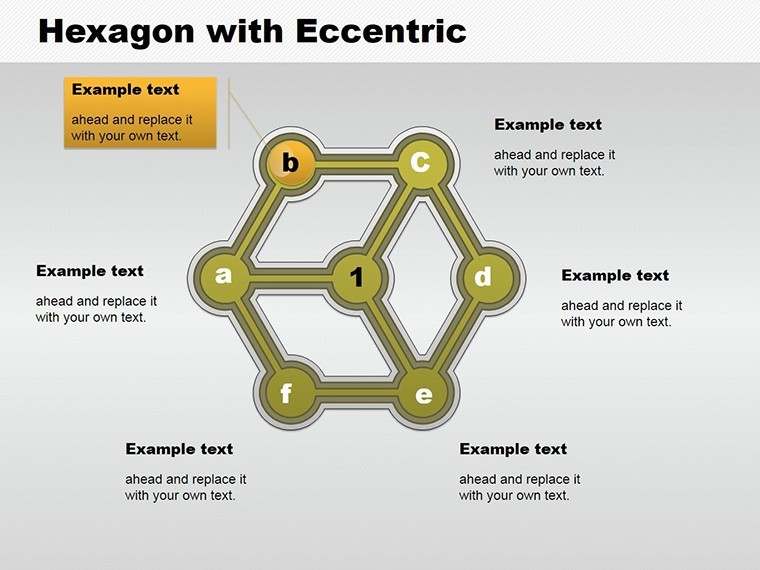
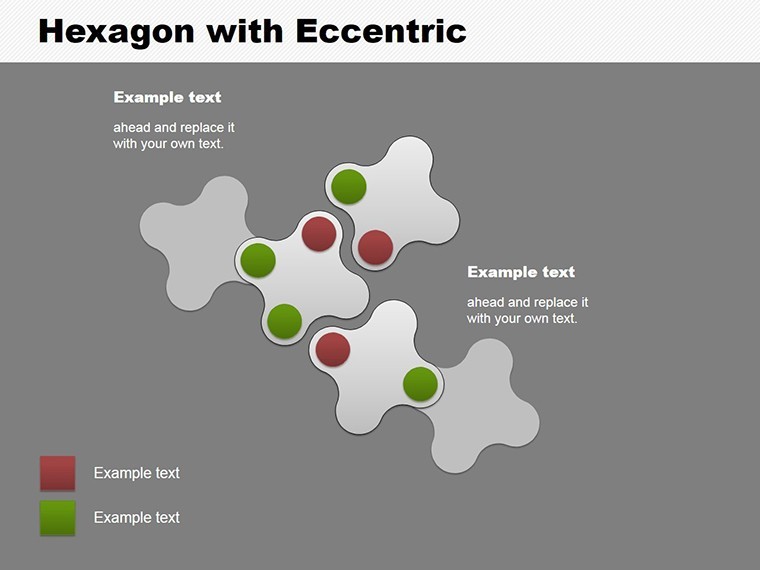
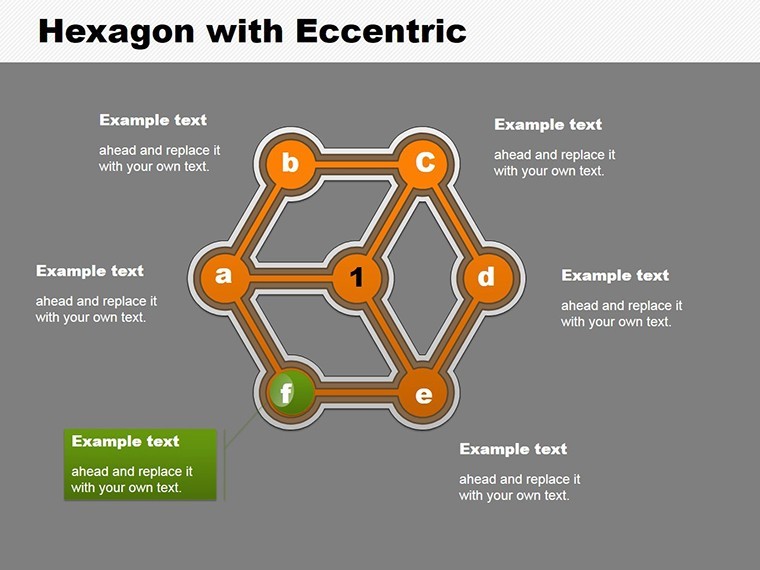
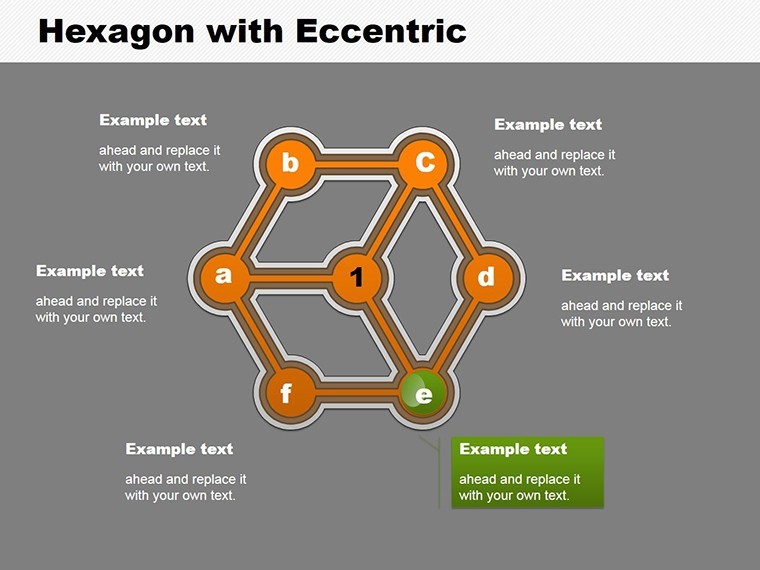
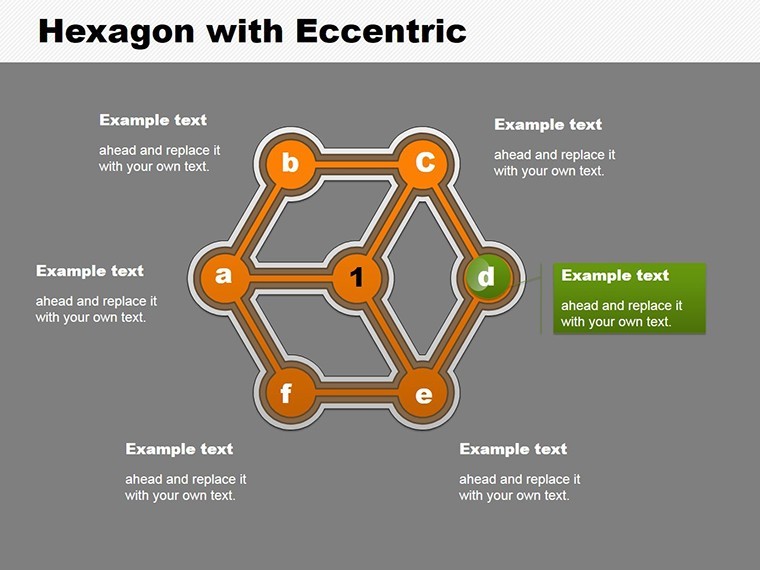
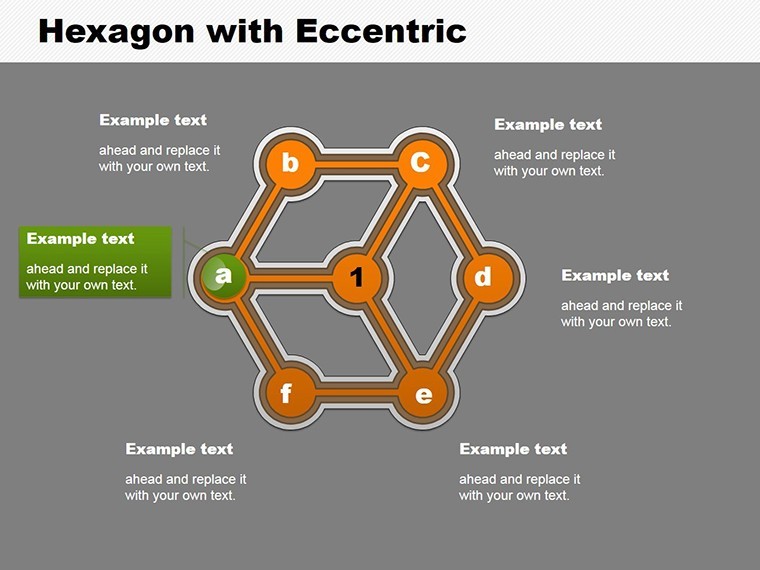
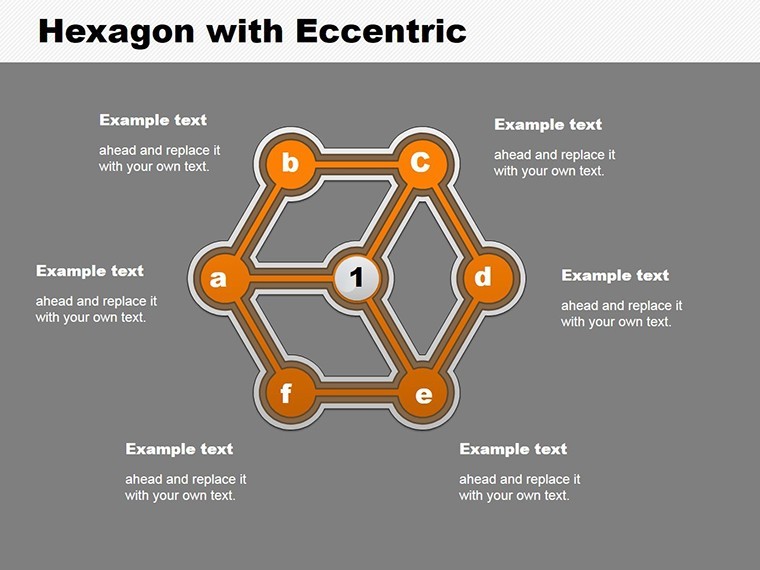
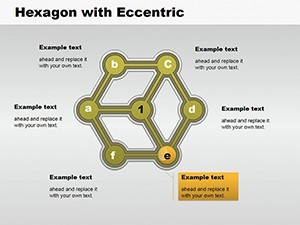
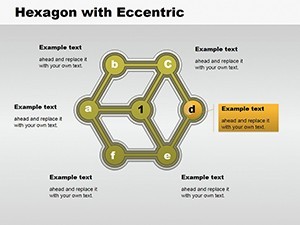
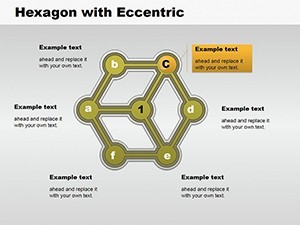
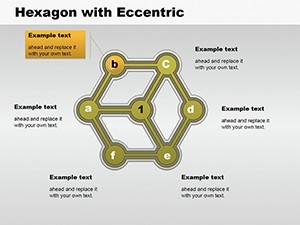
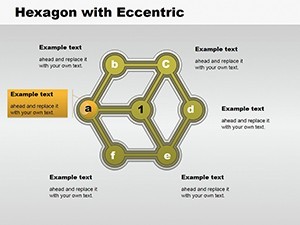
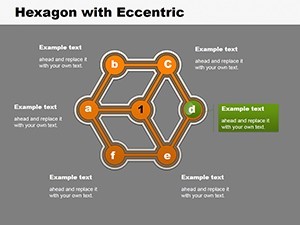
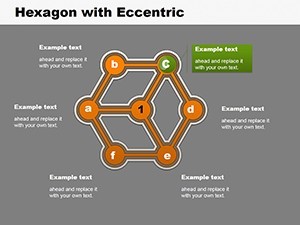
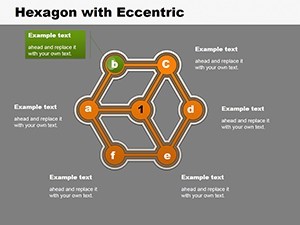
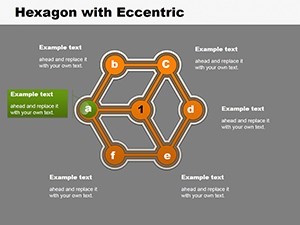
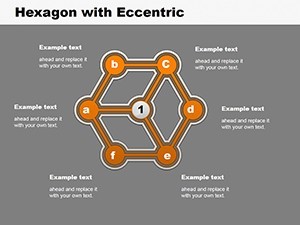
This template's core strength lies in its innovative structure: a main hexagon anchoring the discussion, surrounded by variable balls that denote specific parameters. Across 18 slides, variations explore different configurations, from simple six-point analyses to layered cycles. For architects, this means mapping out factors like site constraints, regulatory compliance, and innovative tech integrations with ease.
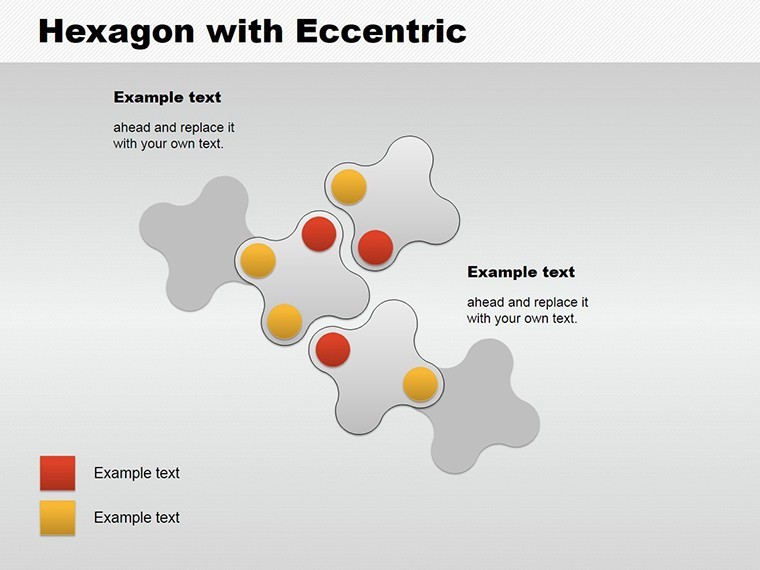
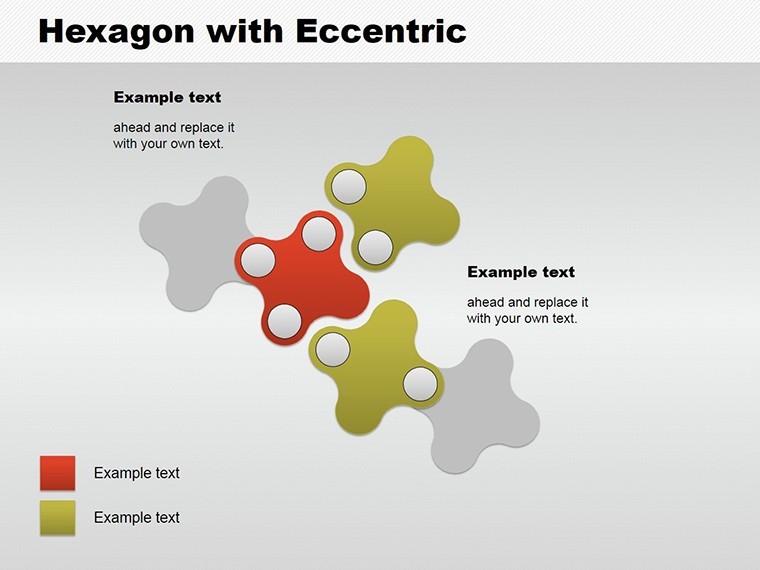
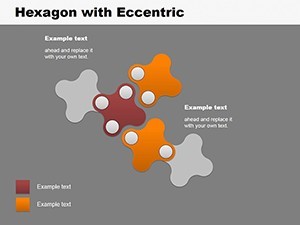
- Geometric Eccentricity: Unique ball elements for labeling variables, adding depth to standard hexagons.
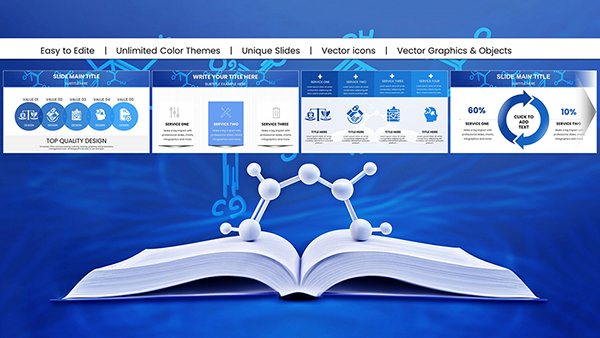
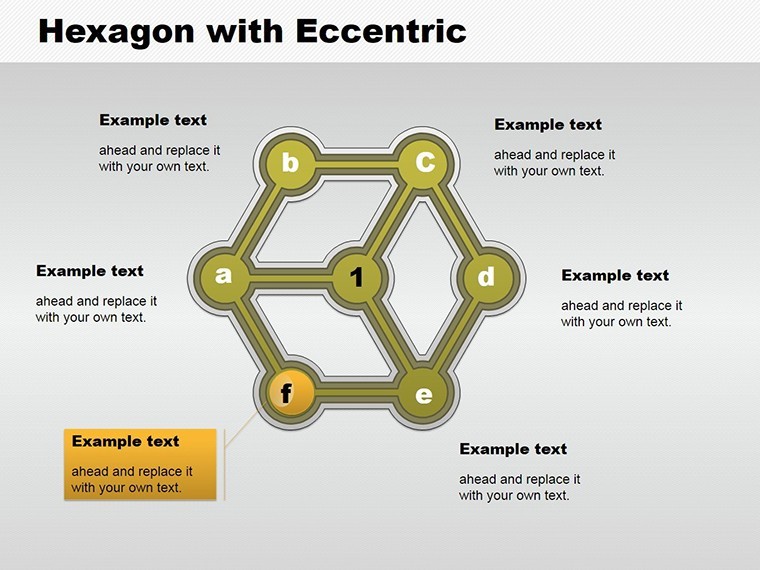
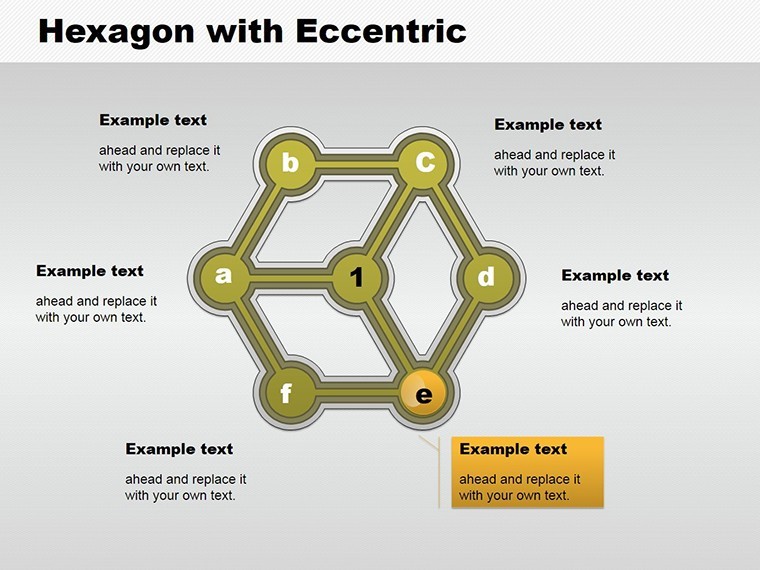
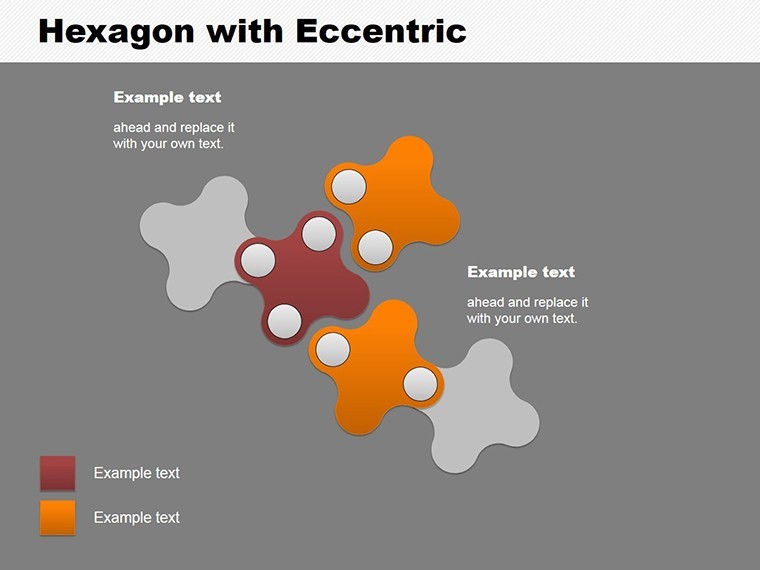
- Extensive Slide Variety: 18 options to cover basic to advanced analyses, ensuring comprehensive coverage.
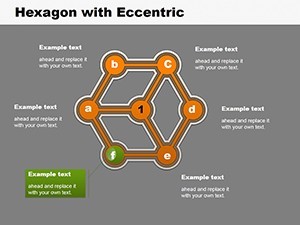
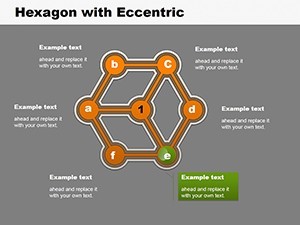
- Full Customization: Edit shapes, colors, and texts to reflect project-specific data, like urban planning palettes.
- Cycle Integration: Perfect for showing iterative processes, such as design feedback loops.
- Keynote Optimization: Built for .key files, with smooth animations to reveal elements progressively.
Unlike basic Keynote shapes, which lack this specialized eccentricity, our template incorporates dynamic elements that simulate real-world variability, inspired by case studies from firms like Foster + Partners, where parametric design tools have revolutionized presentations.
Practical Use Cases Tailored to Architecture
In practice, start with a blank slide: Define your central theme in the hexagon, then assign variables to the balls - perhaps structural integrity, cost efficiency, aesthetic appeal, environmental impact, timeline feasibility, and client preferences for a residential project. Animate the reveal to build suspense during pitches, aligning with AIA's emphasis on clear communication.
A notable example: In a recent high-rise development in New York, similar hexagon charts clarified six zoning parameters, expediting city approvals. For educators in architecture schools, use it to teach systems thinking; for consultants, analyze market cycles. Workflow tip: Import data from tools like Revit, customize visuals, add notes, and export - streamlining your prep time.
Expert Tips to Amplify Your Presentations
Elevate further by incorporating icons for each ball, such as green leaves for sustainability, enhancing visual storytelling. Maintain trustworthiness with data citations, boosting signals. Weave in LSI terms like parametric charts, cycle diagrams, or editable Keynote visuals organically to aid discoverability.
This template solves common pitfalls, like overcrowded slides, by focusing on six essentials, ensuring your audience grasps the big picture without overload.
Transform Your Analytical Pitches Now
Embrace the Hexagon with Eccentric Keynote Charts to unlock new dimensions in your architectural presentations. With its blend of form and function, it's your key to persuasive, data-driven narratives. Download and customize today to stand out in your next review.
Frequently Asked Questions
- What makes the eccentric design unique?
- It features variable balls around the hexagon for dynamic parameter representation, ideal for complex analyses.
- How many slides are included, and are they editable?
- 18 fully editable slides, allowing changes to shapes, labels, and colors.
- Is this suitable for cycle-based presentations?
- Yes, it's categorized for cycles, perfect for iterative architectural processes.
- Can I add animations?
- Absolutely - Keynote's tools let you animate elements for engaging reveals.
- What file format is it?
- .key, compatible with Apple Keynote on Mac and iOS.
- Any tips for integration with architecture software?
- Export data from Revit or AutoCAD and paste directly into slides for seamless use.