Cloud Services Infographic Keynote Charts - Editable | ImagineLayout


Type: Keynote Charts template
Category: Relationship, Illustrations
Sources Available: .key
Product ID: KC00679
Template incl.: 34 editable slides
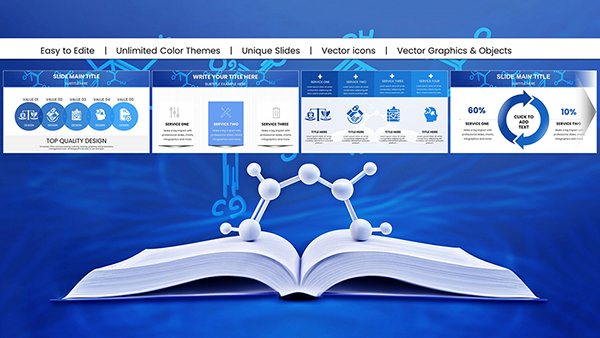
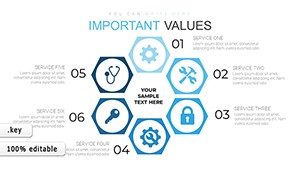
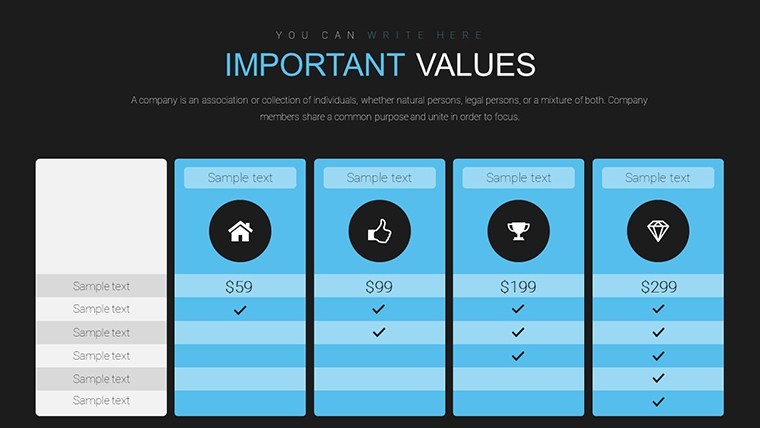
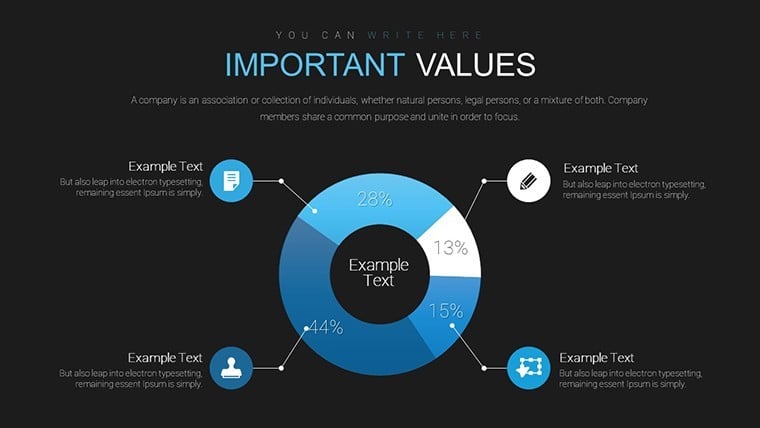
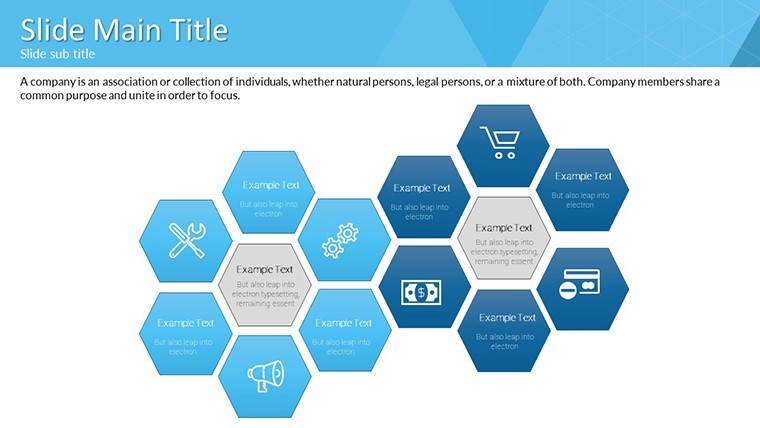
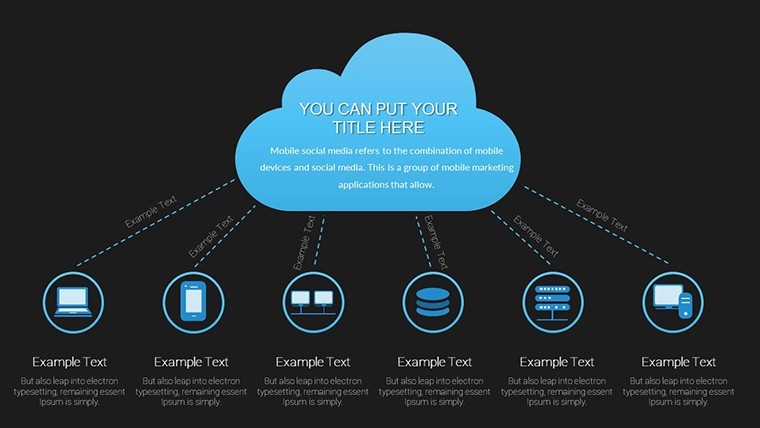
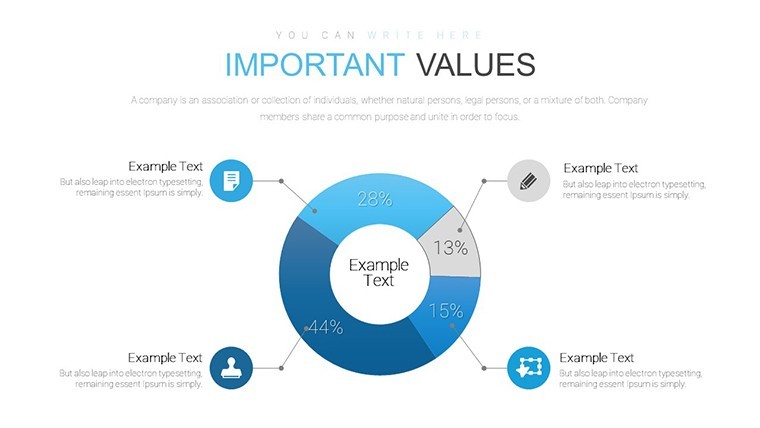
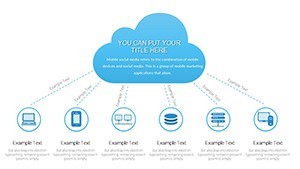
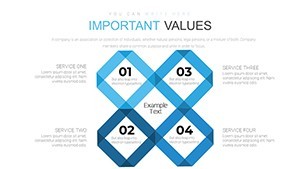
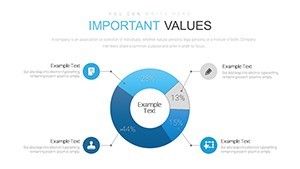
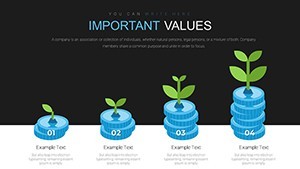
Cloud Services Infographic Keynote Charts Template
When you need to present cloud services architecture to clients the 34 slide KEY file gets you started right away. The paid version includes 34 editable slides.
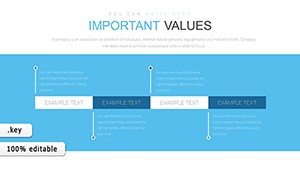
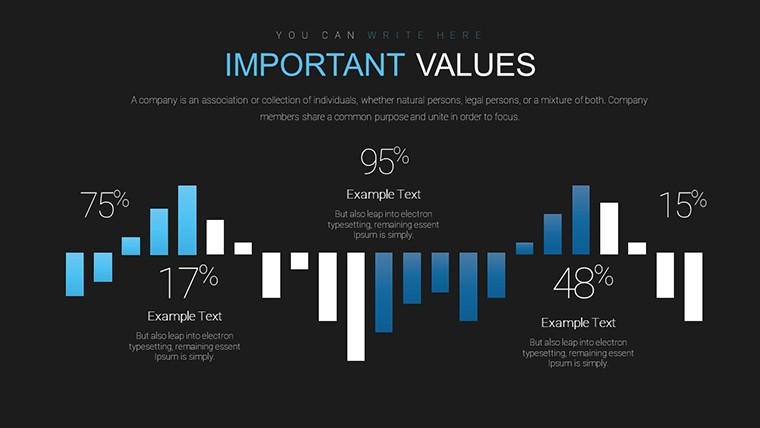
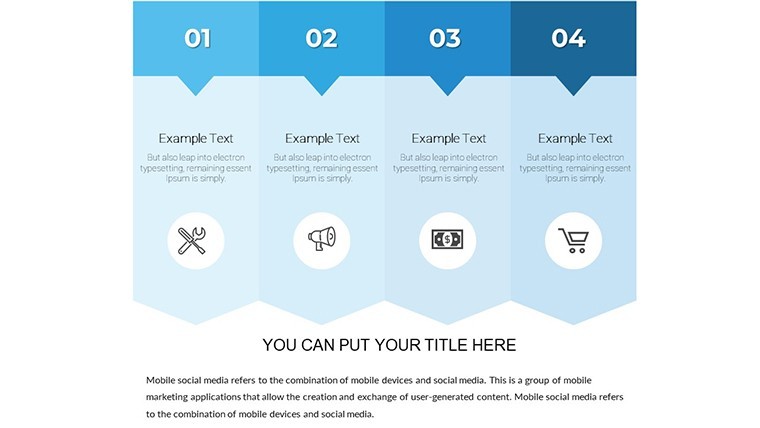
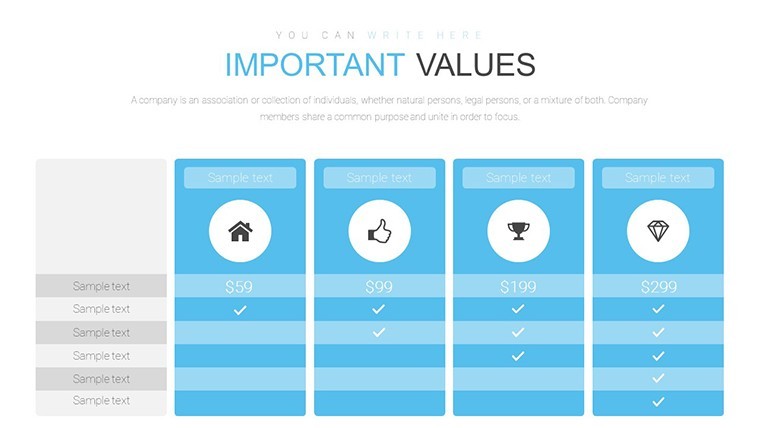
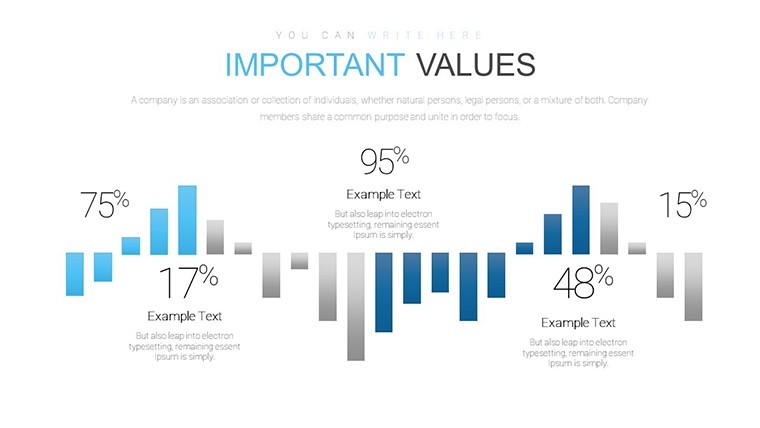
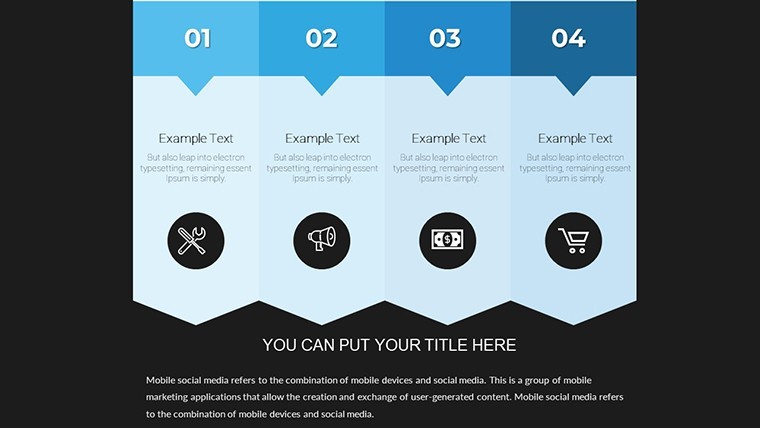
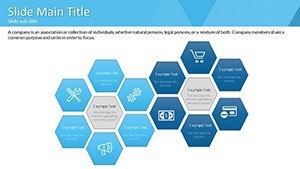
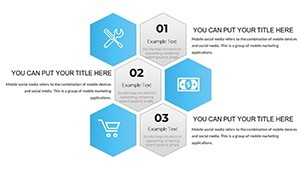
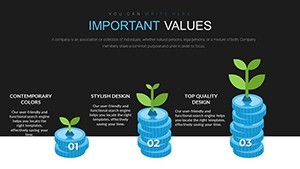
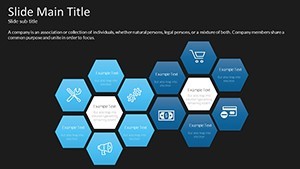
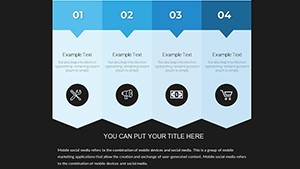
No complex layouts, just structured blocks.
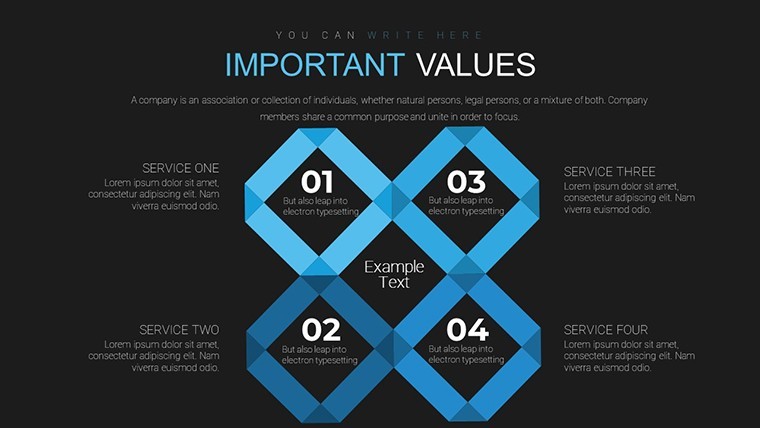
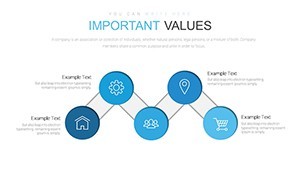
In practice you replace icons and text while the infographic layout stays intact. The page does not list color schemes or free version details but paid gives full access.
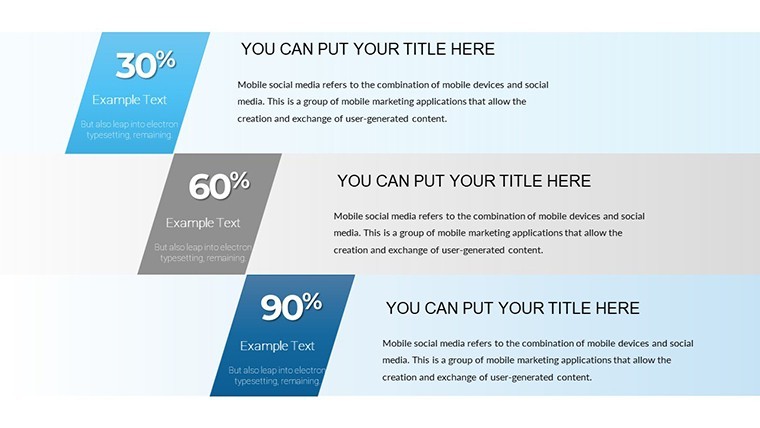
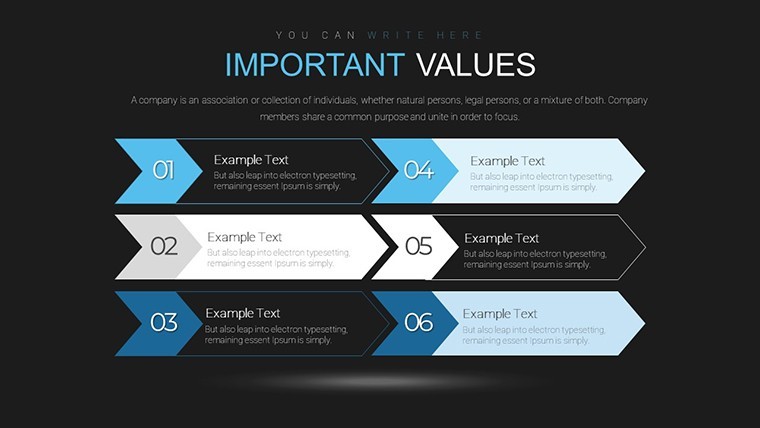
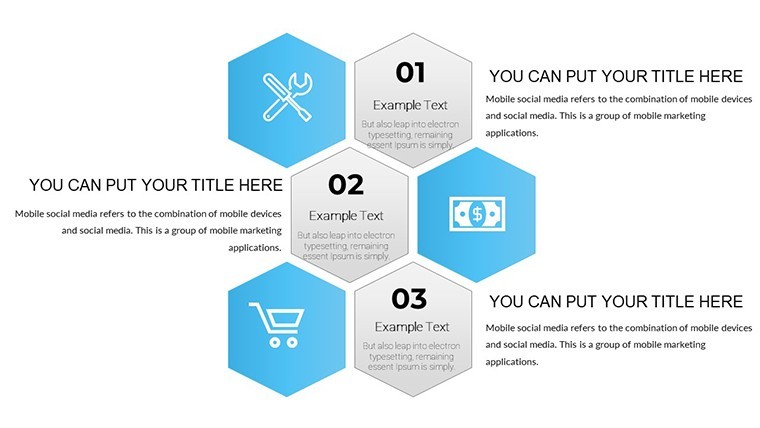
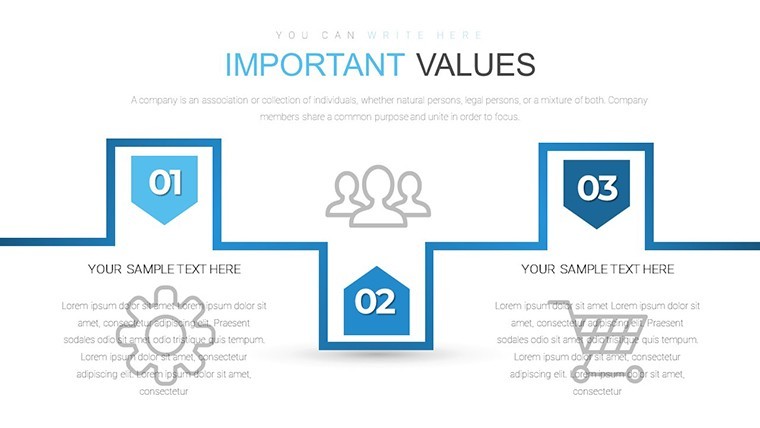
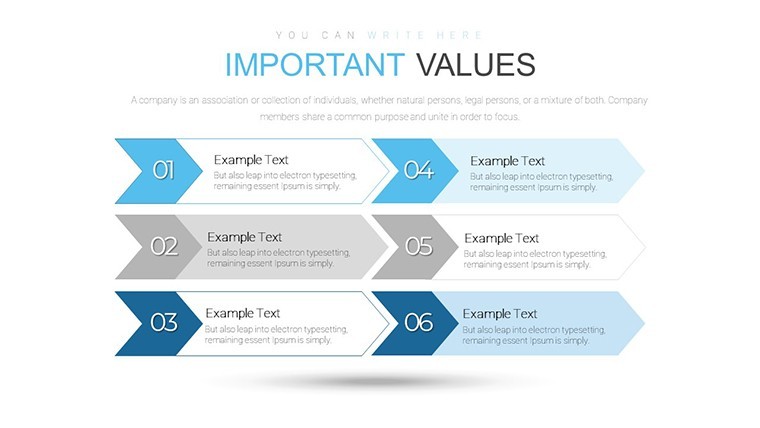
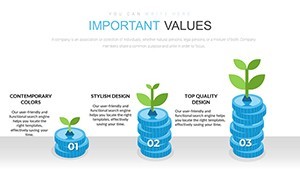
IT managers explaining service stacks to internal teams benefit most from this setup. The file removes manual icon placement so you focus on the message instead of design hurdles.
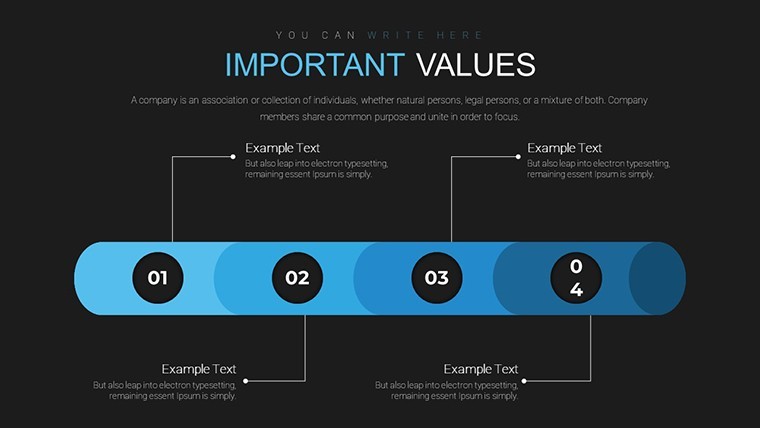
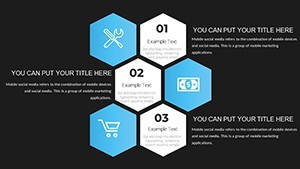
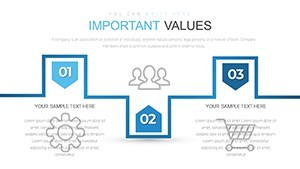
You can reuse the same structure for recurring presentations. Color changes happen via the slide master in Keynote. Drag-and-drop ease lets you update content in minutes.
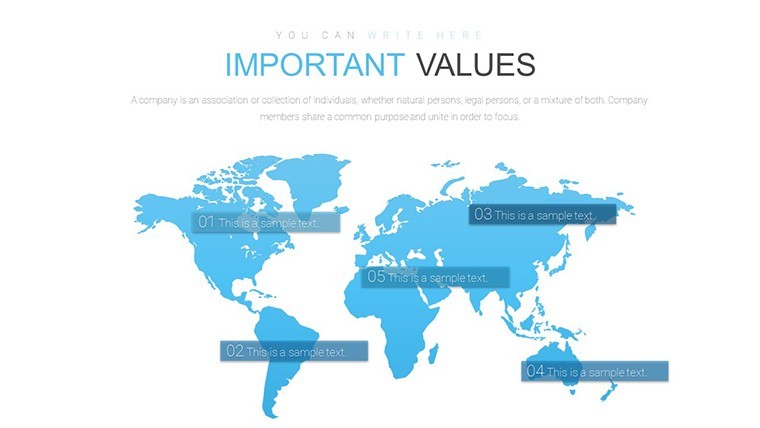
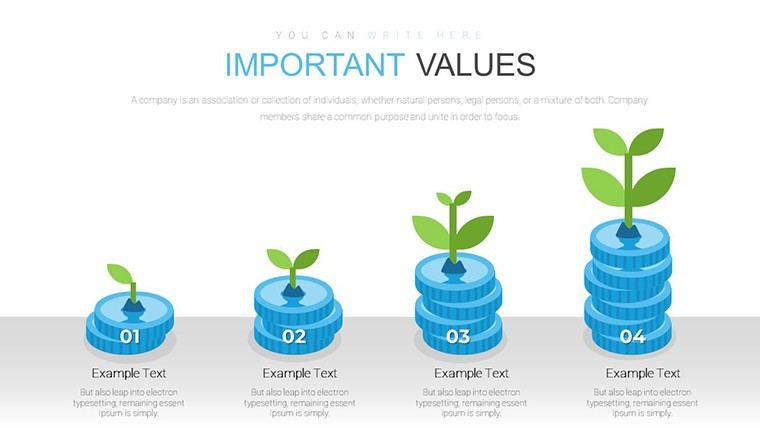
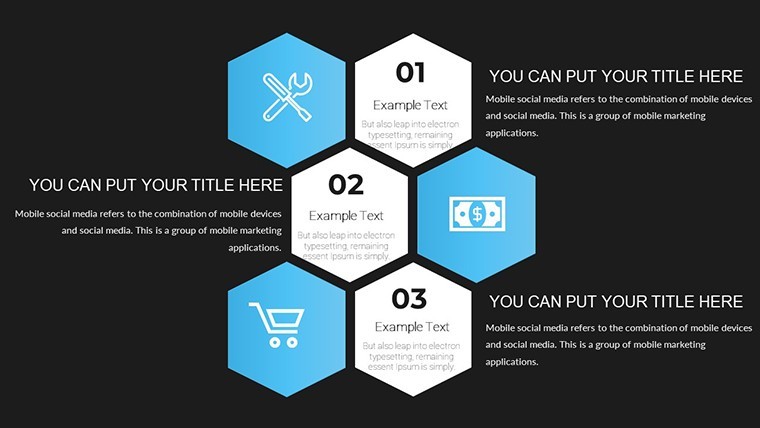
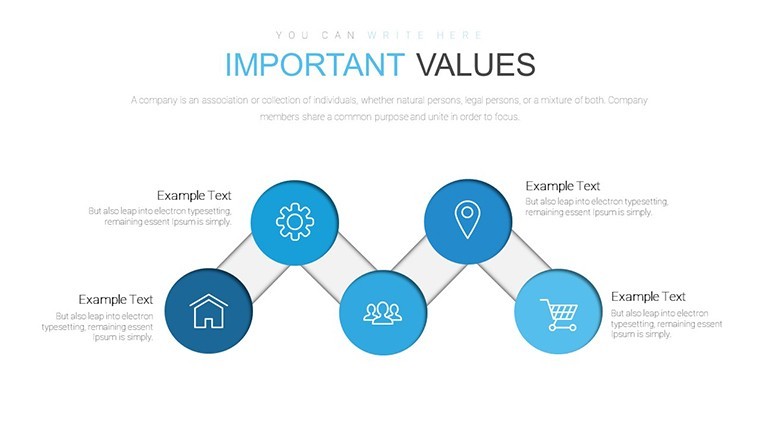
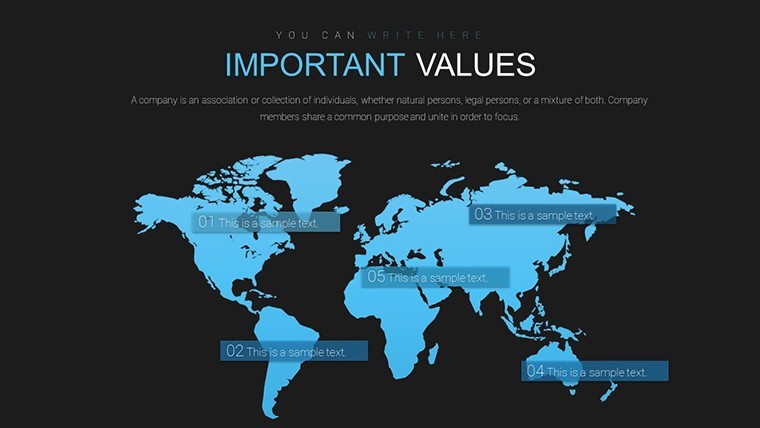
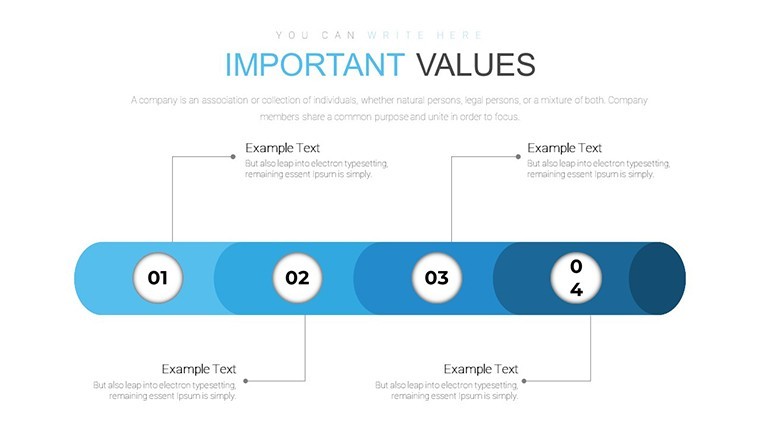
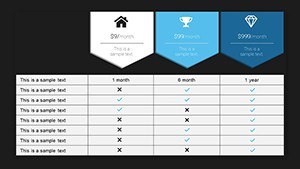
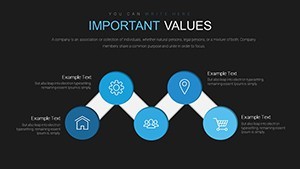
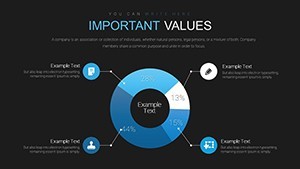
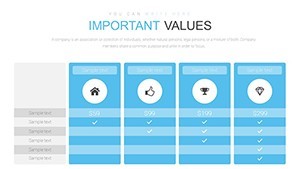
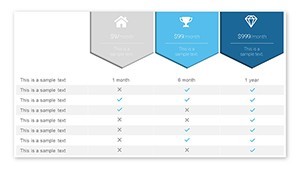
This Keynote chart template supports relationship mapping for services. After using it you identify which components connect best and make informed decisions on architecture choices.
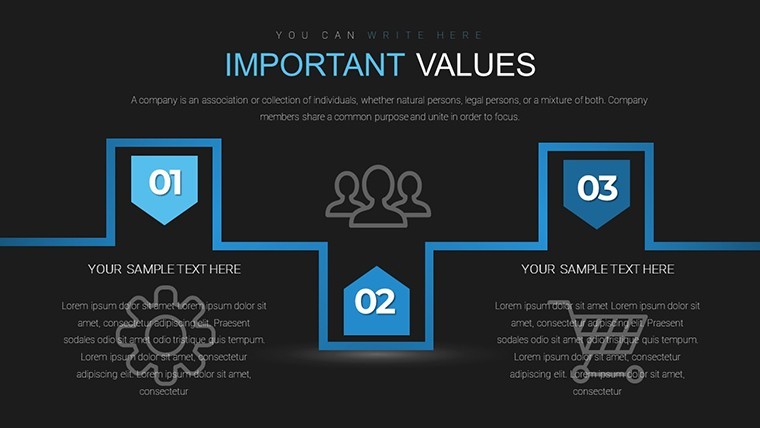
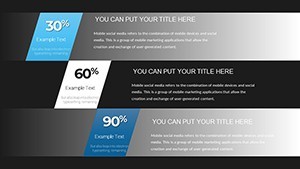
It works best for modular service overviews not creative storytelling slides. The file is not ideal when you need heavy animation sequences beyond basic Keynote effects.
See also Business Analysis Charts Keynote and Custom Cycle Process Charts for Keynote.
Specifications
| Feature | Details |
|---|---|
| Slides / diagrams | 34 cloud services infographic slides |
| File format | KEY |
| Software version | Keynote recent versions with animations |
| Color schemes | Not specified on page, edit via master |
| Editable elements | icons, fonts, layouts and data points fully adjustable |
| Aspect ratio | 16:9 |
| Free vs Paid | Paid includes 34 editable slides |
| Masters / Backgrounds | Fully editable masters |
How do I change colors via the slide master?
To change colors open the slide master view in Keynote. Select the master slide and update the color palette for all objects. Apply the changes and they propagate to every diagram automatically in most cases. The process takes under a minute once you know the steps.
Can I use this template for client work?
You can use the template for client work under the standard license. The file remains your property but you cannot resell the original design as is. Contact support for enterprise licensing if needed for multiple users.
What is the difference between free and paid?
The paid version delivers the complete set of 34 editable slides. The page does not specify what the free version includes exactly. In practice you get the full diagrams only with the paid purchase.
What are the refund conditions?
Refunds are processed if the file does not open correctly in your Keynote version. Submit a request within 30 days with your download details. The team reviews and issues a refund if the issue cannot be resolved with support guidance.
Is it compatible with PowerPoint 2016/2019/365/Mac?
The template is optimized for Keynote but convertible to other formats if needed. Minor adjustments may be required for full PowerPoint compatibility. Test the converted file to confirm all elements remain editable.
You open the file and start editing.
Download and start editing immediately