Floral Keynote Charts Template - Instant Download | ImagineLayout


Files and Formats Included
8 slides.
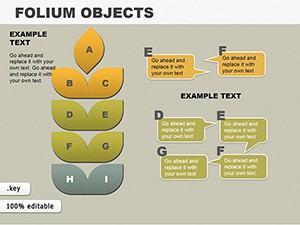
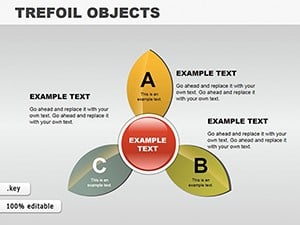
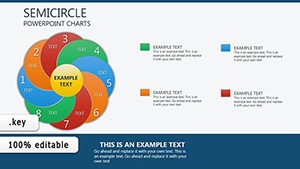
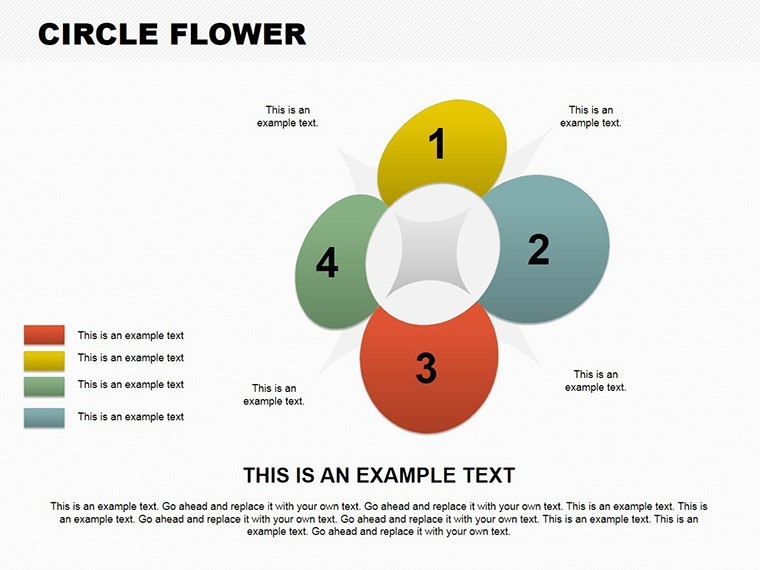
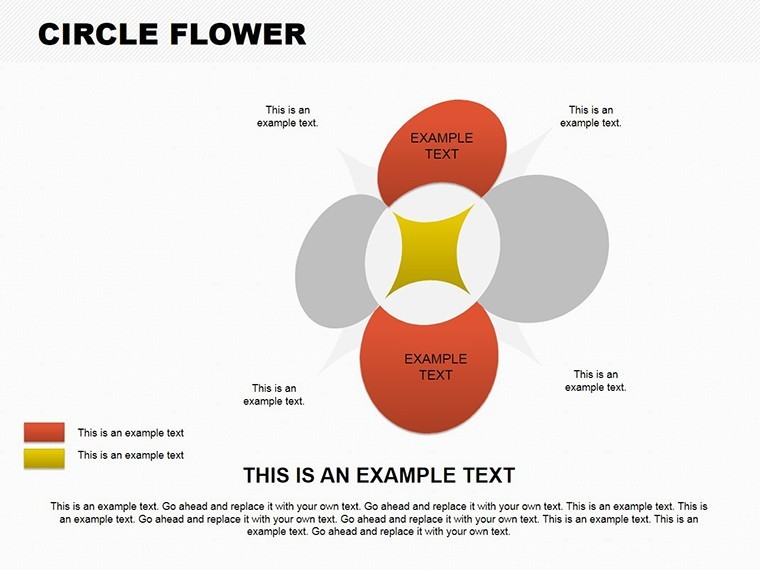
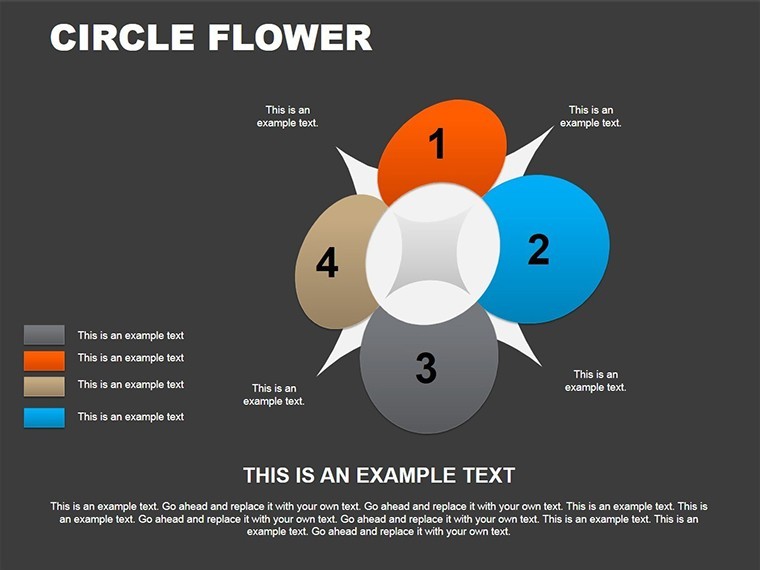
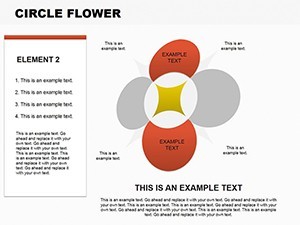
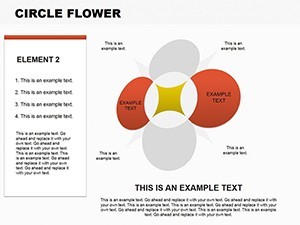
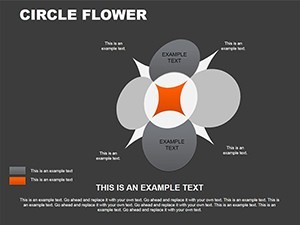
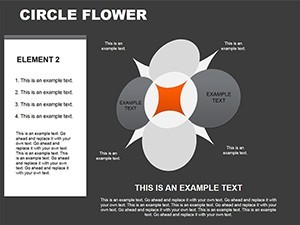
Cycle diagrams and pie charts with petal motifs fill the set.
One .key file arrives instantly.
Blooming animations come pre set.
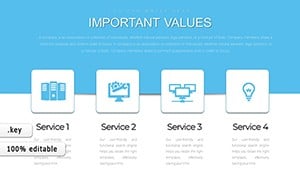
Marketer and educator designs support training sessions.
Technical Specs
| Feature | Details |
|---|---|
| Slides included | eight floral themed slides |
| Diagram categories | cycle pie with petal motifs |
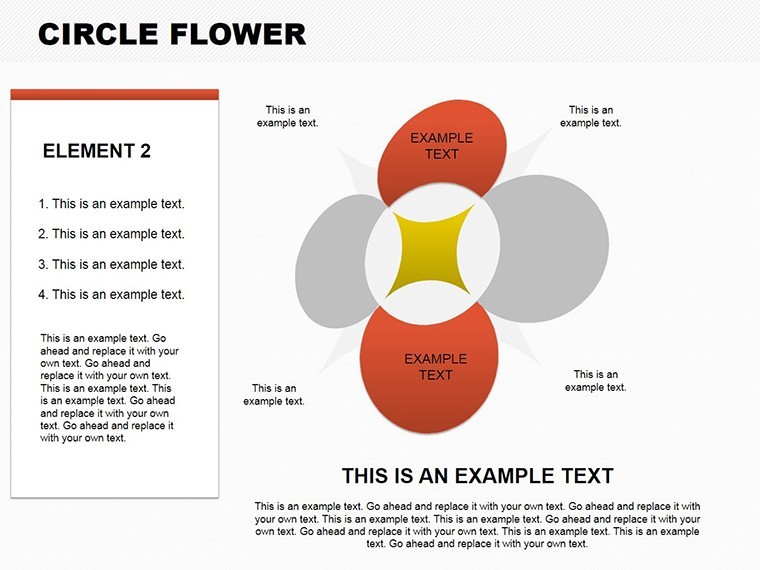
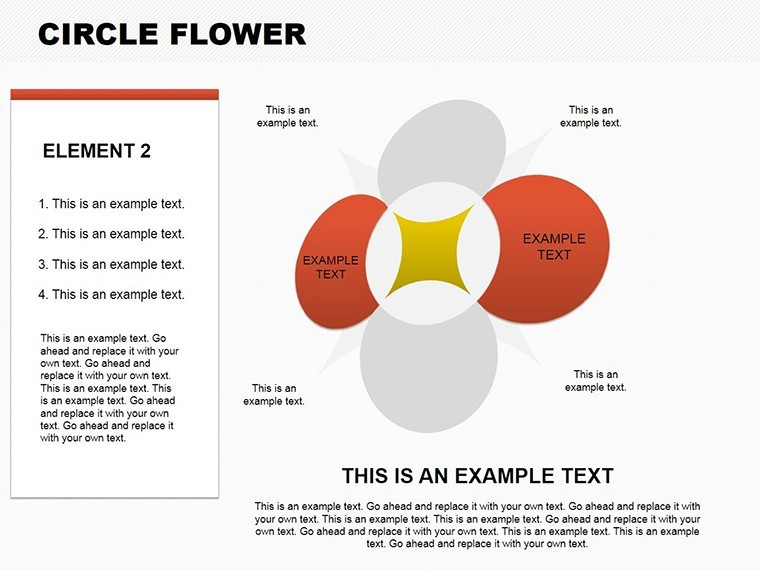
| Editable elements | text placeholders icon layers color theme adjustments |
| Aspect ratio | 16:9 default |
| PowerPoint compatibility | Keynote native no conversion needed |
| Animation support | blooming effects included and editable |
Format compatibility stays seamless.
Diagram connectors adjust freely.
How to Make It Yours in Under 20 Minutes
- Step 1 - Open .key file takes one minute.
- Step 2 - Replace text takes three minutes.
- Step 3 - Customize petal colors takes two minutes.
- Step 4 - Trigger blooming animation takes one minute.
Total time stays under eight minutes.
Editing difficulty sits at beginner level.
You change colors without a designer.
It opens in Keynote 12 and later versions.
You adapt to your brand in minutes.
You use it in paid client work.
You get a refund if the file fails to open.
Three Situations Where This Pays Off
Trainers in corporate education replace data for course overviews.
They reuse the same file across three client reports by swapping color schemes.
Marketing teams in beauty industry visualize product cycles and cut preparation from two hours to thirty minutes.
Educators combine this floral charts template with pyramids from our Pyramids category when delivering academic lectures.
This template differs from its three closest related templates.
Benchmarking stays competitive while Folium stays leaf shaped and Trefoil stays triple focused.
Here petal motifs add elegant data beauty instead.
One specific visual characteristic is the blooming animation on cycle diagrams.
It works best for training sessions and client proposals.
Data driven beauty allows faster engagement than abstract object neighbors.
The paid version includes eight slides with petal motifs and blooming effects.
No free version limitations appear on page.
Download the Floral Keynote Charts Template now and add elegance to your data.
Compared to Starting From Zero
Manual cycle creation takes forty minutes per slide.
Petal shapes misalign without guides.
Animations require separate keyframing.
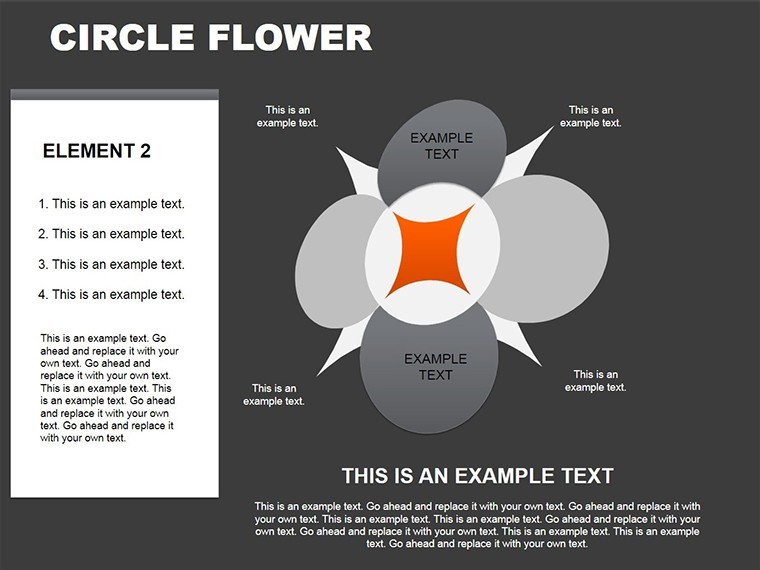
This layout keeps labels outside shapes for screen clarity.
Color contrast divides phases cleanly.
Information spacing balances petal layers perfectly.
Many sales presentations rely on these exact diagram structure choices.
Download the Floral Keynote Charts Template now and add elegance to your data.
Which Keynote versions does this work with?
Keynote 12 and newer versions open the .key file without issues. Older releases may lose some layer effects. Apple Silicon Macs run it fastest. Test the file immediately after download to confirm full compatibility.
How do I change the color scheme?
Select any shape or segment. Open the Format panel on the right. Choose Fill then pick your brand color. Repeat for all segments in one diagram. Keynote slide master updates propagate across all slides automatically.
What does the license allow?
You may use the template in paid client work. You cannot resell or sublicense the file itself. Internal company use stays unlimited. Attribution is never required.
What does the paid version include that the free version does not?
The paid version includes eight slides with petal motifs and blooming effects. No free version limitations appear on page. You receive the full .key file ready for immediate editing. Every diagram connector and text placeholder stays editable.
What software do I need?
Apple Keynote on Mac or iPad opens the .key file. Windows users require Keynote for iCloud. No additional plugins appear necessary. Export to PDF works from any compatible device.
What is the refund policy?
You receive a full refund within thirty days if the file does not open in your Keynote version. Contact support with your order number. The policy covers download issues only. No questions are asked beyond verification.