Graphs Keynote Template - Instant Download | ImagineLayout


Package Contents
22 slides.
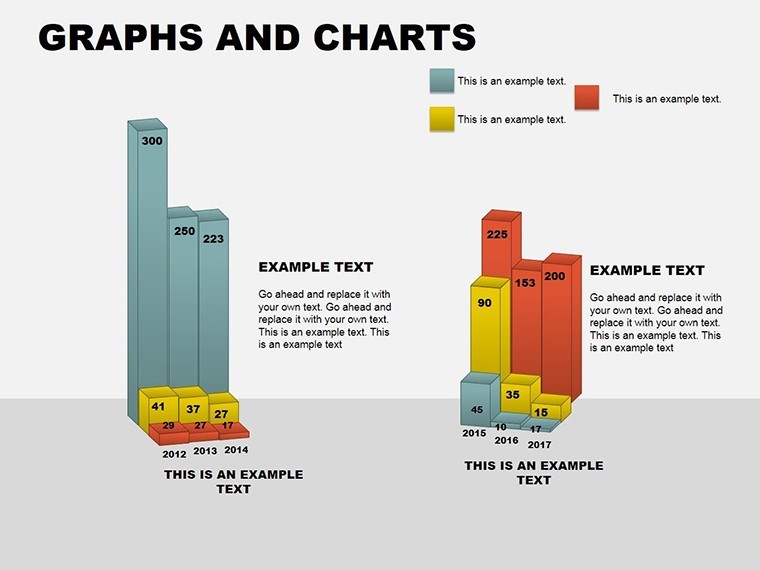
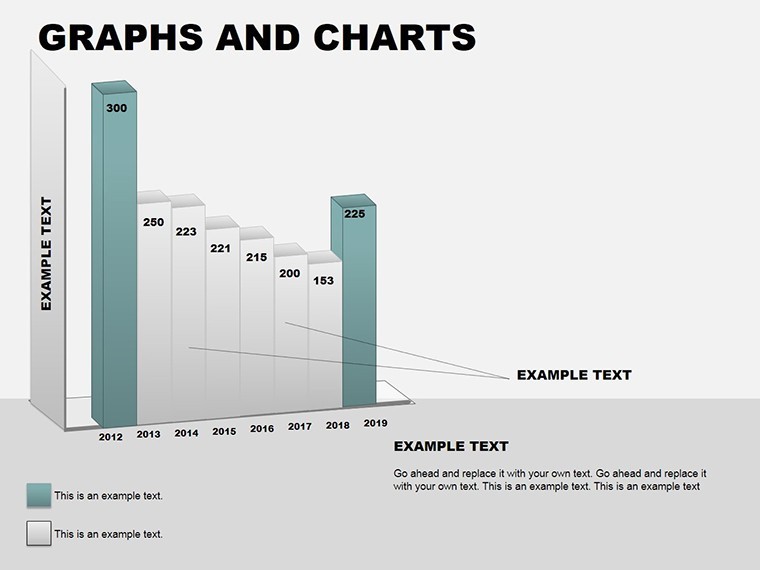
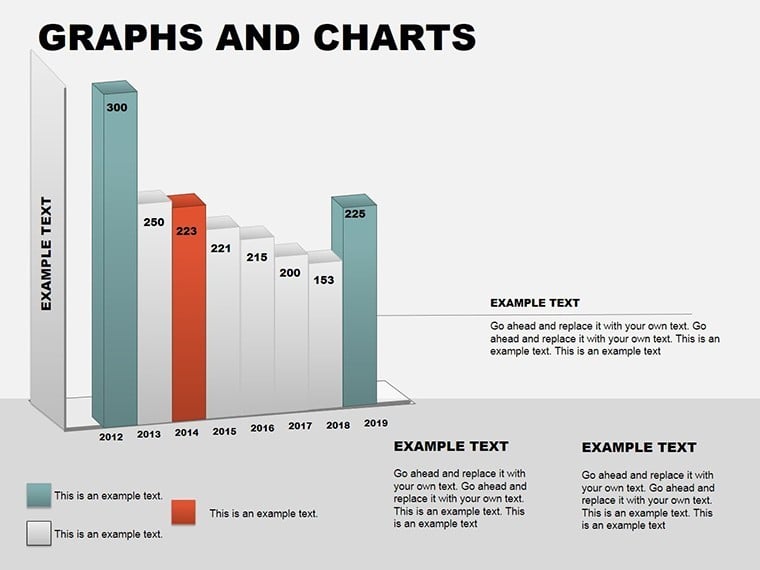
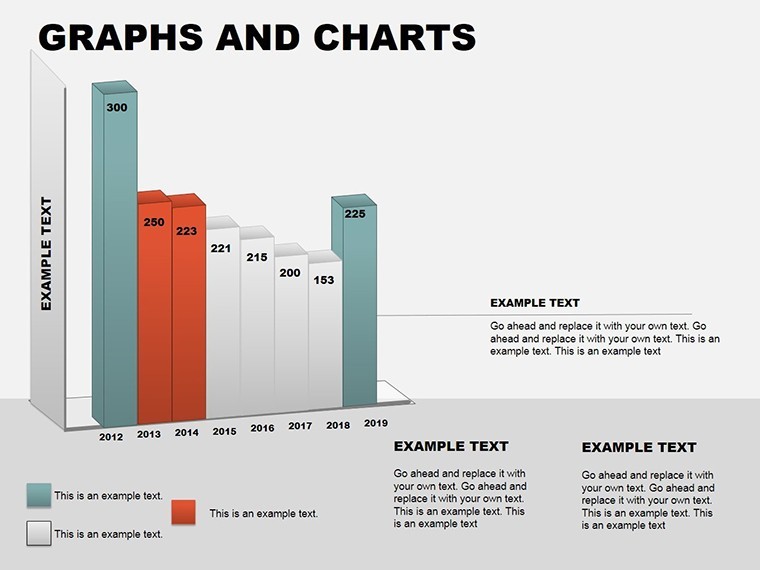
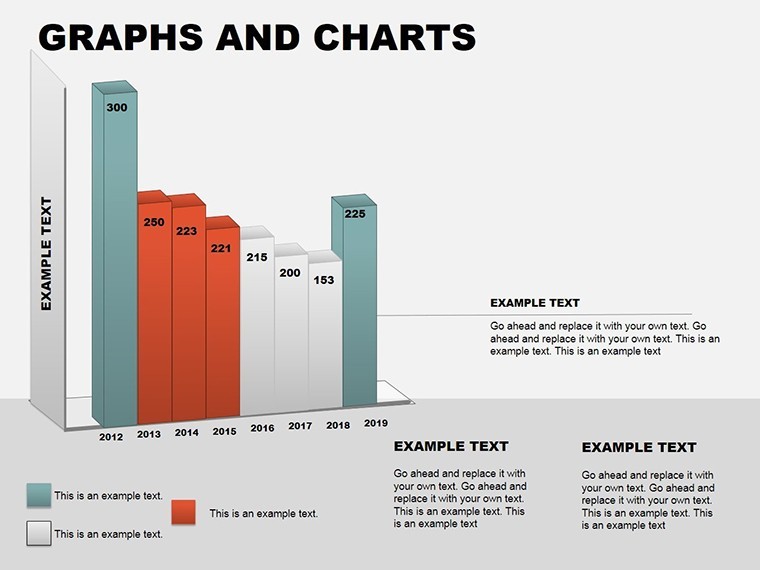
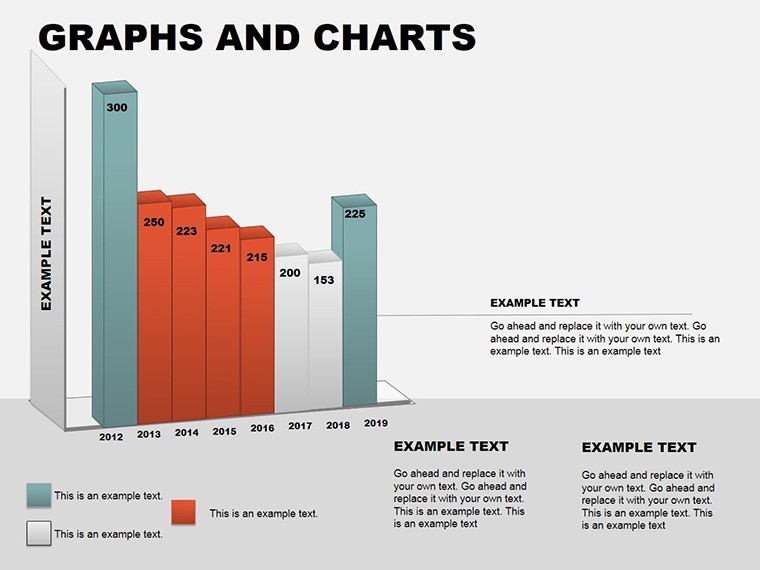
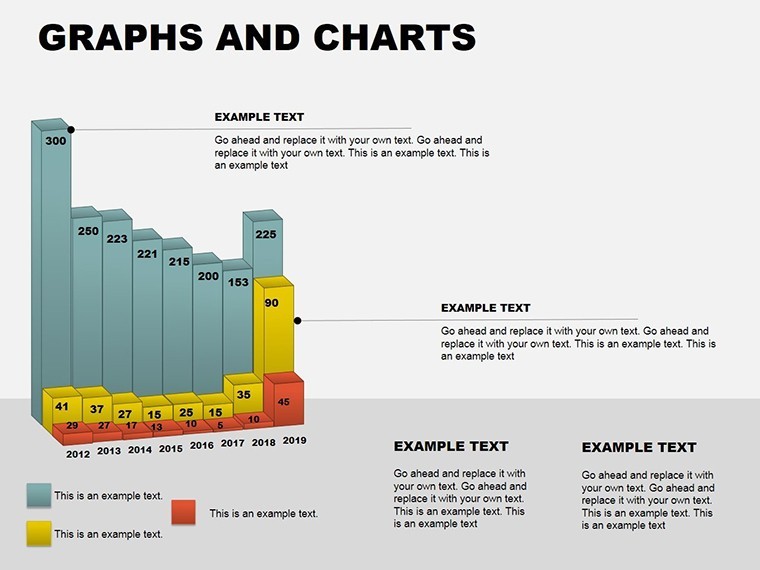
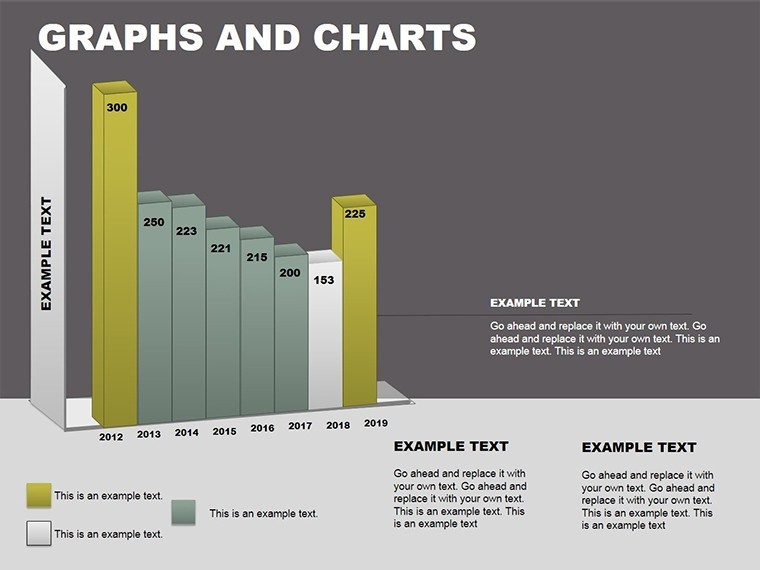
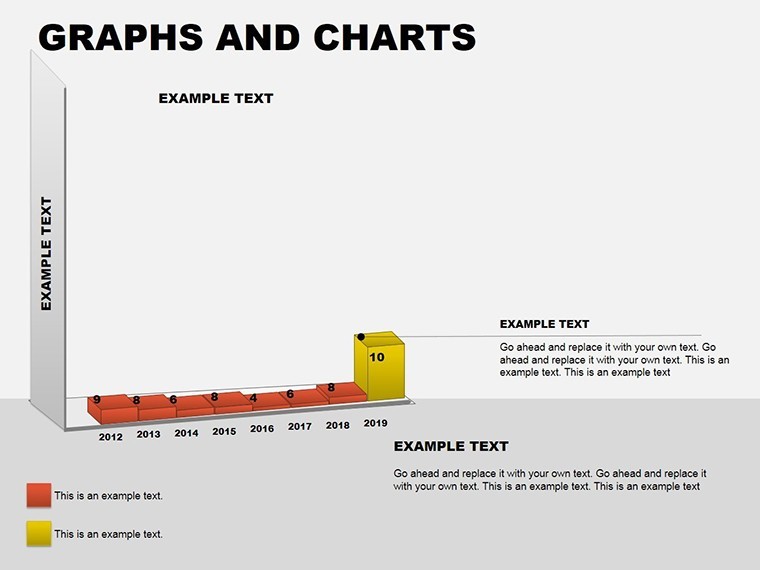
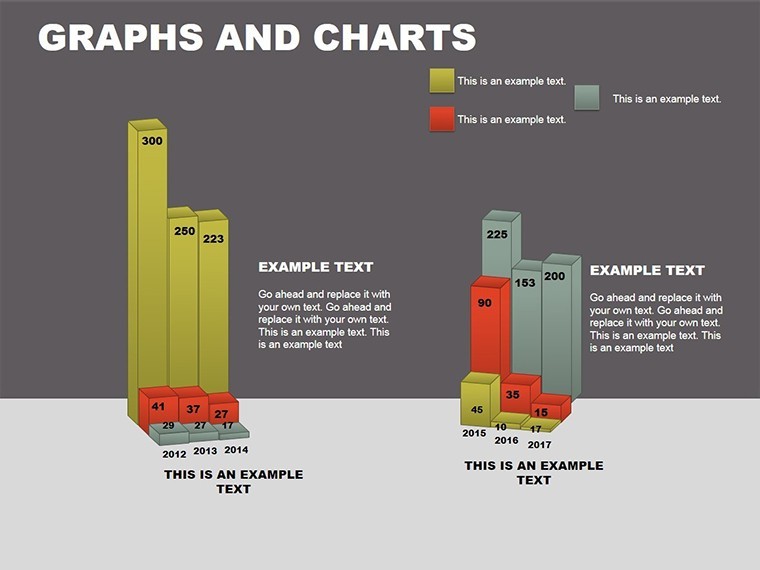
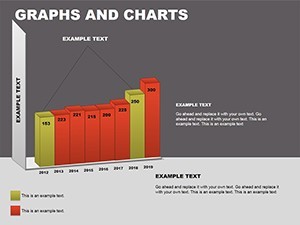
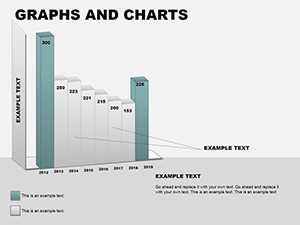
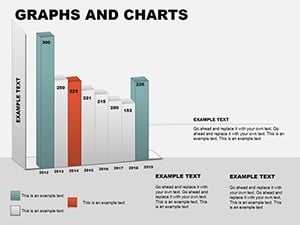
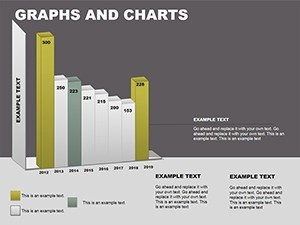
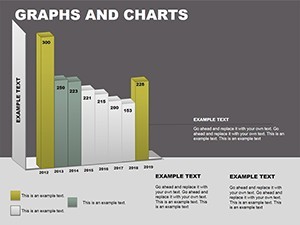
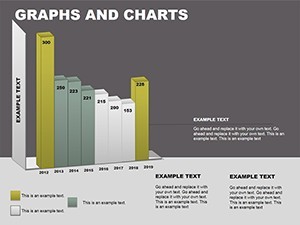
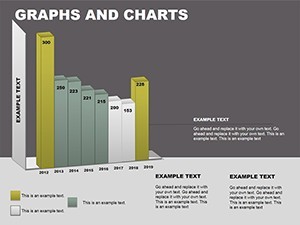
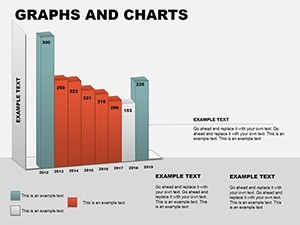
3D graphs bars lines and area charts fill every slide.
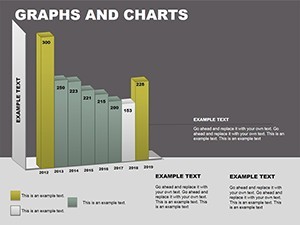
Ten color schemes come built in.
One .key file covers all.
Business and education focused layouts support strategy meetings.
Key Specifications
| Feature | Details |
|---|---|
| Slides included | twenty two infographic slides |
| Diagram categories | bars lines areas 3D plots |
| Editable elements | text placeholders icon layers color theme adjustments |
| Aspect ratio | 16:9 4:3 16:10 |
| PowerPoint compatibility | Keynote native no conversion needed |
| Animation support | add your own in Keynote |
Format compatibility stays seamless.
Diagram connectors adjust without breaking layout.
From Download to Final Deck
- Step 1 - Open .key file takes one minute.
- Step 2 - Update data values takes five minutes.
- Step 3 - Swap color themes takes two minutes.
- Step 4 - Add your logo takes one minute.
Total time stays under ten minutes.
Editing difficulty sits at moderate level.
You change colors without a designer.
It opens in Keynote 12 and later versions.
You adapt to your brand in minutes.
You use it in paid client work.
You get a refund if the file fails to open.
Typical Use Cases by Role
Financial analysts in banking replace placeholder numbers with quarterly results.
They reuse the same file across three client reports by swapping color schemes.
Educators in universities graph exam trends and cut preparation time in half.
Project managers combine this graphs template with timelines from our Timelines category when presenting progress in board meetings.
This template differs from its three closest related templates.
Economic Analysis focuses on financial futures while Important Indicators stay metric specific and Forecasting stays predictive.
Here general 3D graphs support any persuasive pitch.
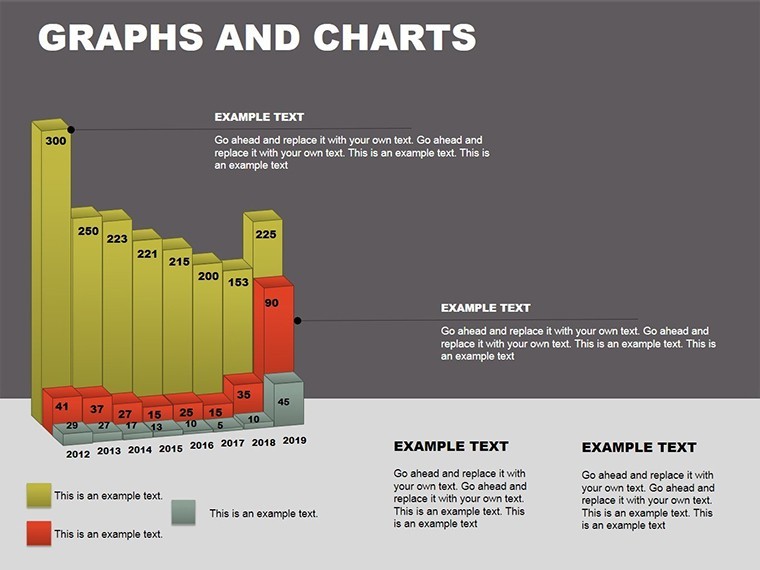
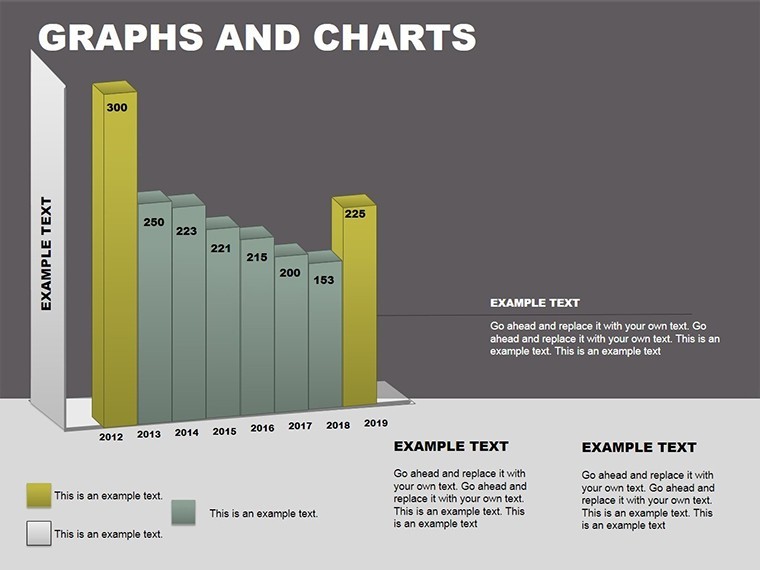
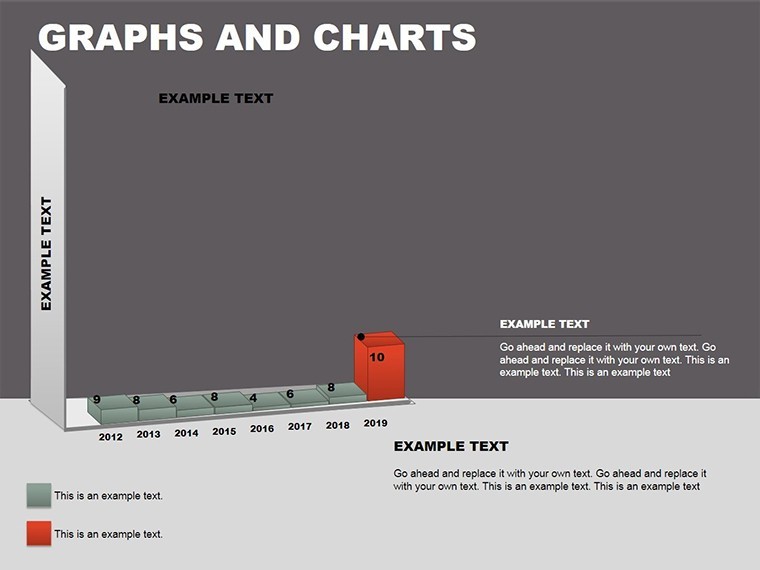
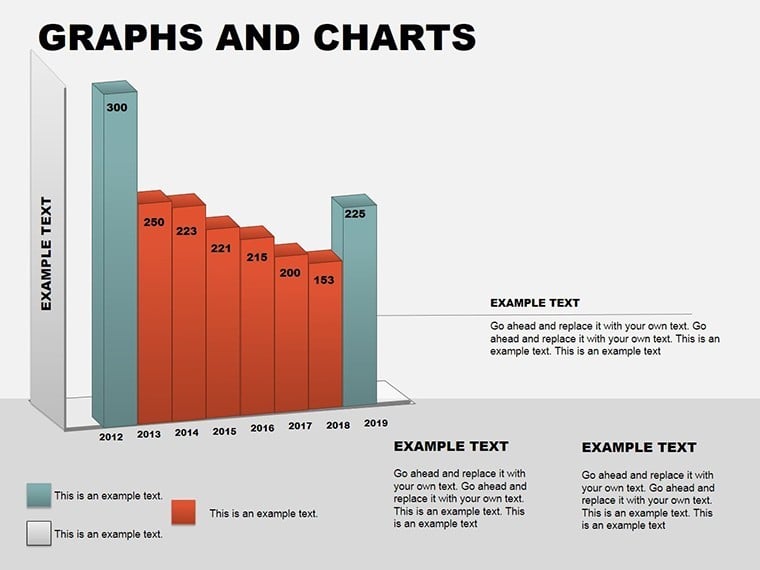
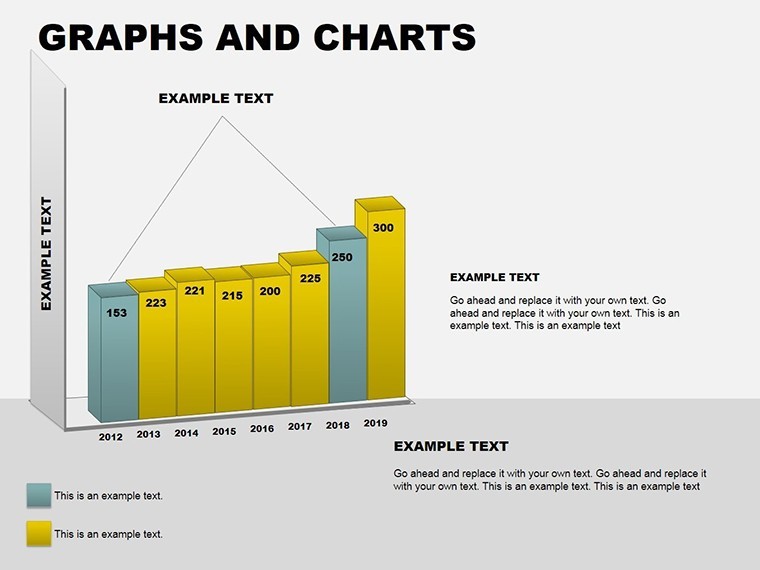
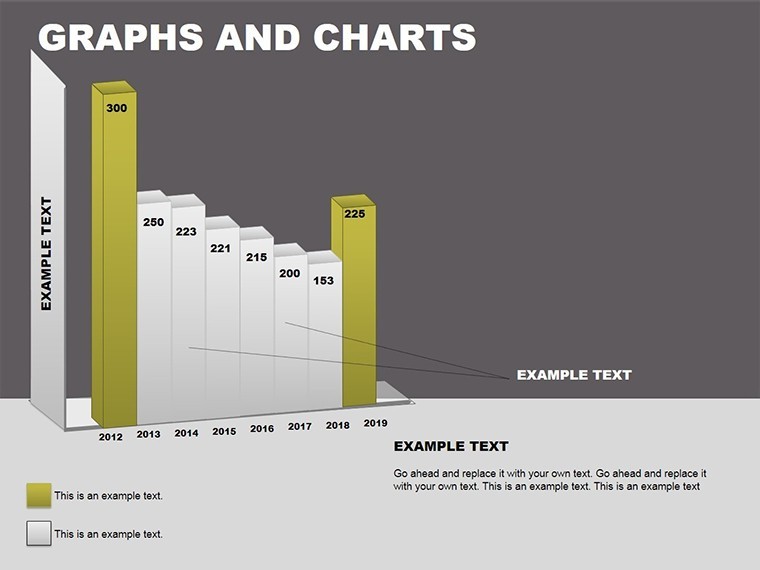
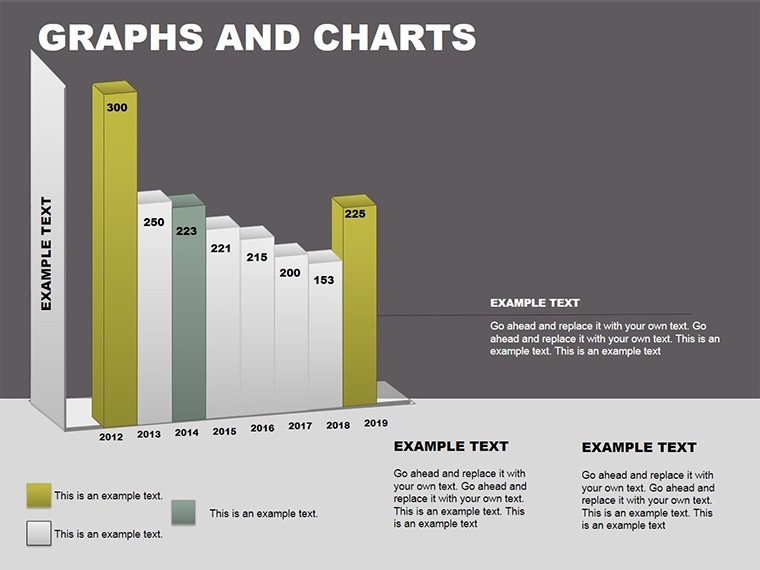
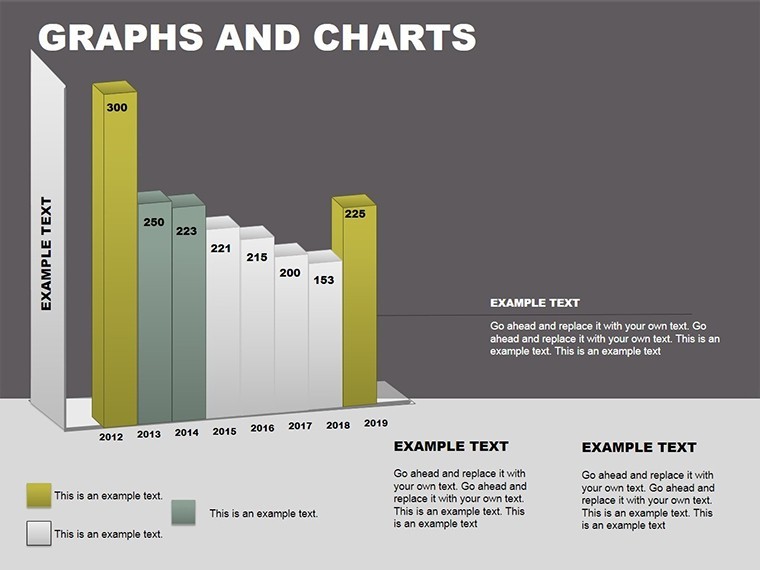
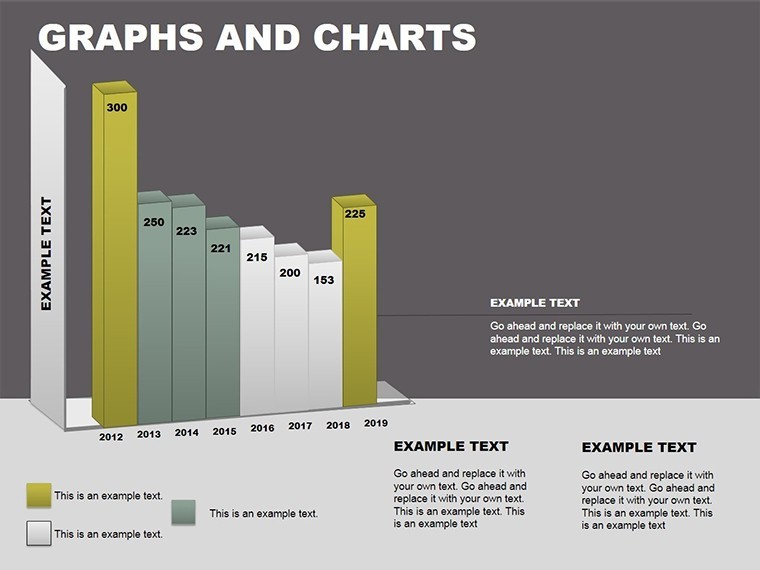
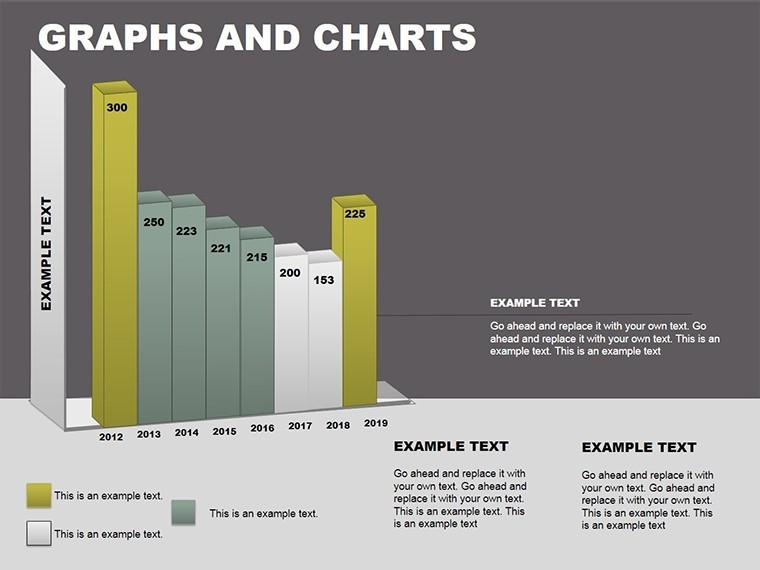
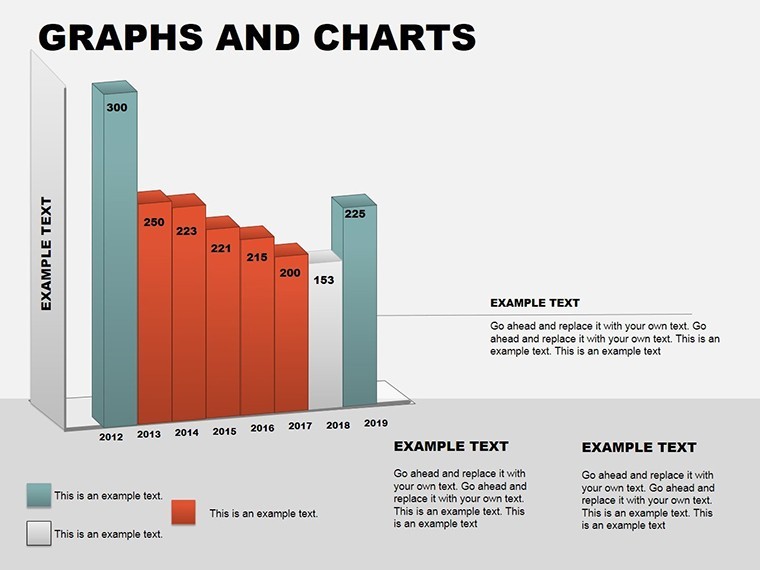
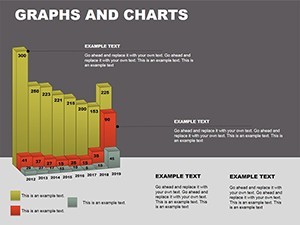
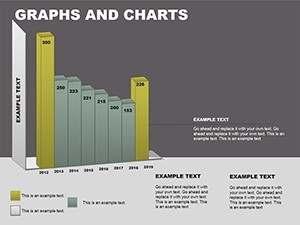
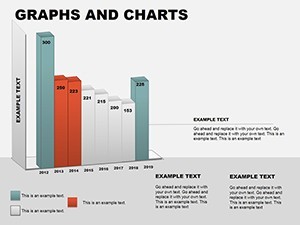
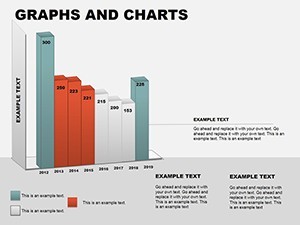
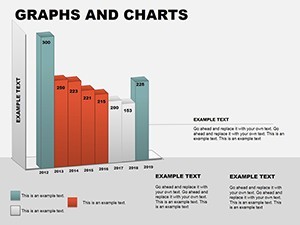
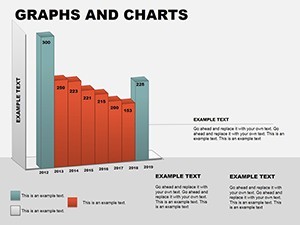
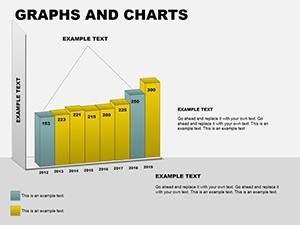
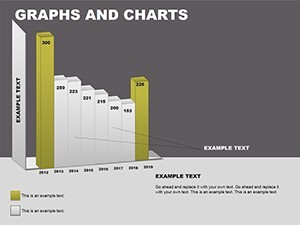
One specific visual characteristic is the bold bar clusters with depth shading.
It works best for investor decks and internal reporting.
Data deluge handling turns numbers into clear narratives faster than niche economic neighbors.
The paid version includes ten color schemes and twenty two slides.
No free version limitations appear on page.
Download the Graphs Keynote Template now and turn your data into stories.
Building From Scratch vs. Starting Here
Manual graph creation takes over an hour per slide.
You risk misalignment when adjusting flow direction manually.
3D effects become inconsistent without templates.
This layout uses zone segmentation to separate data layers visually.
Information spacing stays balanced on every screen size.
Layout composition guides the eye left to right naturally.
Many strategy meetings rely on these exact diagram structure choices.
Download the Graphs Keynote Template now and turn your data into stories.
Which Keynote versions does this work with?
Keynote 12 and newer versions open the .key file without issues. Older releases may lose some layer effects. Apple Silicon Macs run it fastest. Test the file immediately after download to confirm full compatibility.
How do I change the color scheme?
Select any shape or segment. Open the Format panel on the right. Choose Fill then pick your brand color. Repeat for all segments in one diagram. Keynote slide master updates propagate across all slides automatically.
What does the license allow?
You may use the template in paid client work. You cannot resell or sublicense the file itself. Internal company use stays unlimited. Attribution is never required.
What does the paid version include that the free version does not?
The paid version includes ten color schemes and twenty two slides. No free version limitations appear on page. You receive the full .key file ready for immediate editing. Every diagram connector and text placeholder stays editable.
What software do I need?
Apple Keynote on Mac or iPad opens the .key file. Windows users require Keynote for iCloud. No additional plugins appear necessary. Export to PDF works from any compatible device.
What is the refund policy?
You receive a full refund within thirty days if the file does not open in your Keynote version. Contact support with your order number. The policy covers download issues only. No questions are asked beyond verification.