16 Promotion Market Infographics Keynote - Editable KEY | ImagineLayout


Type: Keynote Charts template
Category: Pie
Sources Available: .key
Product ID: KC00076
Template incl.: 16 editable slides
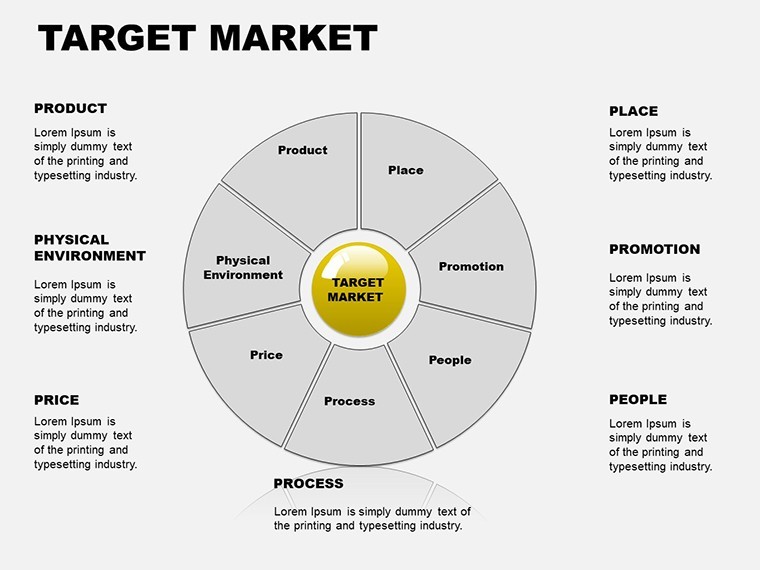
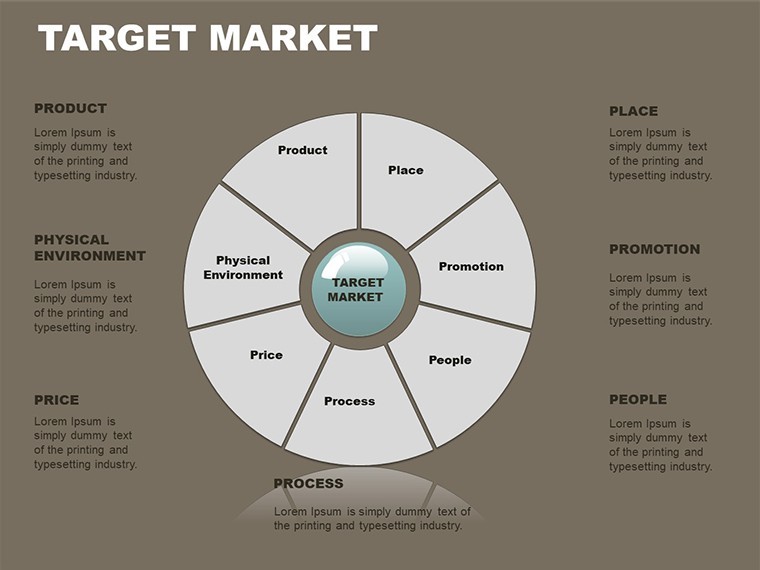
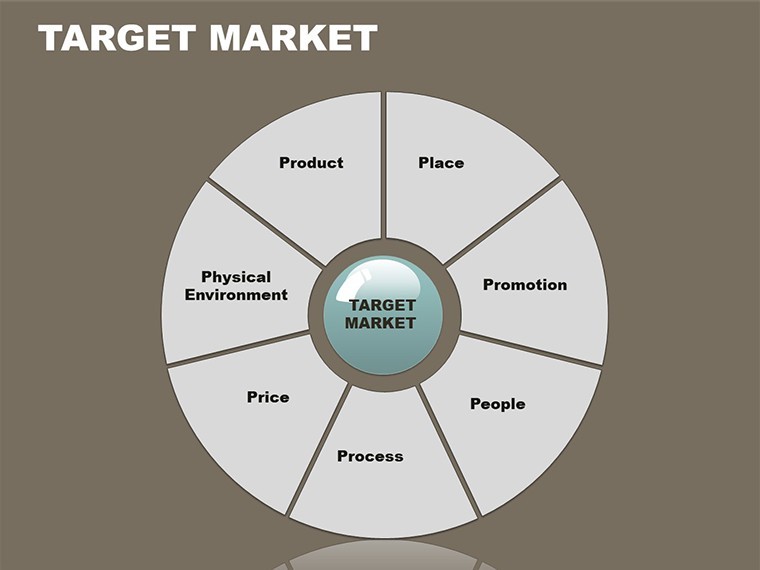
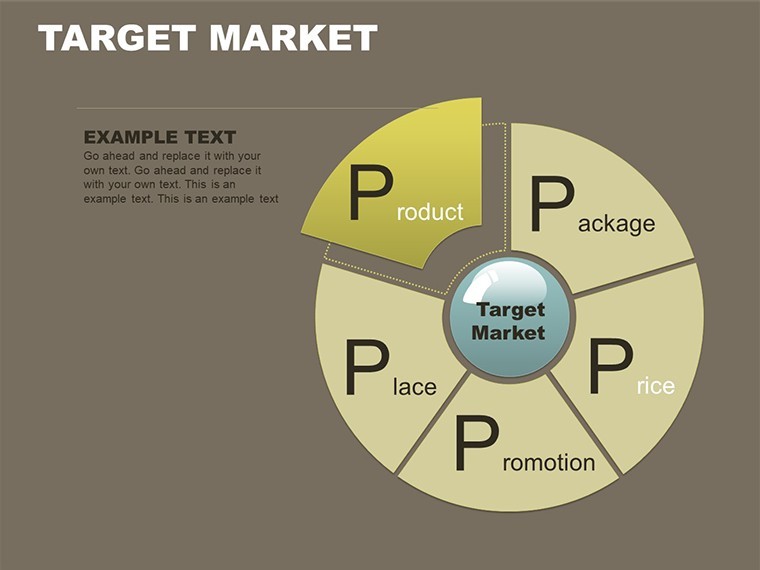
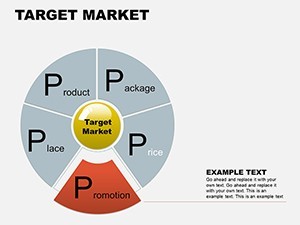
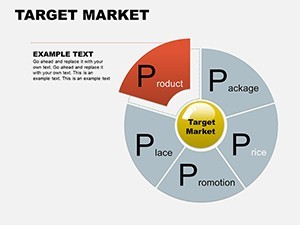
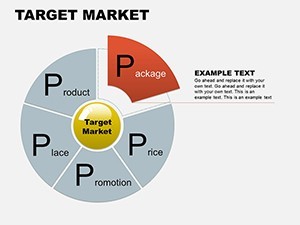
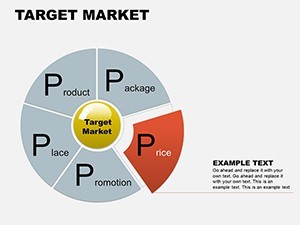
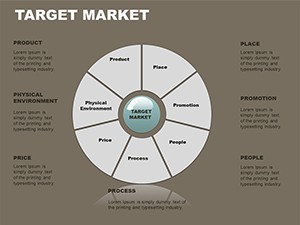
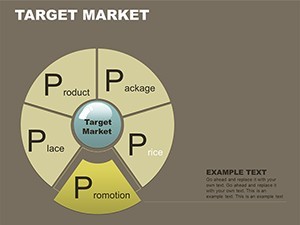
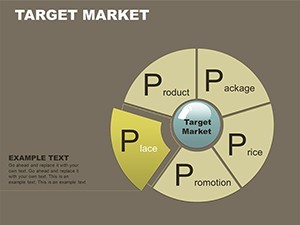
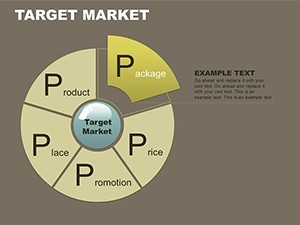
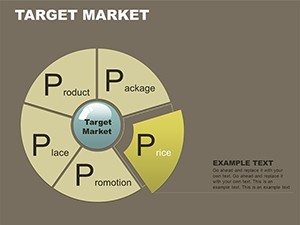
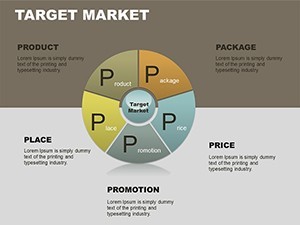
Donut charts with layered infographics fill the 16-slide .key file.
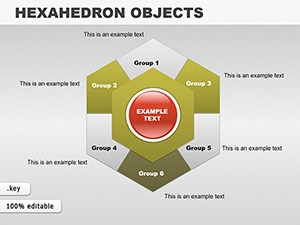
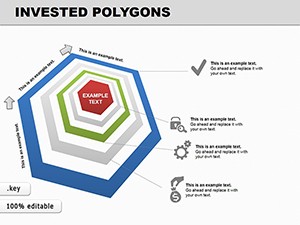
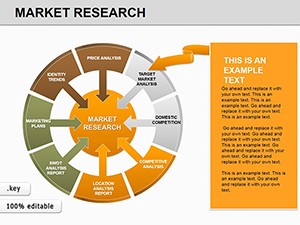
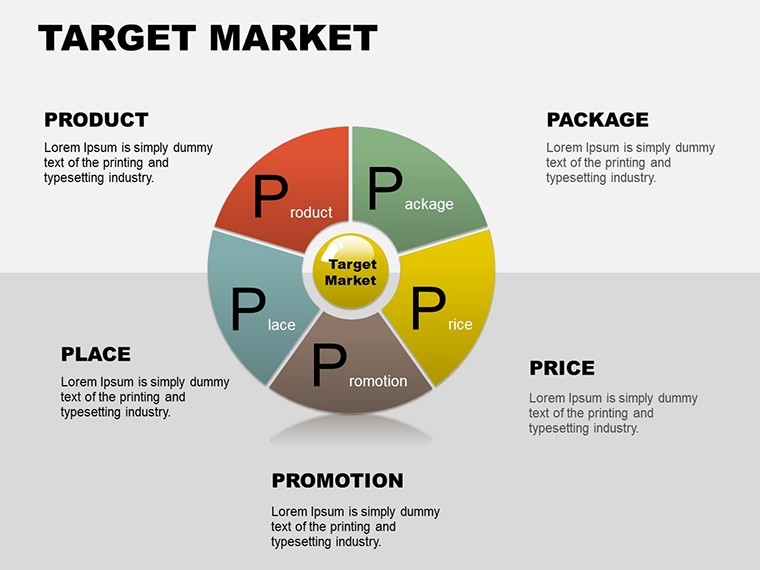
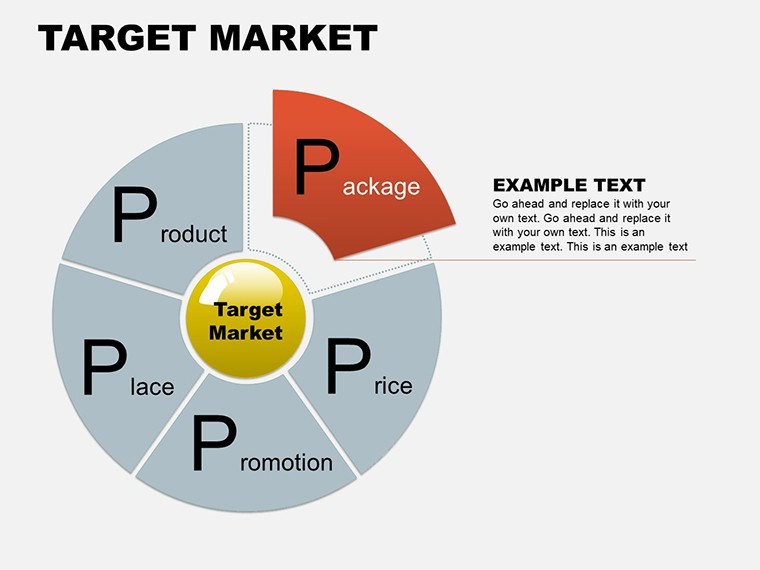
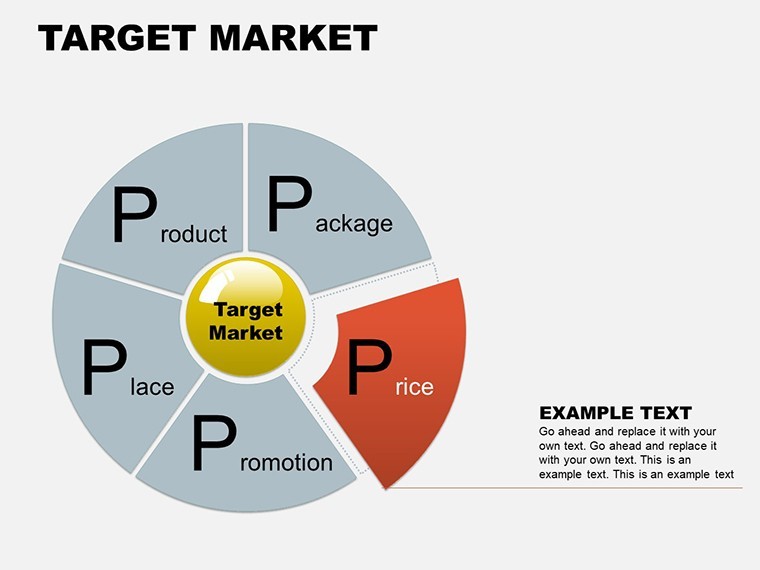
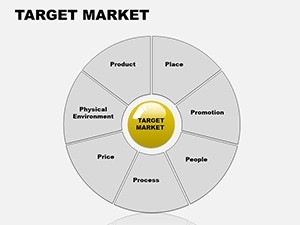
Radial sales radars spread from the center while vertical funnel structures taper downward in promotion market designs.
No setup needed.
In practice the paid version delivers the complete set of sixteen slides and all layered infographics with no free option listed on the page.
For market share breakdowns that need clear part-to-whole views the donut and radial layouts handle the structure out of the box instead of building diagrams manually.
This Keynote chart template supports multi-attribute comparison analysis so the viewer can prioritize campaign channels after seeing the radar plot.
Marketing managers suit this file best when preparing promotion strategy decks.
The layouts keep structure readable on one slide preventing overcrowded designs.
Best used when your data mixes proportions and funnel stages.
Not designed for pure hierarchical org charts where tree structures would fit better.
Not ideal for highly creative storytelling slides that require freeform layouts.
Typically teams reuse the same radial radar across weekly promotion updates.
Use this instead of manual shape arrangement in Keynote to save hours.
A marketing manager in retail visualized market share data in a strategy workshop and reduced slide building from 2.5 hours to 35 minutes.
Specifications
| Feature | Details |
|---|---|
| Slides / diagrams | 16 donut funnel radial sales radars and layered infographics |
| File format | .key |
| Software version | Keynote 12+ (standard for .key files) |
| Color schemes | Vibrant promotion market palettes editable per slide |
| Editable elements | Layers resize independently funnel stages recolor separately |
| Aspect ratio | Not specified on page |
| Free vs Paid | Paid includes complete set of sixteen slides and all layered infographics no free variant |
| Masters / Backgrounds | Prebuilt promotion market designs |
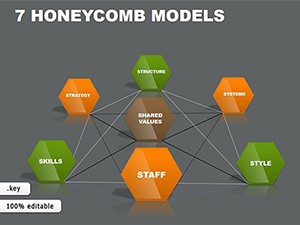
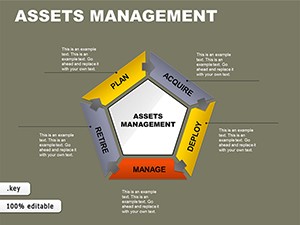
See also the Honeycomb Models Keynote Charts or Asset Management Keynote Charts Template.
Everything is already structured.
Download and start editing immediately
How do I change the color scheme?
Enter slide master mode and modify the theme colors once. Every donut funnel radial and layered slide updates instantly. Promotion market palettes reflect the change without manual rework.
What does the license allow for client work?
Full permission for client presentations and reports. File resale remains forbidden. No sublicensing allowed while unlimited internal projects are fine for marketing teams.
What does the free version include versus the paid version?
No free variant appears for this template. The paid download supplies the complete set of sixteen slides and all layered infographics. Every donut funnel radial sales radar is fully editable only in the purchased package.
What are the refund conditions?
Contact support within 30 days if the file fails to open correctly in Keynote. Standard marketplace policy applies for compatibility issues. Full refund issued once the problem is verified.
Can I apply the template to an existing presentation?
Yes open the .key file first then copy individual slides into your existing deck. The layered infographics paste cleanly without breaking structure. Adjust colors via slide master after import.