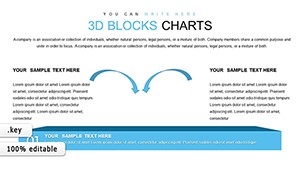
3D Blocks Keynote Charts: Elevate Data Visualization in 3D


Step into the future of architectural presentations where data leaps off the slide in stunning 3D. Our 3D Blocks Keynote Charts Presentation Template, with 16 editable slides, is crafted for architects who demand more than flat graphs to showcase project metrics, from budget allocations to material volumes. At $18, this cube-themed powerhouse turns bar charts into towering structures, line graphs into dynamic pathways, and pie charts into segmented orbs, all fully customizable in Keynote for Mac or PC. Align with AIA's emphasis on innovative communication by using these charts to visualize building performance data, making your pitches to clients or juries not just informative, but immersive experiences that stand out in competitive fields.
Harnessing 3D for Architectural Insights
3D visualization isn't a gimmick - it's a game-changer for conveying spatial relationships in architecture. This template's block designs mimic real-world building blocks, allowing you to represent data like floor area ratios or energy consumption in a tangible way. Consider a San Francisco firm that used 3D charts to depict seismic retrofit data; the visual depth helped stakeholders appreciate the layered complexities, leading to quicker funding approvals.
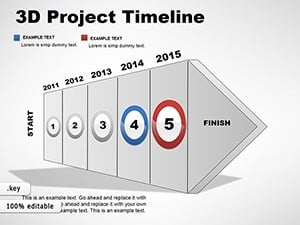
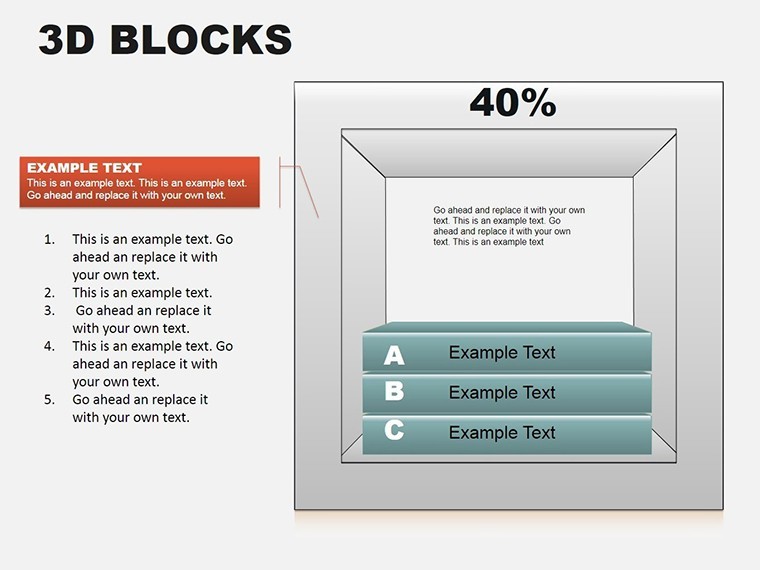
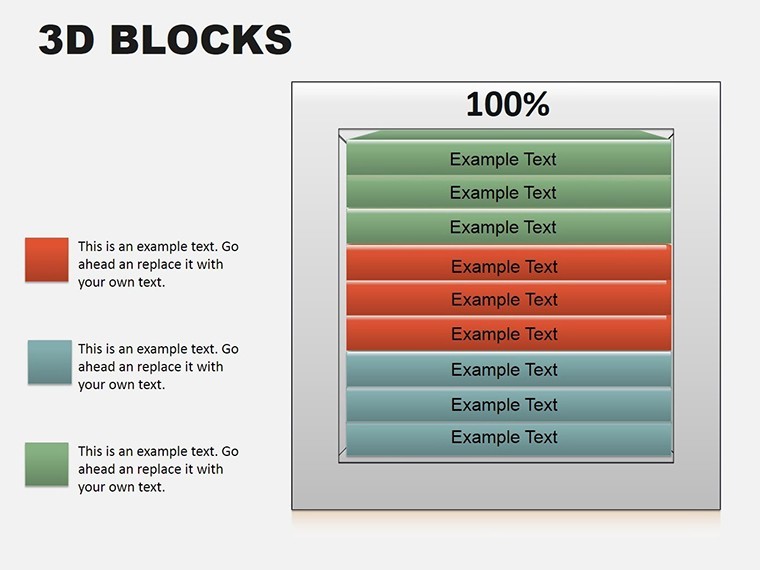
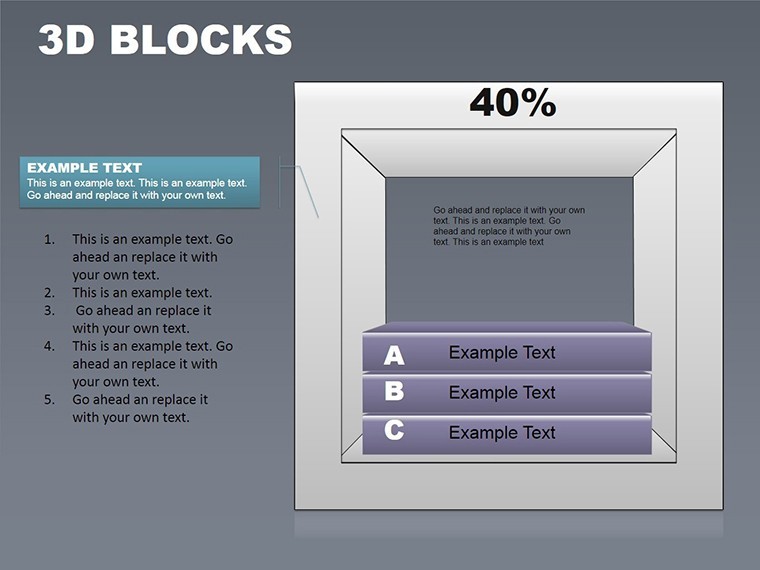
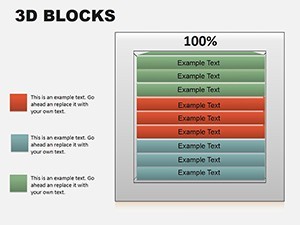
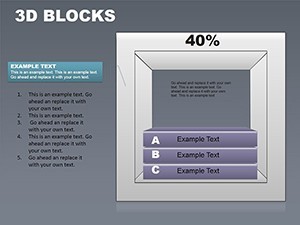
Bar charts in 3D add height and shadow for emphasis, ideal for comparing construction phases. Line graphs curve through space, tracking timeline progress with a sense of motion that static lines lack.
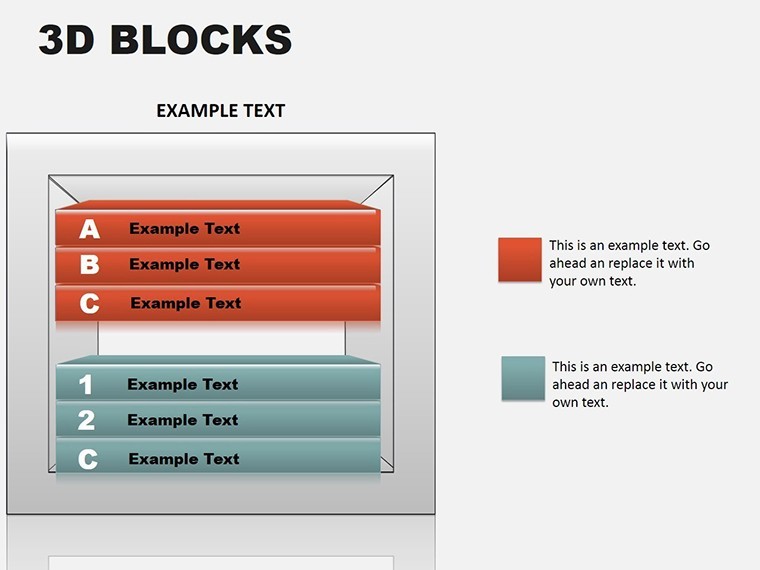
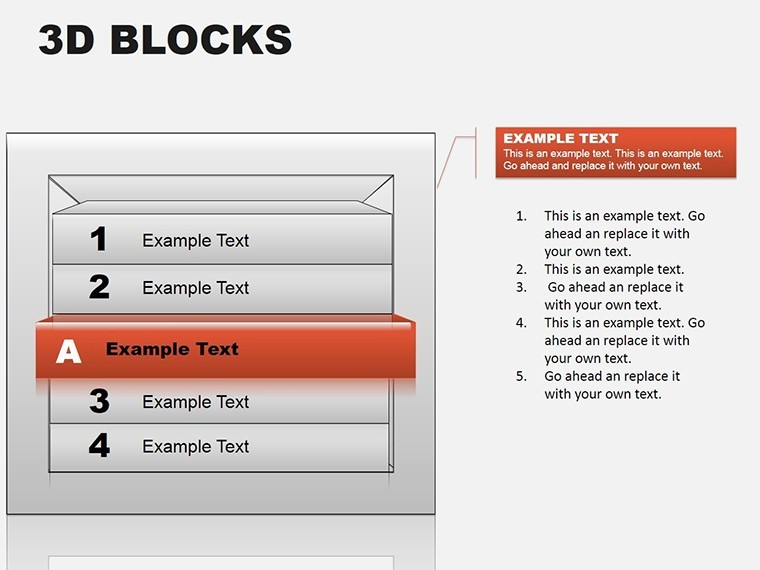
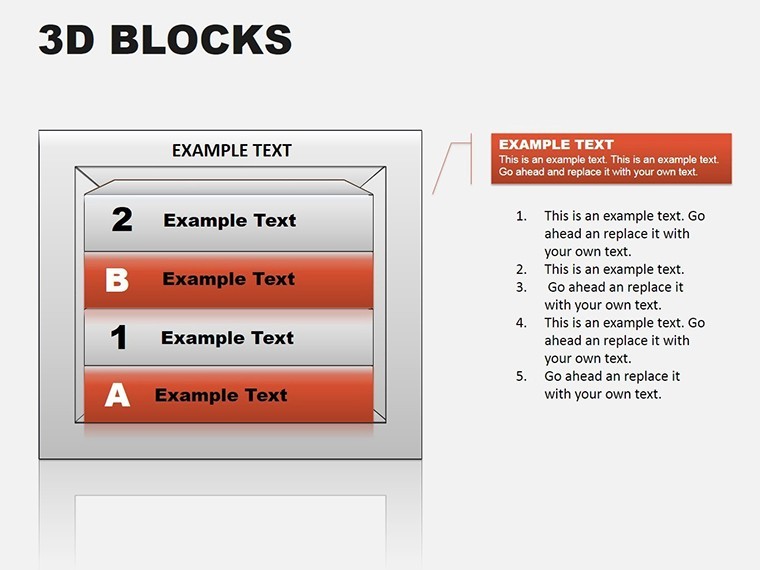
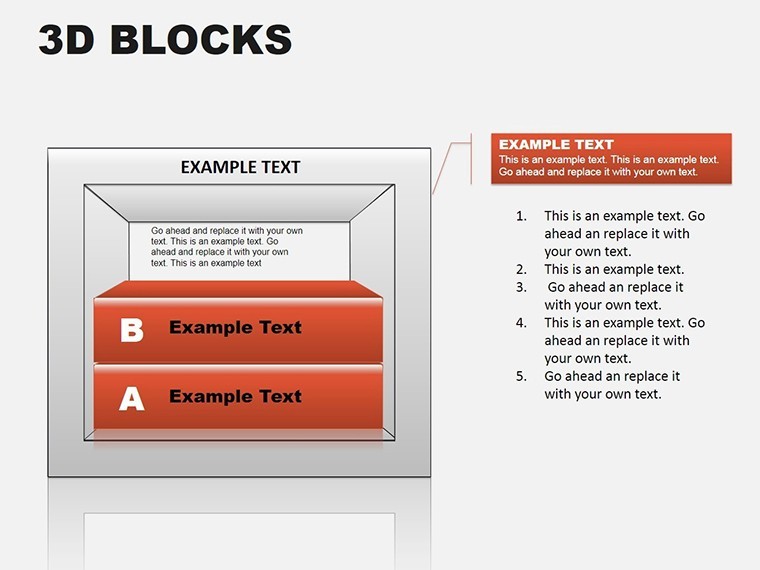
Essential Features for Dynamic Presentations
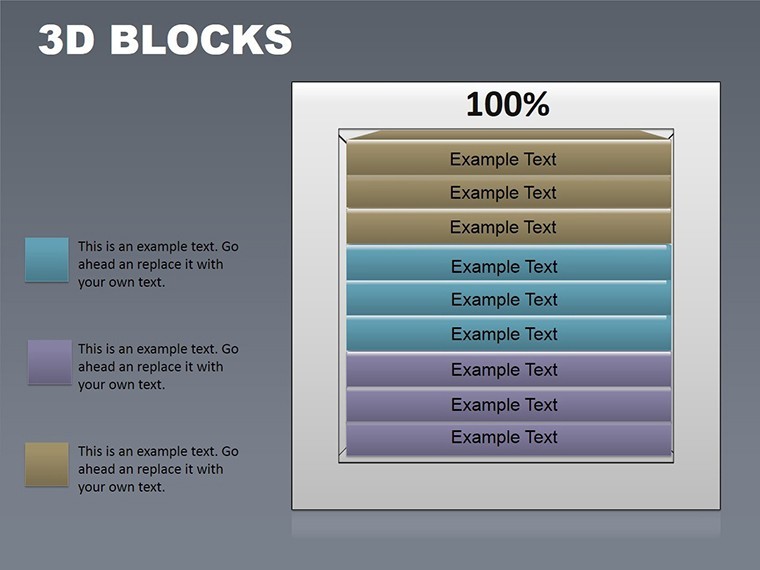
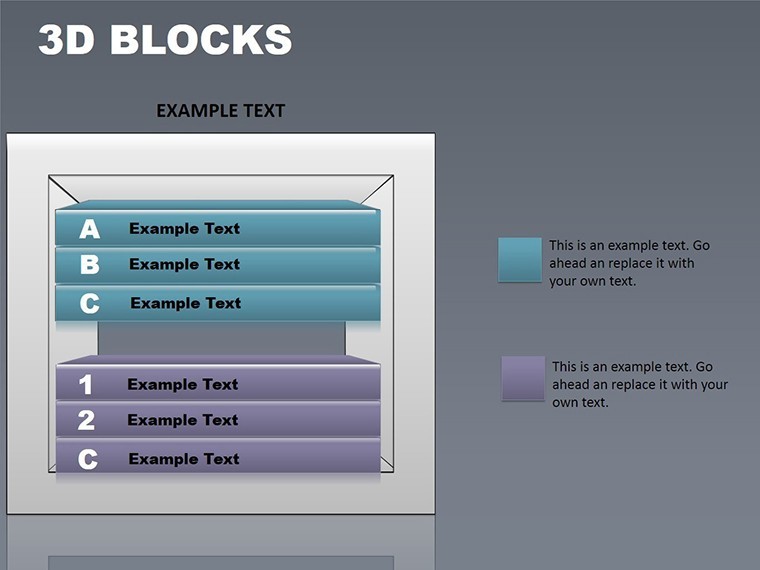
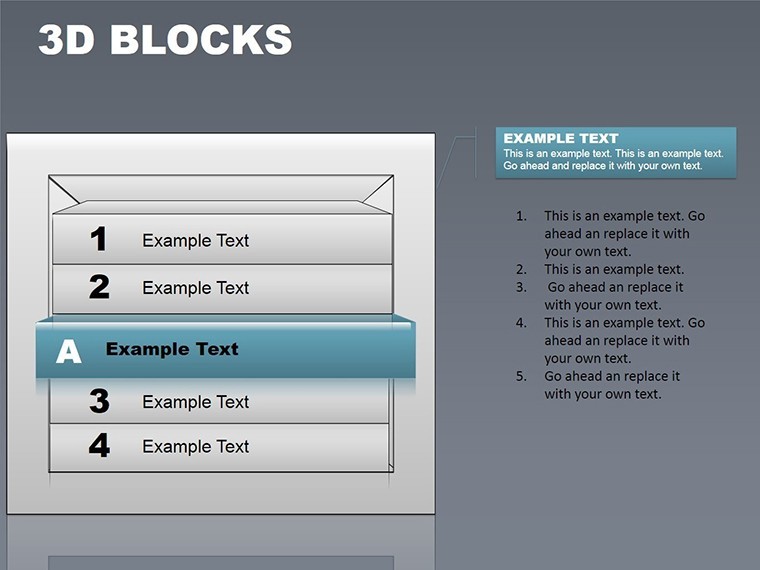
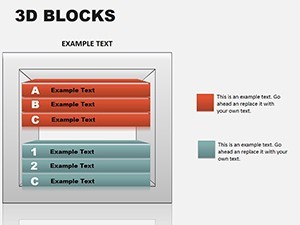
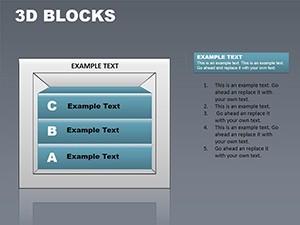
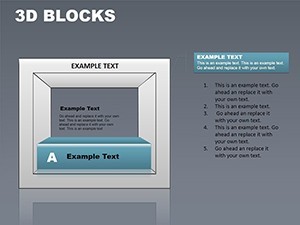
- Customizable Charts: Edit data points, colors, and perspectives to align with project themes, such as earthy tones for eco-builds.
- Cross-Platform Compatibility: Seamless on Mac and PC, ensuring team collaboration without compatibility woes.
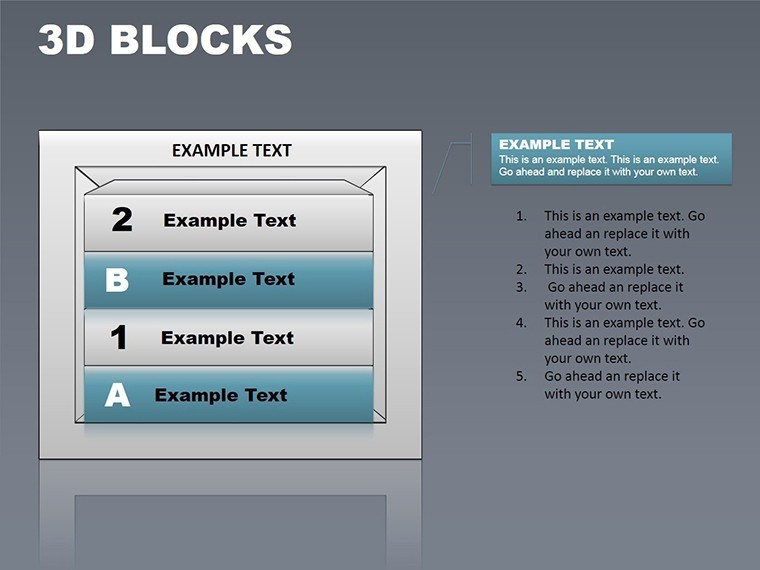
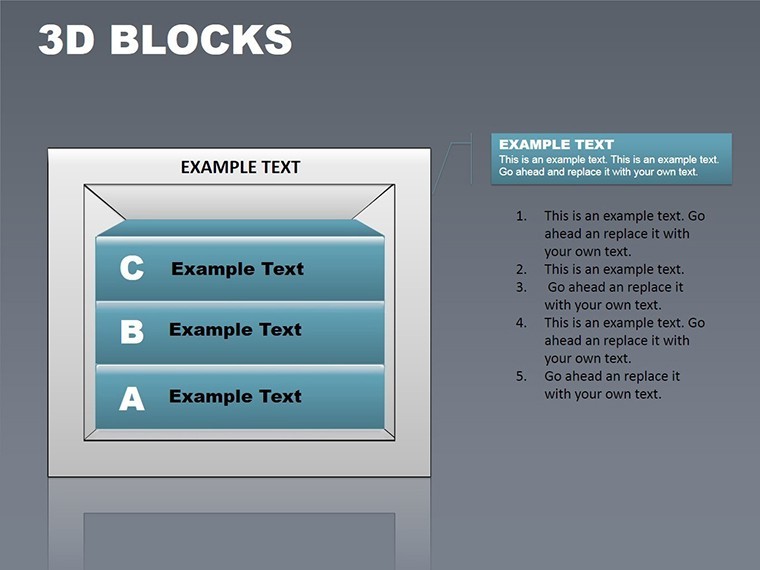
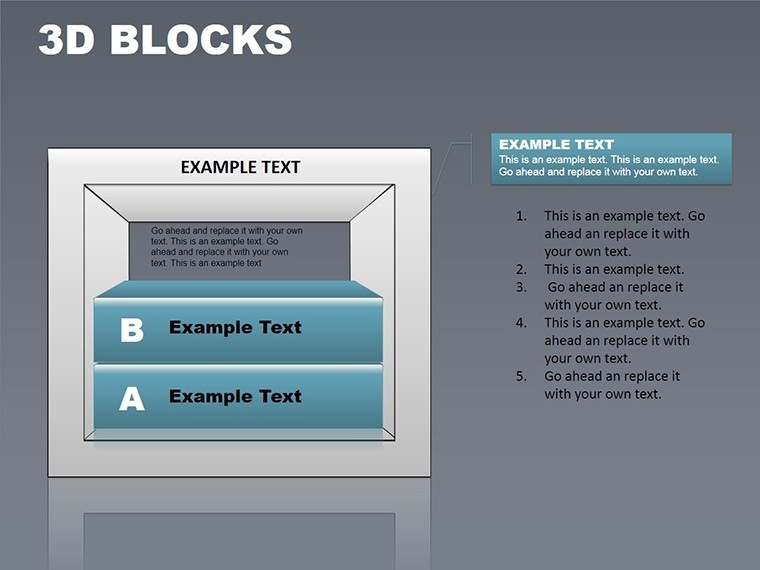
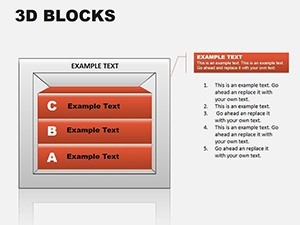
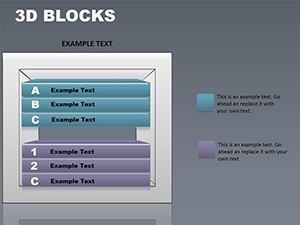
- Engaging Visuals: Cube elements add depth, making abstract data feel concrete and relatable.
- Easy Modifications: Drag-and-drop interfaces for quick updates during iterative design reviews.
The advantages shine in retention: Audiences remember 3D visuals better, per design psychology research, giving your proposals an edge over 2D competitors. This template's SEO-optimized structure also aids in digital sharing, boosting your firm's online presence.
Practical Use Cases: Bringing Data to Life
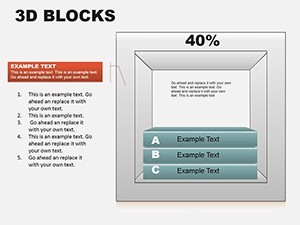
Start with slide three: A 3D bar chart for budget breakdowns. Input categories like materials and labor; watch blocks rise proportionally, adding labels for cost savings from green tech.
Slide nine: 3D pie chart for resource allocation in a LEED-certified project. Segments pop out, highlighting sustainable materials' share, with tooltips for detailed specs.
For line graphs on slide fourteen, plot project milestones against time, using 3D paths to show accelerations in construction tech adoption. Tips: Rotate views for emphasis; pair with animations to simulate growth. Integrate with BIM software exports for accurate data feeds.
Workflow Enhancement Strategies
Embed these charts in broader decks for comprehensive reports, or standalone for quick updates. A case from a London architecture studio shows how 3D data viz streamlined client feedback loops, reducing revisions. Its flexibility supports creative uses, like modeling urban density in proposal visuals.
Ensure accessibility with high-contrast options, building trust in your professional deliverables.
Grab Your 3D Advantage Now
Revolutionize how you present architectural data. Buy this 3D Blocks Keynote Charts Template for $18 and build presentations that resonate deeply.
FAQ
How do I customize the 3D angles?
Use Keynote's rotation tools to adjust perspectives for optimal viewing.
Are the charts data-driven?
Yes, input your numbers and watch the 3D elements update automatically.
Compatible with iPad Keynote?
Absolutely, for on-the-go edits during site visits.
Can I add textures to blocks?
Yes, apply images like brick patterns for architectural relevance.
What if data changes mid-presentation?
Edit in real-time without restarting, keeping sessions fluid.