Flower Keynote Charts: Bloom Your Data


Type: Keynote Charts template
Category: Relationship, Tables, Illustrations, Spheres
Sources Available: .key
Product ID: KC00048
Template incl.: 11 editable slides
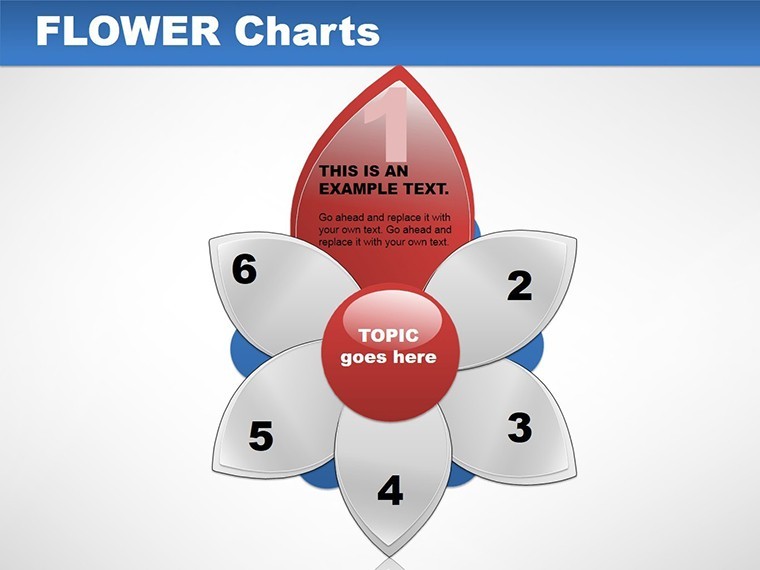
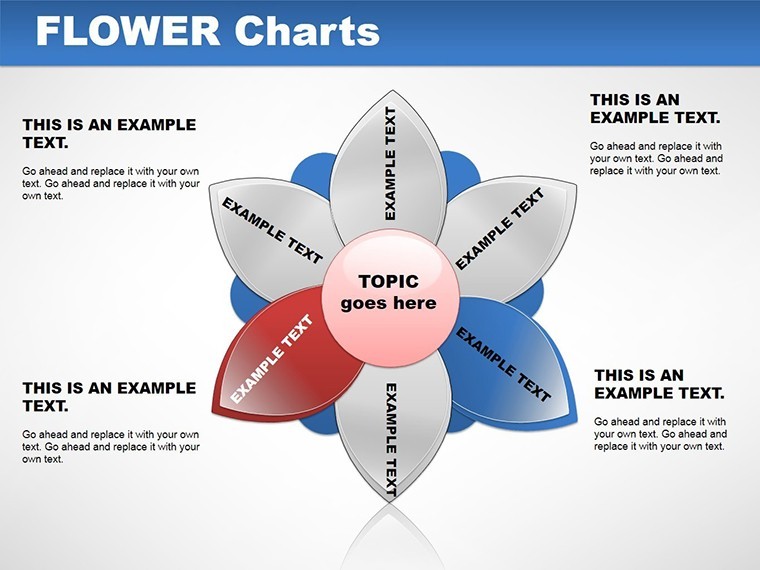
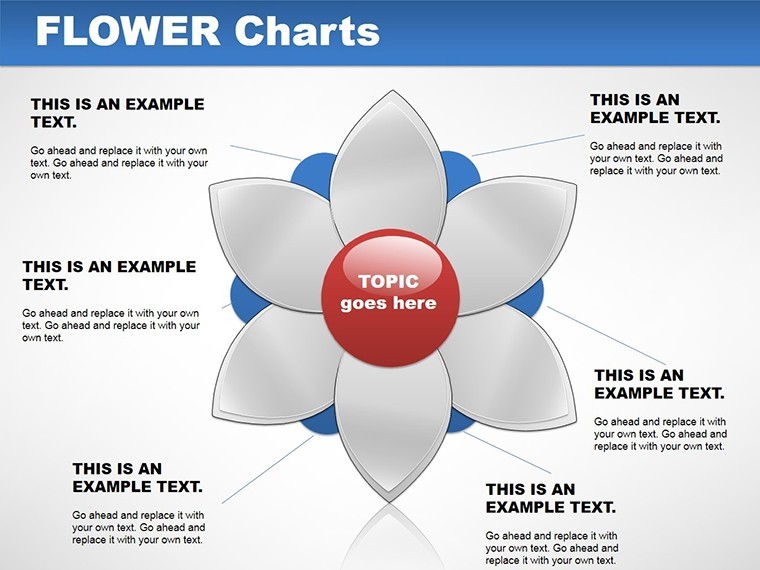
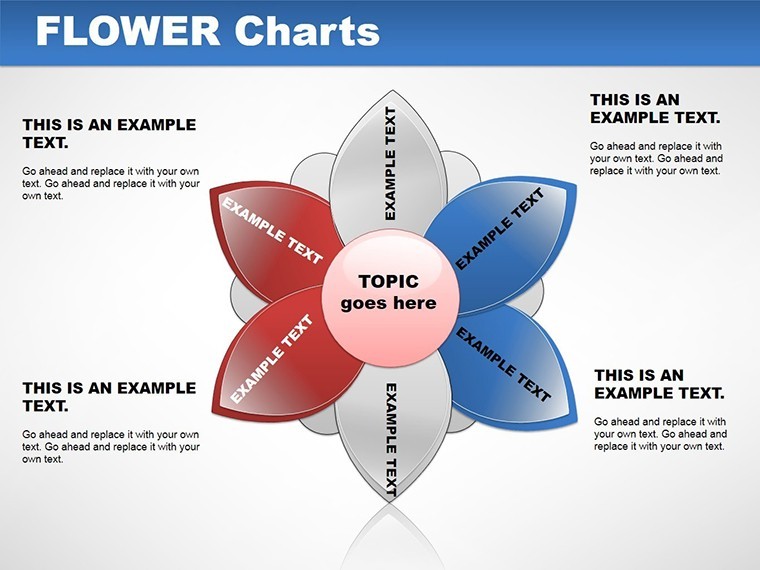
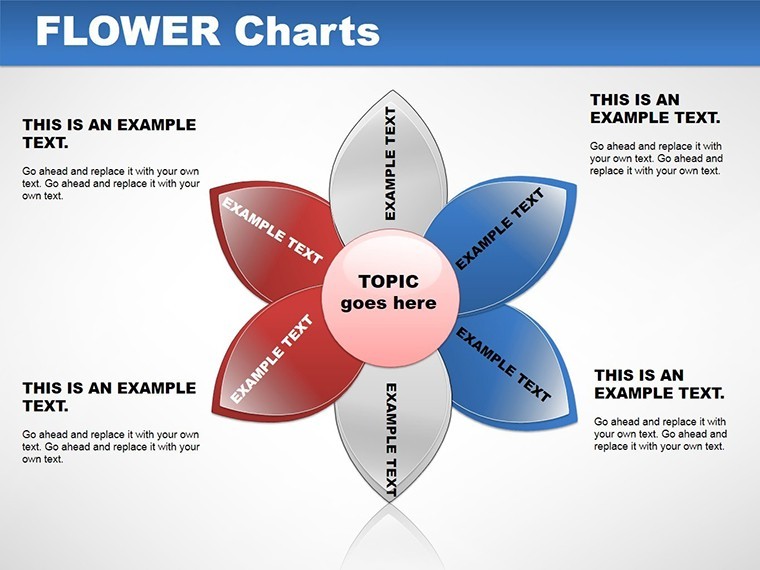
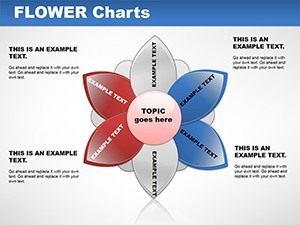
Let your presentations blossom with the Flower Keynote Charts Template, where nature meets data in 11 editable slides of elegant infographics. Designed for those who infuse creativity into their work, this template turns bar graphs into petal-adorned wonders and pies into blooming masterpieces. Whether you're a marketer crafting campaigns or an educator sparking curiosity, customize data, colors, and fonts to let your message unfold like a flower in spring. It's a fresh take on visuals, inspired by biomimicry in design, helping you engage audiences with organic flair that stands out from sterile charts.
Capturing Nature's Elegance in Charts
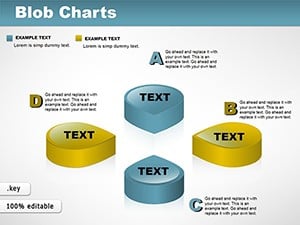
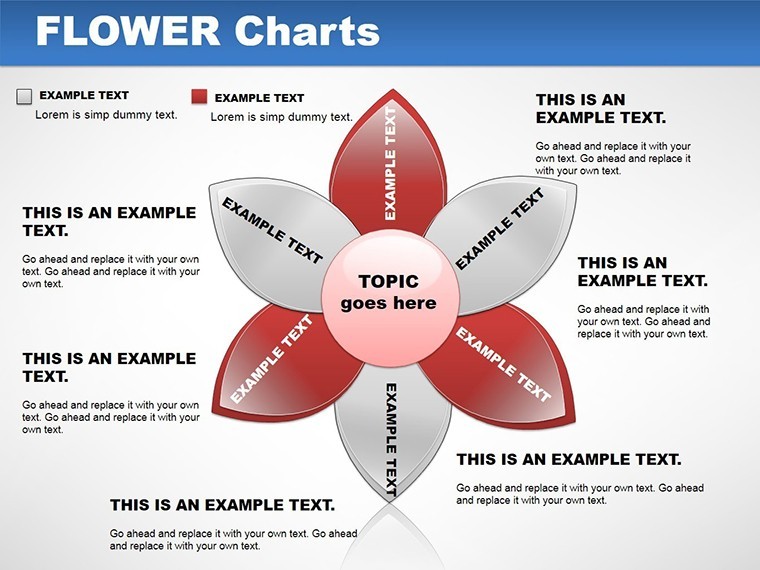
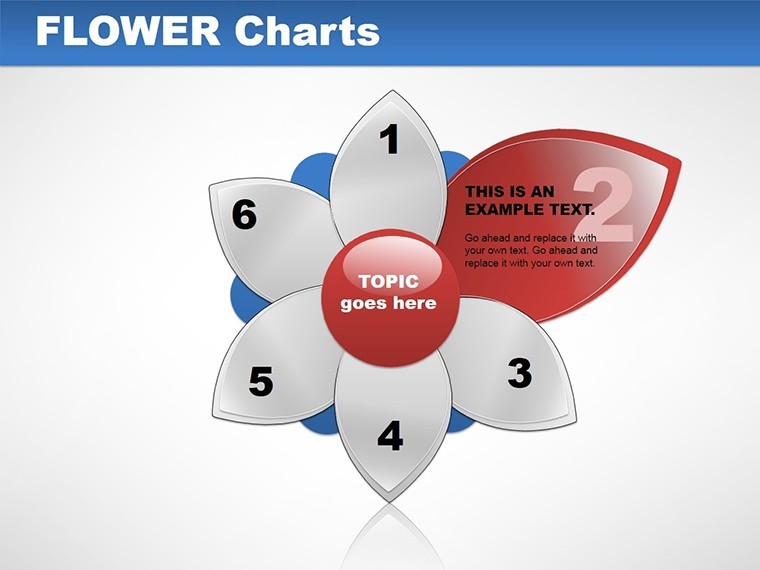
Flower themes bring warmth and vitality to data, making abstract figures feel alive and approachable. This collection draws on illustration principles from botanical artists, using spheres and relationships to depict connections poetically. For instance, in event planning, a flower pie chart can show budget blooms across categories, drawing eyes naturally to larger petals. Unlike rigid tables, these infuse whimsy, ideal for spheres representing networked ideas in team brainstorms.
Essential Features for Creative Flow
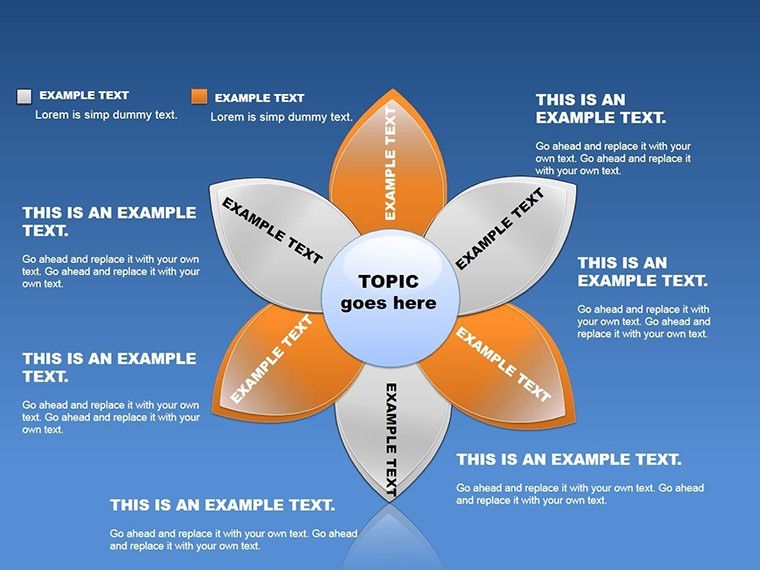
- Thematic Variety: From petal bars to blossom pies, diverse options for any topic.
- Effortless Edits: Tweak every petal - add data, shift hues, refine texts with Keynote's simplicity.
- Illustration Integration: Blend spheres and tables for hybrid visuals that tell layered stories.
- Brand Alignment: Adapt to your palette, ensuring the floral motif enhances, not overshadows.
These draw from AIGA's illustration guidelines, promoting engaging, trustworthy designs.
Blossoming Use Cases in Various Fields
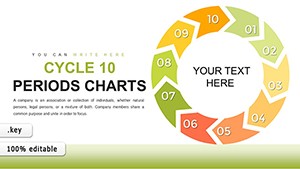
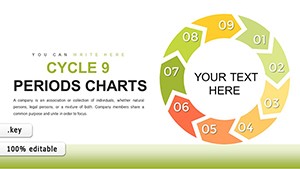
Visualize a business owner pitching to investors: Flower charts illustrate growth phases, with petals expanding like revenue streams. Educators engage students in biology lessons, mapping ecosystems via spherical blooms. Event planners propose themes with illustrated tables, showing attendee breakdowns in floral form. A marketing case study from a boutique agency noted a 40% engagement boost in social media reports using nature motifs, as visuals evoked positive emotions.
Step-by-Step Blooming Your Presentation
- Pick a Slide: Browse 11 variants, from simple blooms to intricate spheres.
- Seed Data: Plant your numbers; watch petals adjust organically.
- Prune and Polish: Change colors for seasonal vibes, add fonts for personality.
- Grow Extras: Incorporate illustrations or tables for depth.
- Harvest Feedback: Share drafts, refine based on views.
Integrate with Canva exports for added graphics, nurturing a full ecosystem.
Edges Over Conventional Keynote Designs
Standard charts lack soul; this floral set adds thematic depth, cutting boredom in long decks. Creation time drops with pre-drawn elements, and recall soars with memorable motifs - per cognitive studies. Trust builds through editable, sourceable data, echoing ethical illustration practices.
Creative Tips from Design Maestros
Use soft gradients for petal realism; limit colors to five for harmony. Add subtle animations - like blooming reveals - for delight. For humor, label a 'thorny' issue slice in strategy decks. Accessibility via alt texts ensures inclusivity, per design ethics.
Plant the seeds of innovation - download and watch your decks flower.
Nurturing Integration in Workflows
Merge with Keynote's timelines for growth narratives, or export for web sharing. In creative teams, collaborative edits via shared drives foster collective blooming.
Slide-by-Slide Garden Tour
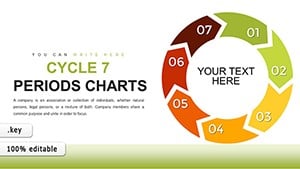
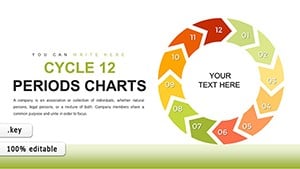
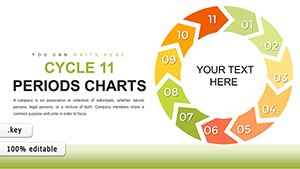
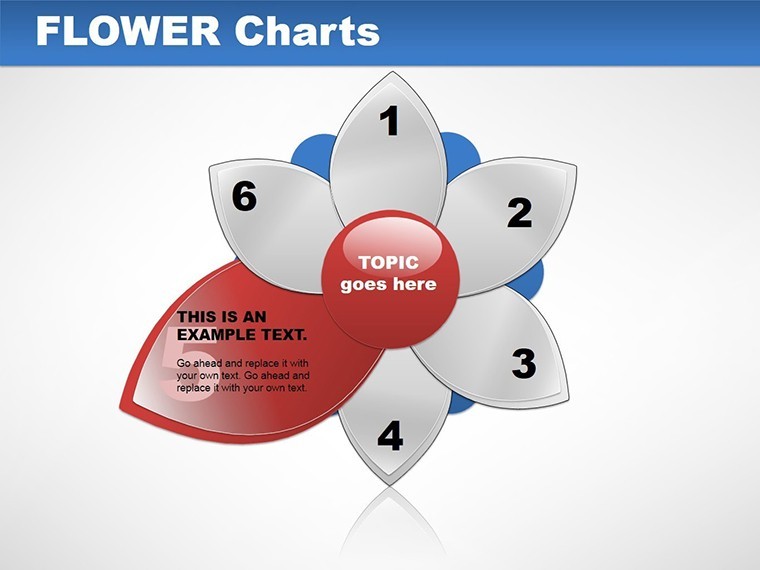
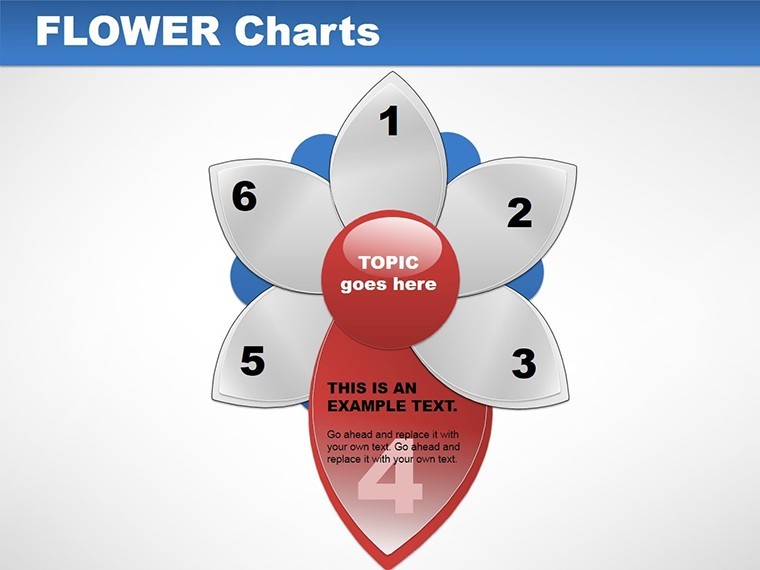
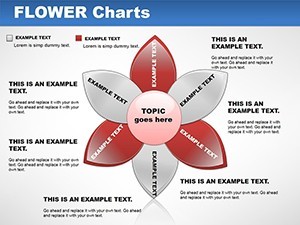
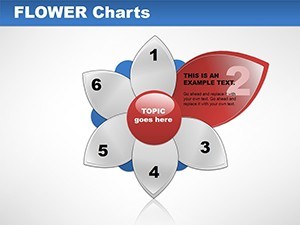
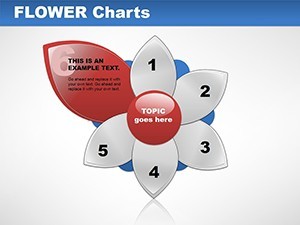
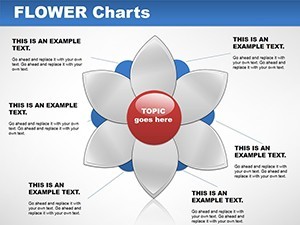
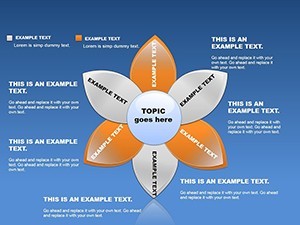
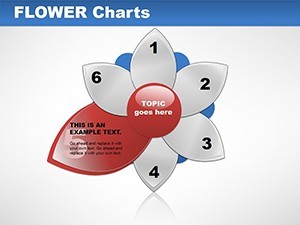
Slide 1: Basic petal bar. Slide 2: Blooming pie. Slide 3: Spherical relationships. Slide 4: Illustrated table. Slide 5: Multi-flower comparison. Slide 6: Gradient blooms. Slide 7: Icon-petal fusion. Slide 8: Dark theme flowers. Slide 9: Data-rich garden. Slide 10: Simple stem charts. Slide 11: Customizable blank. This variety cultivates endless ideas.
This template isn't just visual - it's a catalyst for creative expression.
Frequently Asked Questions
How do I customize the flower elements?
Edit petals, colors, and data directly in Keynote tools.
Can I mix with non-floral charts?
Yes, blend seamlessly for hybrid designs.
Suitable for formal presentations?
Absolutely, tone down vibrancy for professionalism.
What if my data is complex?
Use spheres for multi-layered visuals.
File compatibility?
.key for Keynote across devices.
Adding animations?
Easy with Keynote's build-ins for blooming effects.