Performance Management Keynote Charts: Elevate Your Business Analysis


Type: Keynote Charts template
Category: Cycle, Process, Business Models, Pie, Organizational
Sources Available: .key, .kth
Product ID: KC00042
Template incl.: 16 editable slides
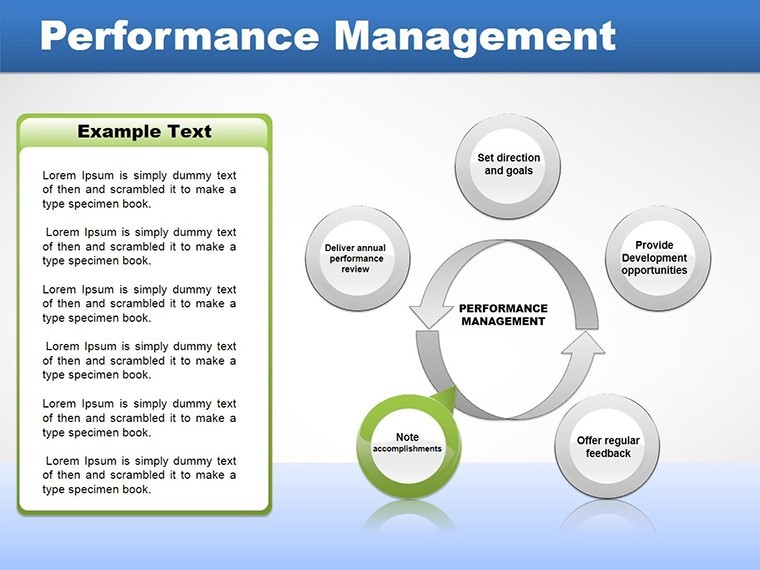
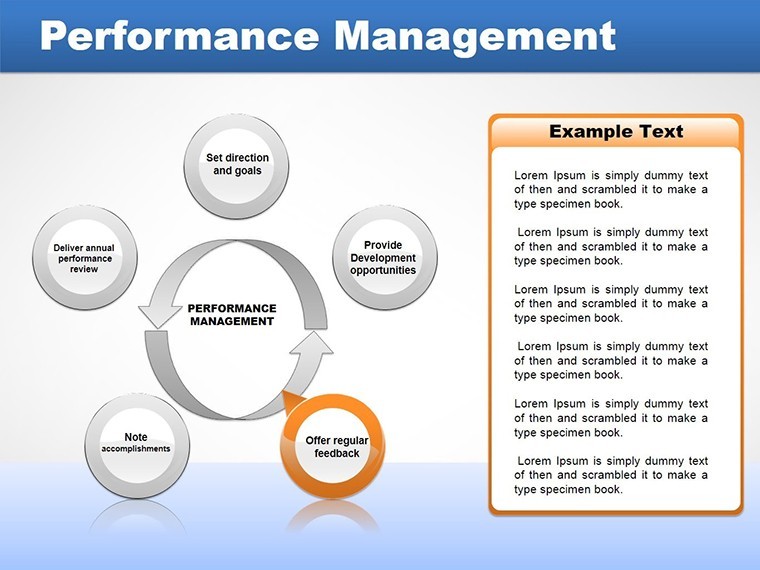
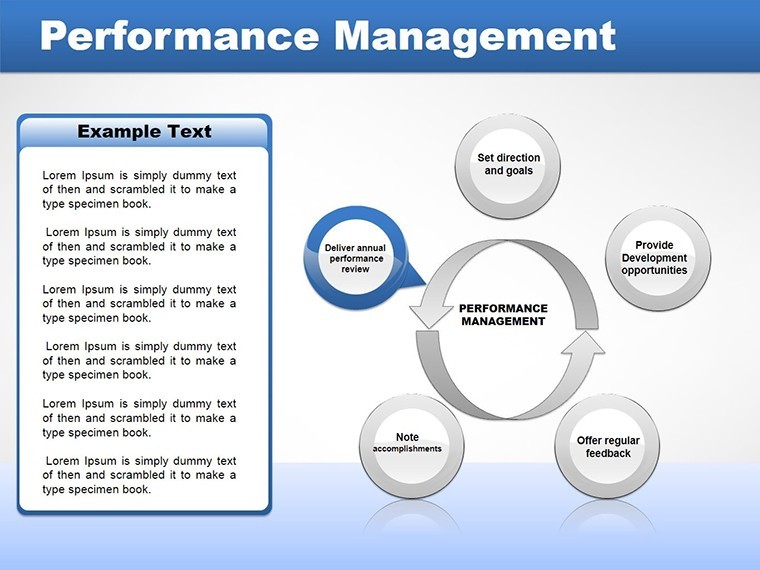
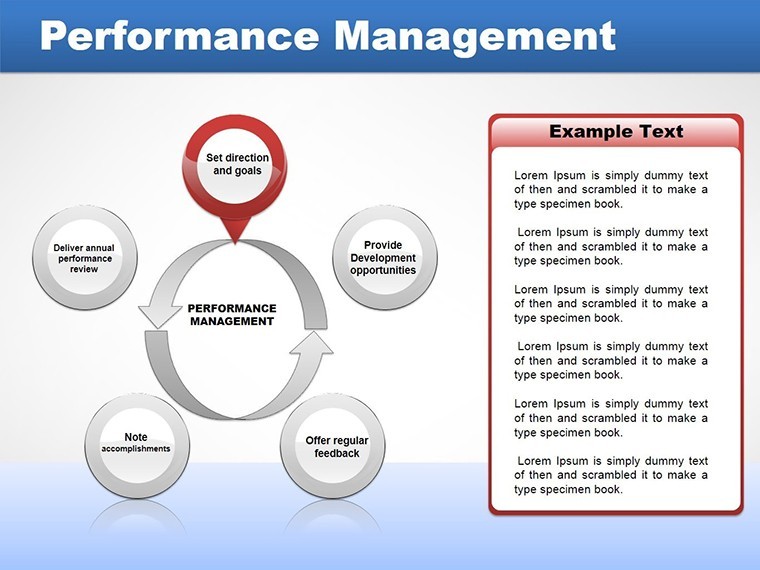
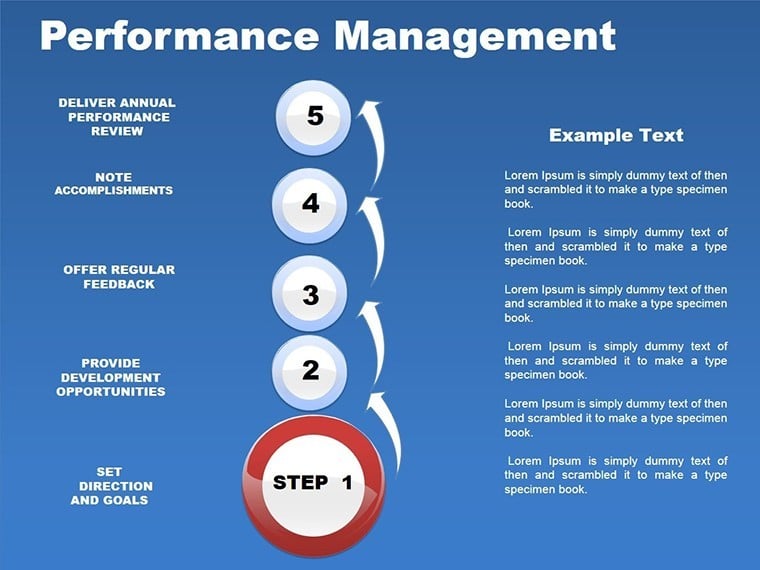
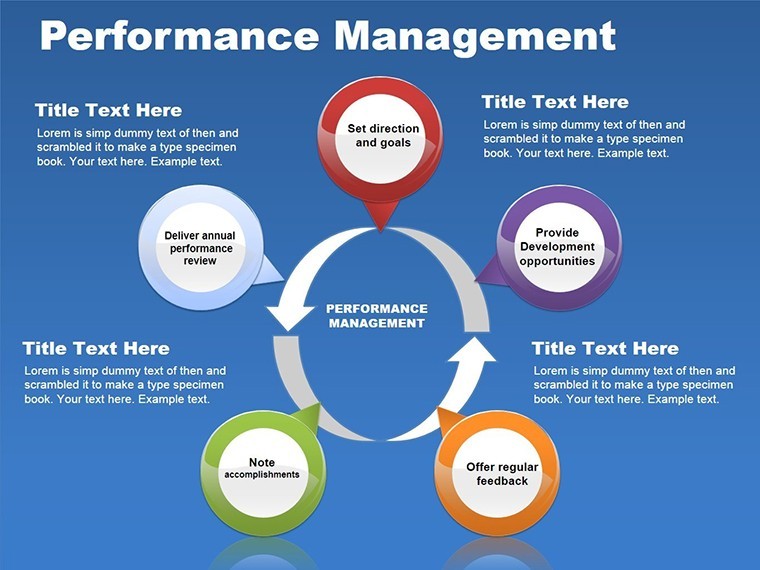
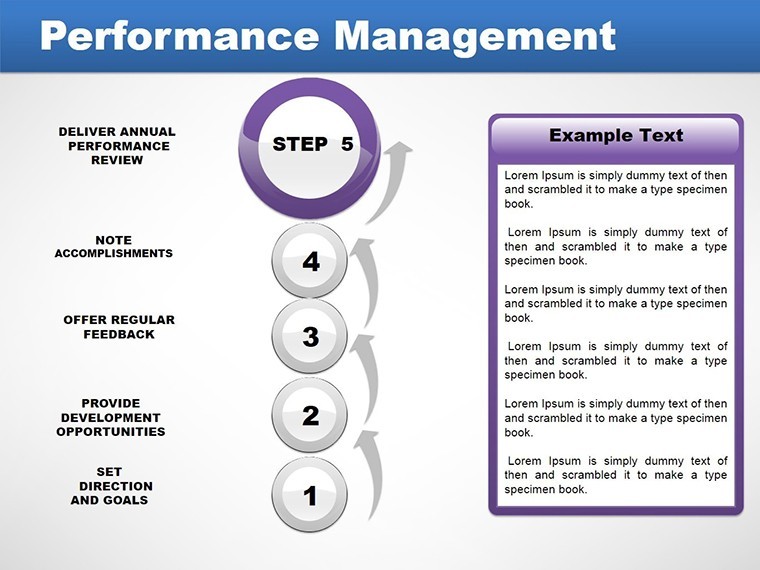
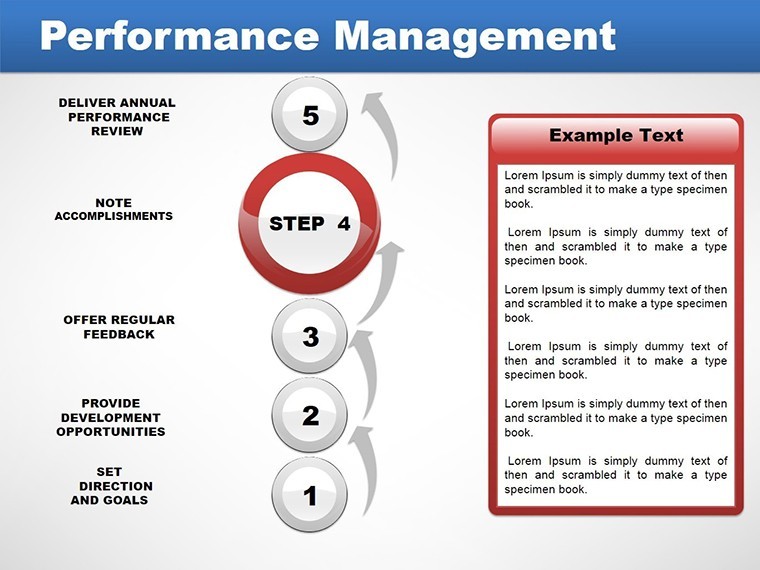
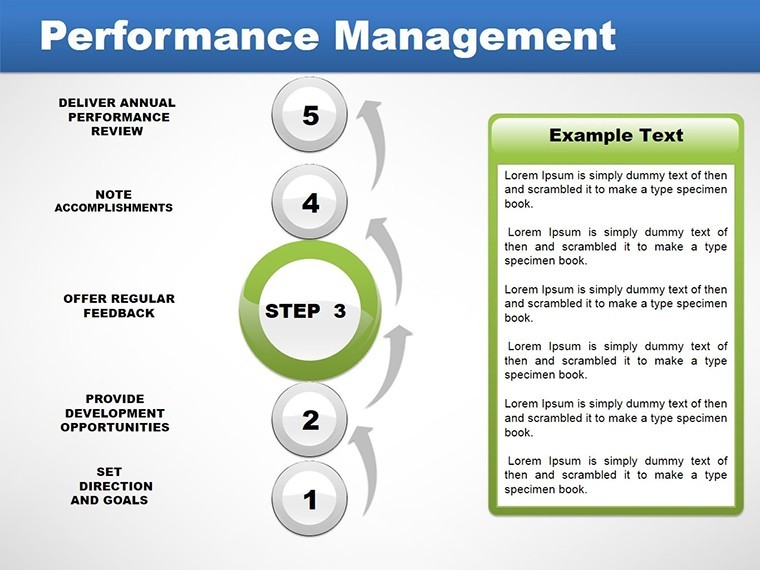
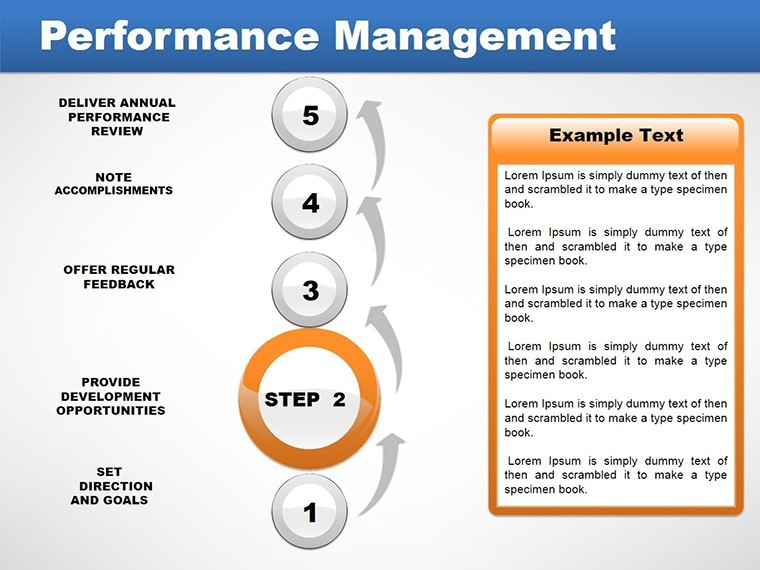
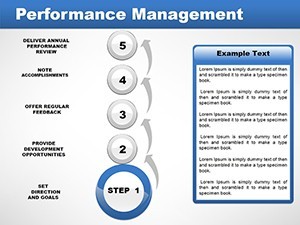
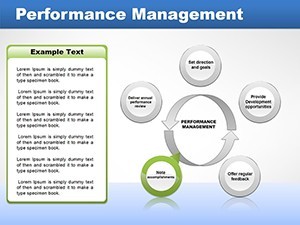
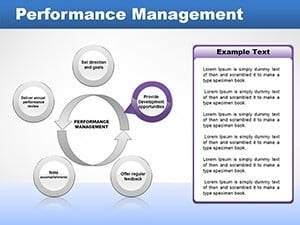
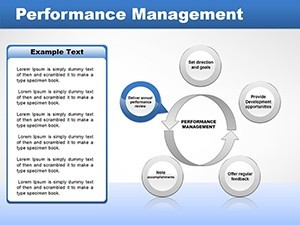
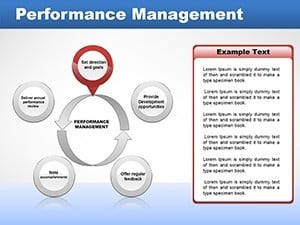
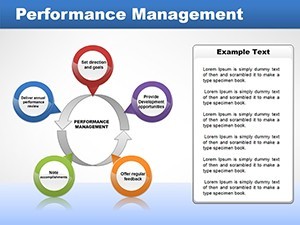
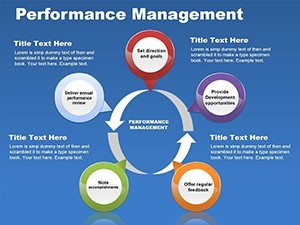
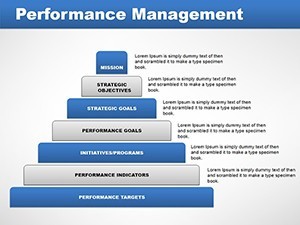
In the fast-paced corporate landscape, effective performance management is the linchpin of success. Our Performance Management Keynote Charts template equips you with 16 editable slides to dissect and improve organizational approaches. Tailored for HR professionals, managers, and consultants, this template addresses common pitfalls like low discipline and executive underperformance, drawing from established business models. Visualize cycles of feedback, process optimizations, and pie charts of resource allocation to foster a culture of accountability and growth.
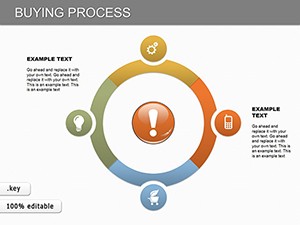
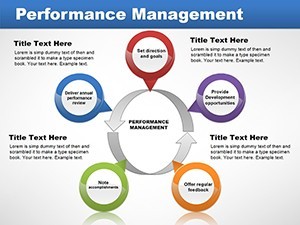
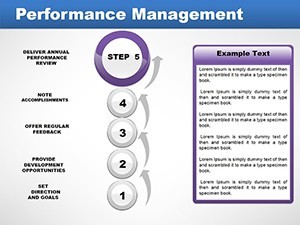
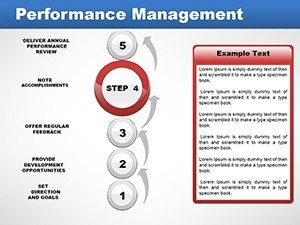
Picture this: a slide where a cycle diagram illustrates the feedback loop from goal setting to review, helping teams identify bottlenecks. With iWork compatibility, including .key and .kth formats, editing is intuitive - swap data, tweak colors, or add icons to align with your company's branding. This isn't just a template; it's a tool to transform raw metrics into actionable strategies, inspired by frameworks from experts like Gallup's employee engagement studies.
Core Features for Strategic Insights
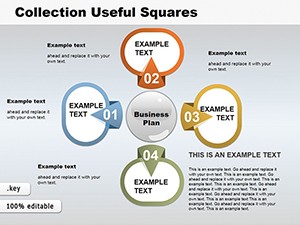
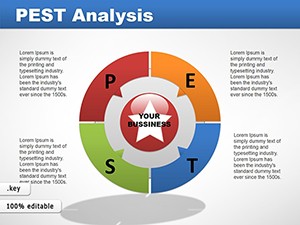
This template stands out with its blend of cycle, process, and organizational charts, perfect for mapping hierarchies and workflows. Each slide is vector-based for scalability, ensuring clarity in boardrooms or webinars. Unlike generic Keynote tools, these charts incorporate business model canvases, allowing you to overlay performance data on pie segments or flow diagrams.
- 16 Versatile Slides: Covering from basic org charts to complex process cycles.
- Editable Elements: Full control over text, shapes, and data inputs.
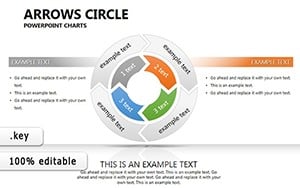
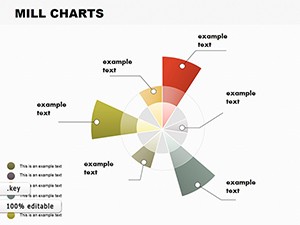
- Pie and Cycle Designs: Ideal for percentage breakdowns and iterative processes.
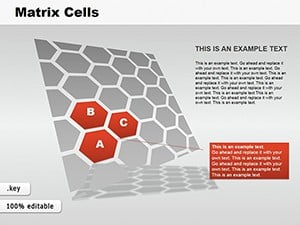
- Organizational Focus: Hierarchy visuals to pinpoint executive roles.
- Professional Aesthetics: Clean lines and modern palettes for executive appeal.
Benefits extend to time savings - pre-built models mean less design work, more analysis. As per Harvard Business Review insights, visual aids like these boost decision-making by 28%.
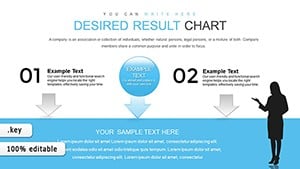
Practical Use Cases in Corporate Settings
For HR leaders, use pie charts to show engagement scores, highlighting areas of low discipline. A real-world example: a mid-sized firm revamped their annual reviews using similar cycles, reducing turnover by 15%, as documented in their case study.
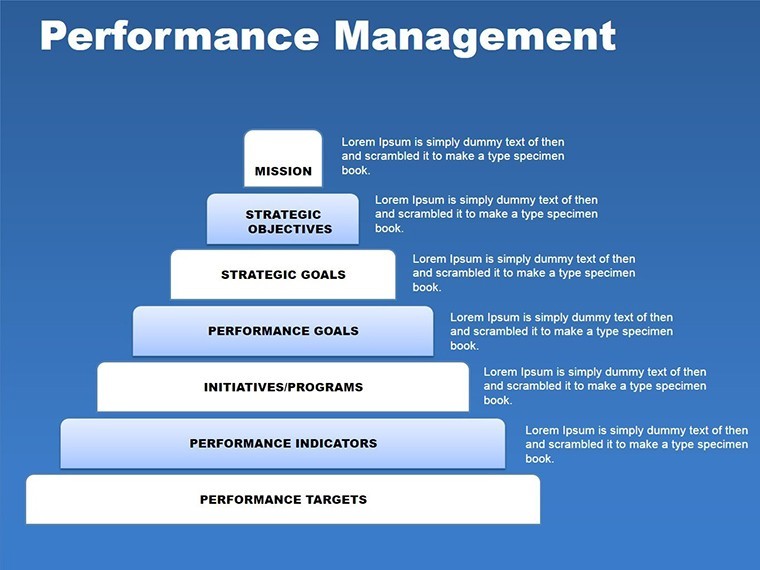
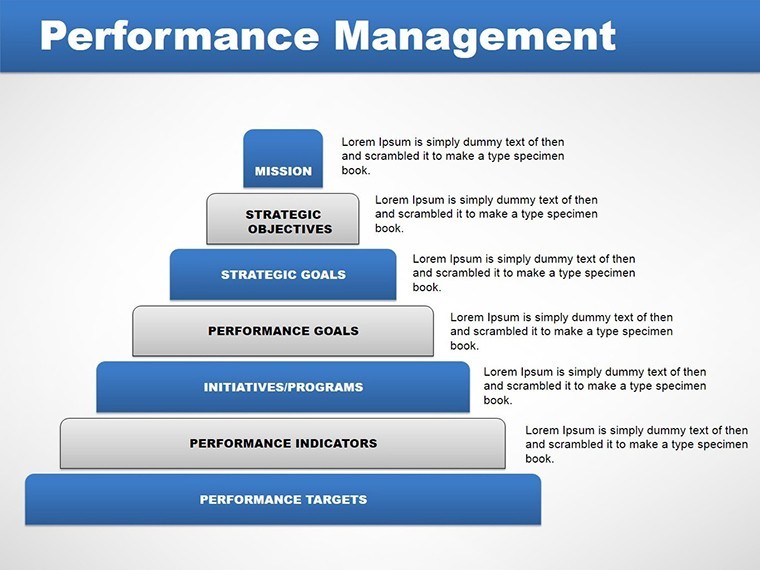
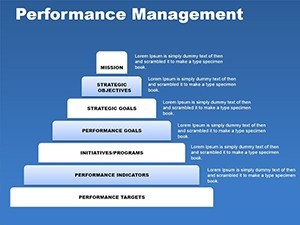
In consulting, process charts map client performance gaps, from entry-level to C-suite. Adapt for training sessions, where organizational pyramids illustrate promotion paths, motivating staff amid executive challenges.
Even in startups, these charts aid in scaling - visualize business models to attract investors, emphasizing disciplined growth strategies.
Customizing for Maximum Impact
- Import your data from spreadsheets into chart placeholders.
- Select color schemes via Keynote's tools for brand consistency.
- Add transitions to cycle slides for dynamic storytelling.
- Layer text overlays on pies for detailed explanations.
- Export to PDF or share via iCloud for collaboration.
Integrate with apps like Asana for real-time performance tracking, creating a seamless workflow.
Superior to Standard Options
Basic Keynote charts lack the depth of our specialized designs. This template offers authoritative models, backed by management theory, ensuring trustworthiness in high-stakes presentations.
Step up your game - download this Performance Management template now and drive real change in your organization.
Frequently Asked Questions
What performance models are included?
Cycles for feedback, pies for metrics, and org charts for structure.
Is it compatible with iPad Keynote?
Yes, fully functional across Apple devices.
Can I add my own data?
Absolutely, placeholders make it easy.
How does it address discipline issues?
Through visuals that highlight gaps in processes.
Are updates available?
Yes, for new Keynote features.