PEST Analysis Keynote Charts Template


Type: Keynote Charts template
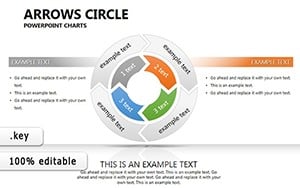
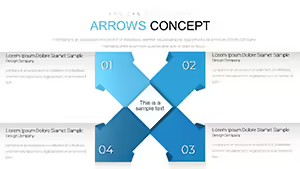
Category: Cycle, Process, Business Models, Pie
Sources Available: .key, .kth
Product ID: KC00041
Template incl.: 15 editable slides
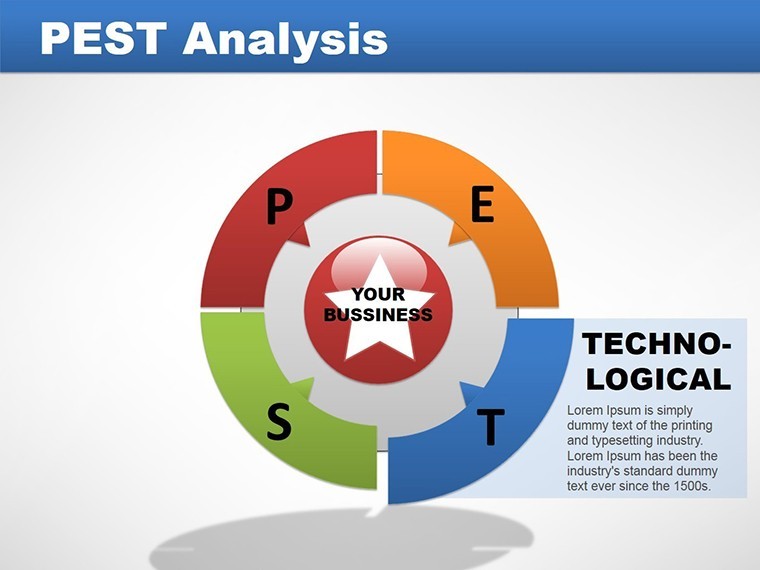
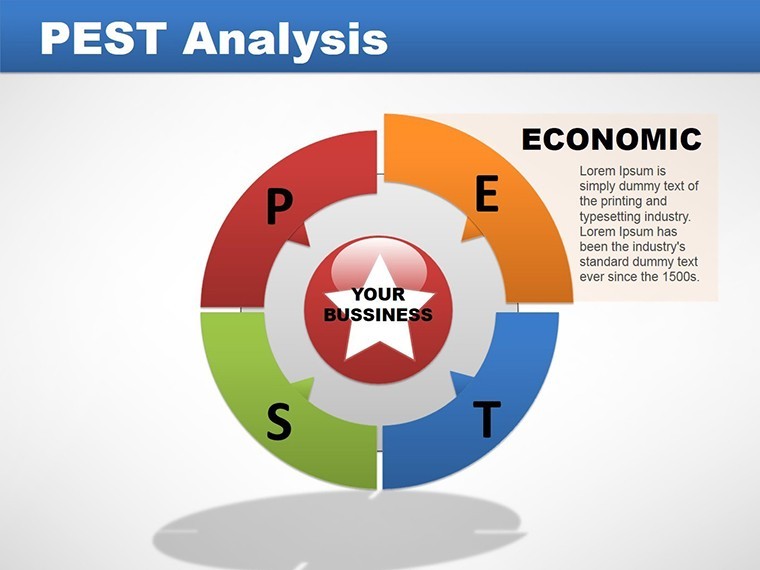
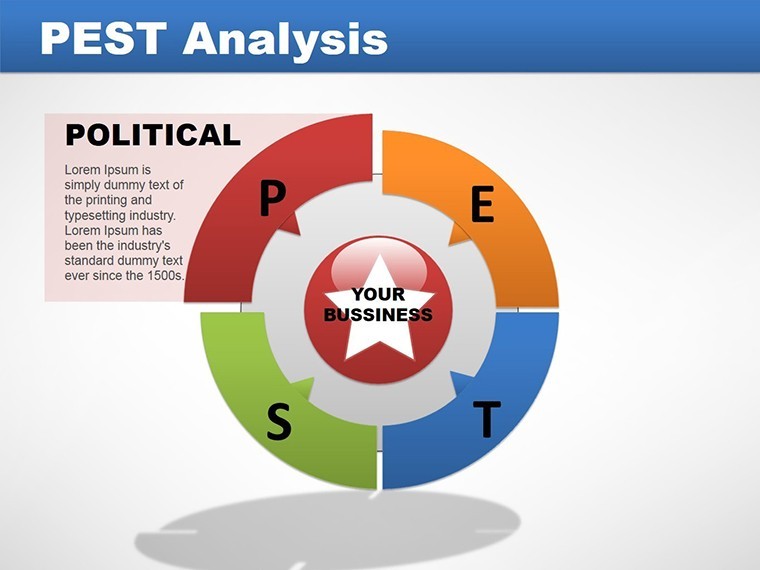
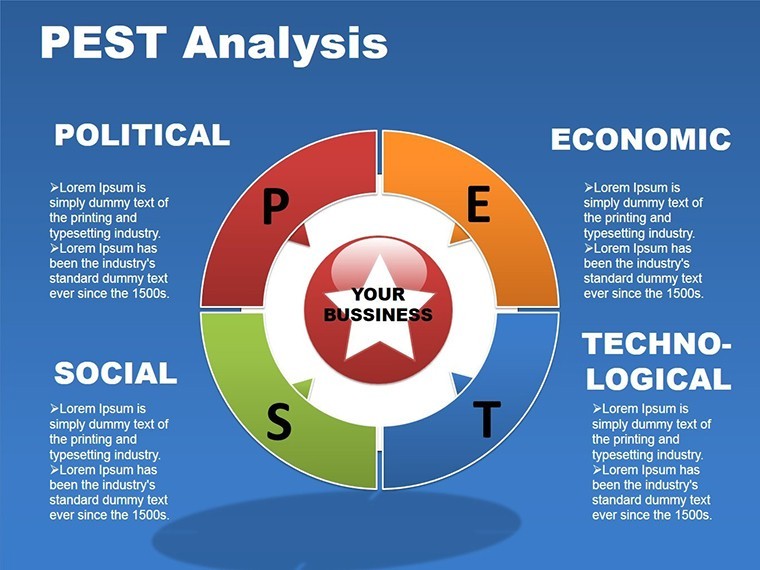
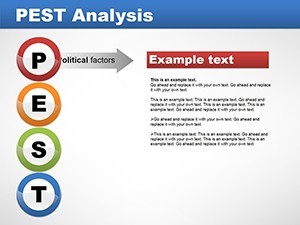
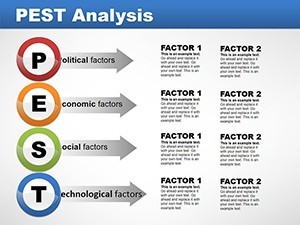
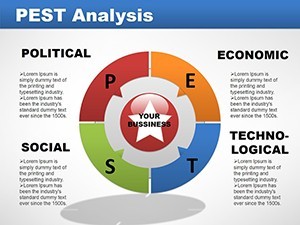
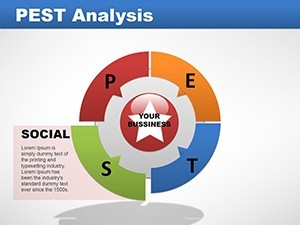
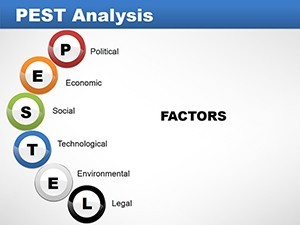
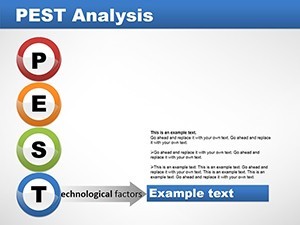
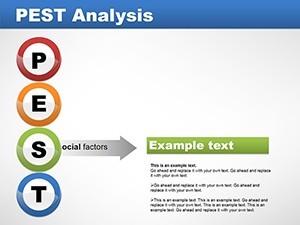
Navigating the complexities of the business landscape requires a keen eye on external forces, and our PEST Analysis Keynote charts template is your ultimate guide. This comprehensive set of 15 editable slides demystifies Political, Economic, Socio-cultural, and Technological factors, helping you craft robust business models with precision. Ideal for strategists, entrepreneurs, and consultants, it transforms abstract analyses into vivid, pie-charted visuals and processes. Fully compatible with Keynote, customize effortlessly to fit your industry - whether assessing market entry for a startup or risk evaluation for a corporation. Move beyond spreadsheets; embrace a tool that clarifies macroenvironmental impacts, fostering informed decisions and strategic agility in an ever-changing world.
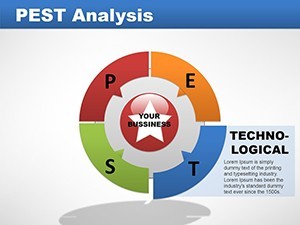
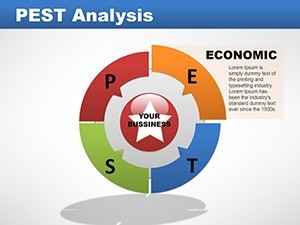
Decoding the Macroenvironment with Precision
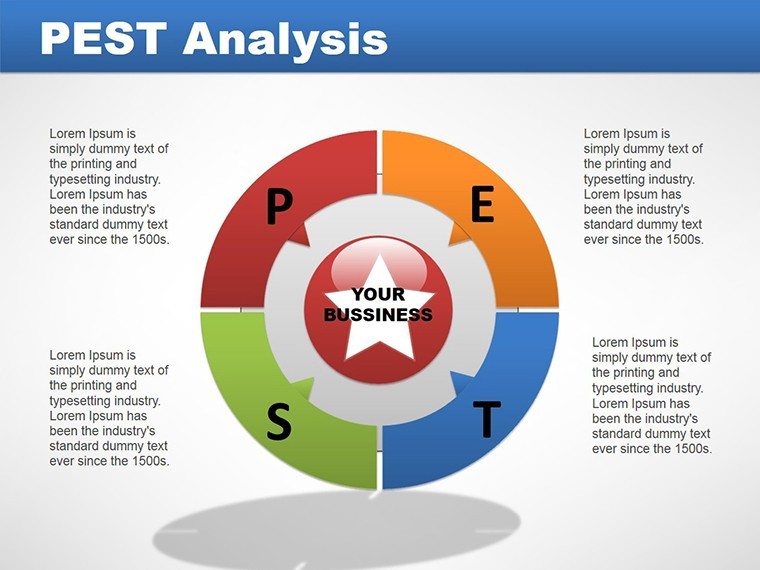
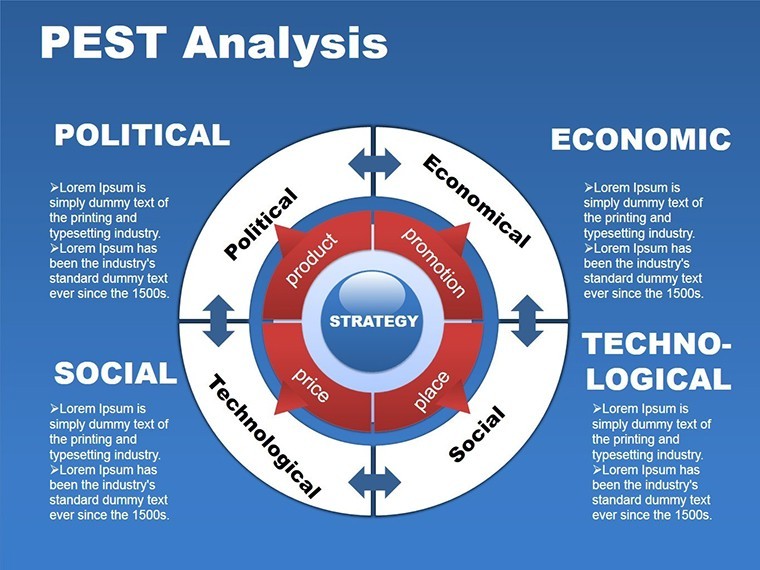
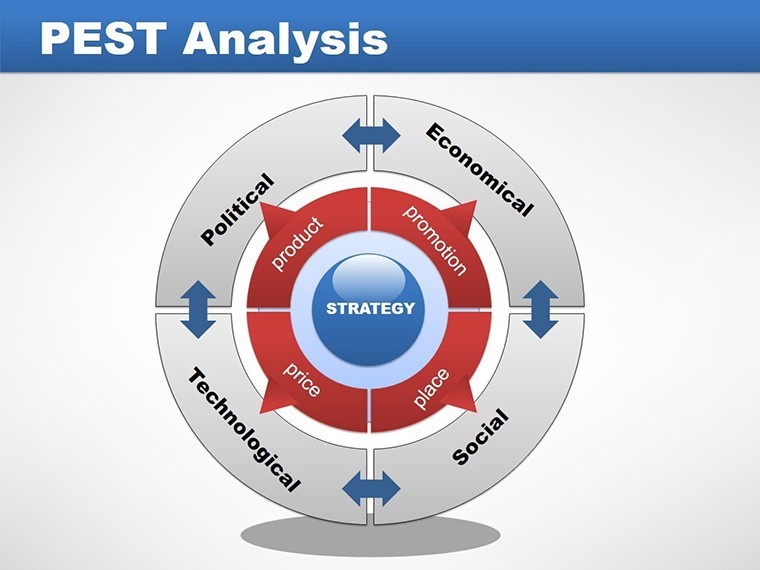
PEST analysis isn't just an acronym - it's a framework for foresight. This template breaks it down with cycle diagrams for ongoing influences, process flows for interconnections, and pie charts for proportional impacts. Consider a retail brand using it to evaluate economic inflation alongside socio-cultural trends like sustainability preferences. Benefits include holistic views that, per Harvard Business Review insights, enhance competitive positioning. Superior to generic tools, it offers Keynote-optimized designs with smooth integrations from sources like Bloomberg data. Weave it into your planning by aligning slides with SWOT for a full strategic suite.
Core Features for Strategic Depth
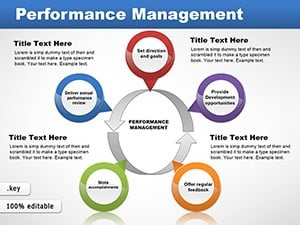
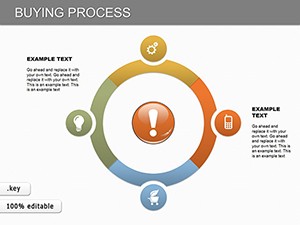
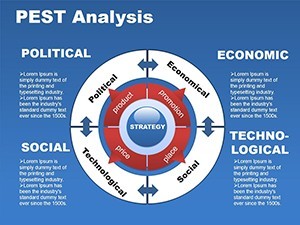
- Cycle and Process Charts: Map recurring factors like policy changes or tech evolutions in looping visuals.
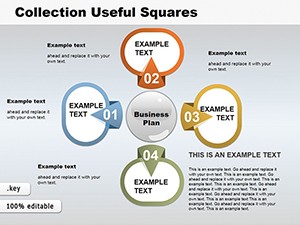
- Business Model Integrations: Link PEST to canvas-style overviews for comprehensive planning.
- Pie Chart Variations: Segment influences proportionally, with easy data swaps.
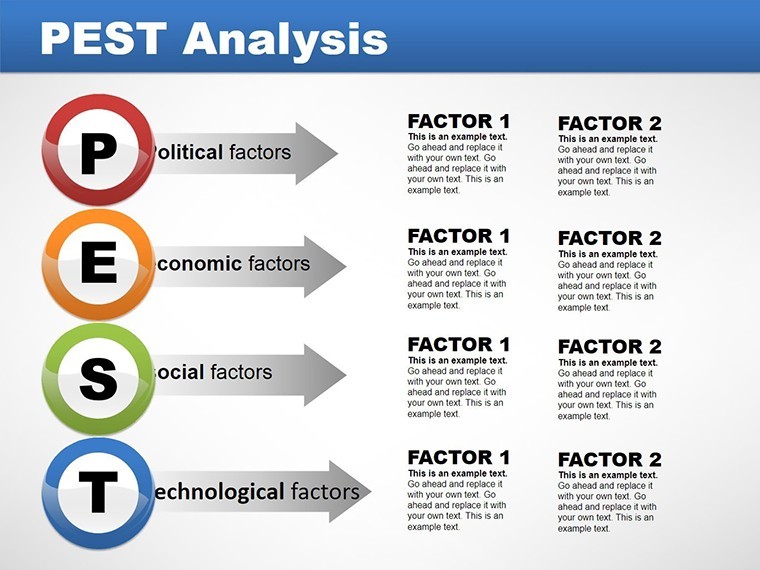
- Vector and Icon Library: Enhance with thematic graphics for each PEST category.
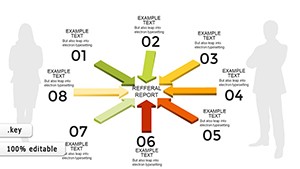
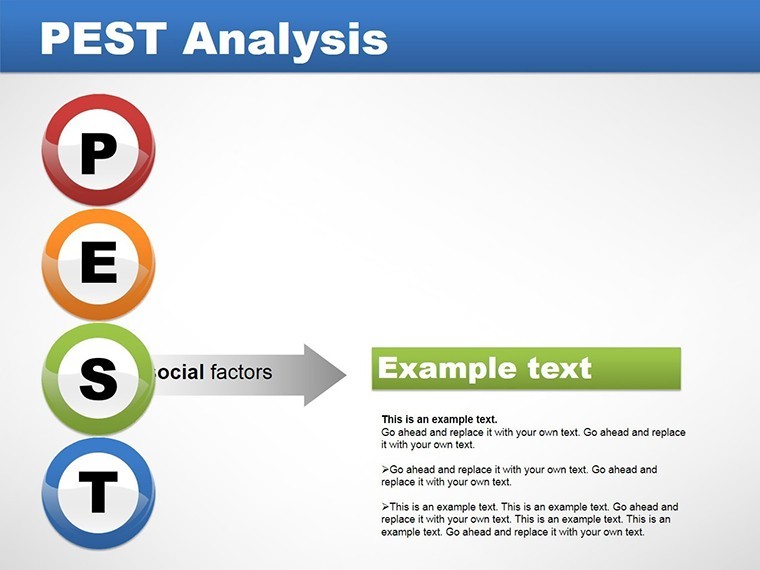
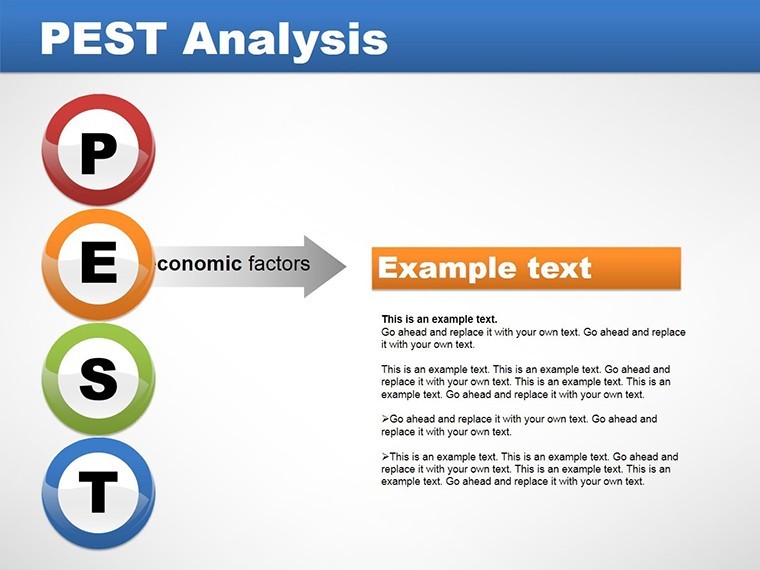
- Animation Sequences: Reveal factors step-by-step for engaging narratives.
Anchored in expert methodologies from bodies like the World Economic Forum, these ensure authoritative outputs.
Strategic Applications: From Startups to Enterprises
Deploy this in diverse scenarios: A fintech firm analyzing regulatory politics, or a manufacturer gauging technological disruptions. It resolves vagueness by quantifying externals, outpacing basic slides with dynamic pies and flows. Value lies in clarity - spot opportunities like demographic shifts early - and model integrations that streamline workflows.
Implementation Guide: Building Your Analysis
- Template Acquisition: Download .key files and open in Keynote.
- Factor Input: Populate with research data, adjusting pies via percentages.
- Visual Refinement: Customize colors to denote severity, add icons for intuition.
- Dynamic Additions: Incorporate links to sources or embed charts from external tools.
- Strategy Finalization: Present and iterate based on feedback.
Tip: Use neutral tones for objectivity, aligning with analytical best practices.
Empowering Decisions with Trusted Insights
Gain an edge by leveraging PEST for proactive strategies, as seen in case studies from McKinsey on global firms. Its editability builds trust, while compatibility ensures seamless use.
Tackling Analytical Challenges
Overcome overload with segmented slides, allowing focused dives into each factor for balanced views.
Unlock strategic mastery today. Secure this template and chart your business's future with confidence.
Frequently Asked Questions
How detailed can PEST charts get?
As detailed as your data - expand segments or add sub-charts for nuance.
Is it suitable for non-business uses?
Yes, adapt for policy analysis or academic research.
Can I link to external data?
Certainly, embed hyperlinks or import from spreadsheets.
What makes the pie charts unique?
They’re interactive, with hover details and easy proportion adjustments.
Does it support team collaboration?
Yes, via iCloud sharing in Keynote.