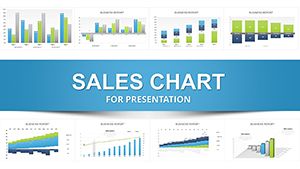
Sales Infographic Keynote Charts Template - 56 Fully Editable Slides | ImagineLayout


Get the Sales Infographic Keynote Charts Template with 56 fully editable slides for Keynote. Visualize revenue trends, sales pipelines and growth metrics with professional infographics. Instant .key download at $14.00. Customize colors, data and layouts for any presentation.
What's Included
The Sales Infographic Keynote Charts Template delivers exactly 56 editable slides in native .key format for Apple Keynote. This collection is built as a complete library of infographic layouts tailored for sales data visualization. You receive the full package upon instant download with no additional files or hidden costs. Every slide contains vector-based placeholders for charts, text blocks, icons and color fills that update instantly when you replace sample data. Priced at $14.00, the set fits the Keynote Charts category and works across recent Keynote versions. The product ID KC01085 confirms authenticity on ImagineLayout.
Slide Library Overview
With 56 slides you gain access to a broad selection of infographic structures covering different sales metrics. The volume allows you to mix and match layouts for comprehensive decks rather than limiting to a handful of options. Each slide maintains consistent alignment and spacing so your final presentation looks cohesive without manual adjustments.
Key Features
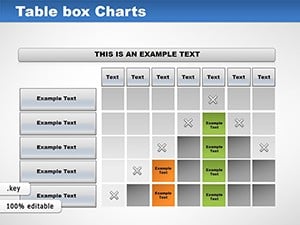
This template stands out with its 56-slide count compared to related products that offer fewer options. All slides use fully editable vector elements so you can resize charts, change colors or add your company logo without quality loss. The design prioritizes clean data display with ample white space around each infographic to keep audience focus on numbers. You can import data directly into placeholders and Keynote handles automatic scaling. The set includes multiple layout variations for the same chart type, giving flexibility when presenting quarterly results or yearly comparisons.
Comparison: This Template vs Building from Scratch
| Feature | This 56-Slide Template | Building from Scratch |
|---|---|---|
| Slide Count | 56 ready-to-use | 1-5 manual creations |
| Time to First Slide | Under 5 minutes | 30-60 minutes per slide |
| Chart Variety | Extensive infographic options | Limited to basic shapes |
| Data Update Process | Direct placeholder replacement | Redraw entire chart |
| Consistent Branding | Built-in alignment | Manual matching required |
| Total Deck Time | 30 minutes | 4-8 hours |
Professional Use Cases
A sales director at a logistics company preparing for a board meeting selected multiple slides from the 56-slide set to map quarterly revenue against regional targets. The outcome was a 15-minute presentation that clearly showed growth areas and led to approval for two new distribution centers. In another case a business analyst at a SaaS firm used the template to compile a client proposal deck. By swapping data into infographic placeholders the analyst finished the deck in under an hour instead of two days of manual chart building. These scenarios highlight how the larger slide count supports both short updates and full multi-metric reports.
Workflow Example
Download the .key file, open in Keynote, replace placeholder numbers with your CRM export, adjust color fills to match brand guidelines, then export as PDF for sharing. The entire process takes minutes because every element is pre-aligned and grouped.
How to Customize
Customization begins by opening the file in Keynote and selecting any slide. Click on chart elements to edit data values or switch chart styles. Text placeholders accept your headlines and bullet points while icon layers can be swapped for industry-specific symbols. Color fills update globally when you change the master palette. You can duplicate any of the 56 slides to extend a deck or delete unused ones without breaking layout consistency. The vector nature ensures sharp output at any zoom level or when printed.
Design Decisions
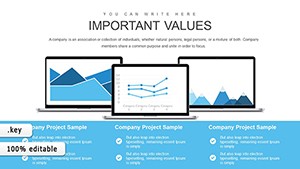
The template uses ample white space around each infographic to prevent data overload during presentations. Layout choices keep charts centered with supporting text below so audiences follow the story without distraction.
Why Choose This Template
This 56-slide collection differentiates itself from related templates on the site by offering more layout options for the same price point of $14.00. The higher slide count means you never run out of variations when presenting complex sales data. Related products like the 47-slide revenue-focused set or microbiology charts serve narrower purposes while this one covers general sales needs across industries. Instant download and native .key format eliminate compatibility issues common with converted files.
Ready to build your next sales deck? Add this template to your cart now.
Frequently Asked Questions
How do I edit the charts in this 56-slide Sales Infographic Keynote Charts Template?
Open the .key file in Apple Keynote and click directly on any chart placeholder. Replace the sample numbers with your own data from Excel or CRM exports. Keynote automatically rescales the visual elements. You can also drag icons or text blocks to new positions and recolor series using the format panel. The process requires no external plugins and works in the latest Keynote versions. All 56 slides maintain their structure after edits so your deck stays professional from start to finish.
Is this template compatible with current versions of Keynote?
Yes, the file uses native .key format tested for Keynote 12 and newer. All vector shapes, placeholders and animations render correctly without conversion. You can open it on Mac, iPad or even export to PowerPoint if needed while retaining chart integrity. The 56 slides were created to match Apple's built-in chart engine so data updates happen instantly.
What licensing applies to commercial use of the Sales Infographic Keynote Charts?
Purchase grants a standard commercial license for creating client or internal presentations. You may use the 56 slides in paid pitches or reports for your company or clients. Redistribution of the original .key file is not permitted. The template remains yours to customize indefinitely after the one-time $14.00 payment.
Can I customize colors and add my brand logo?
Absolutely. Every slide contains grouped elements that allow full recoloring via the Keynote format sidebar. Paste your logo onto any master slide and it appears consistently across the 56 layouts. Text fonts and sizes adjust globally if you edit the theme. These options ensure the final deck matches your company branding while keeping the original infographic proportions intact.
What file format do I receive and is there a refund policy?
You receive a single .key file containing all 56 slides. The download link activates immediately after payment. If the file does not open in your Keynote version within the first 14 days we offer a full refund upon request. This policy protects your purchase while ensuring you get the exact editable sales infographic set described.
How does this 56-slide set differ from the related 47-slide revenue template?
This version provides nine additional slides and a broader general sales focus rather than the revenue-revolution narrative structure of the related product. The extra slides give more layout choices for varied metrics while both remain fully editable in Keynote. Choose this one when your presentation needs maximum variety across multiple sales topics.