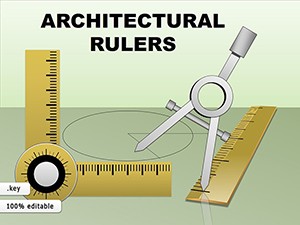
Architectural Keynote Charts Template - Fully Editable | Instant Download


Type: Keynote Charts template
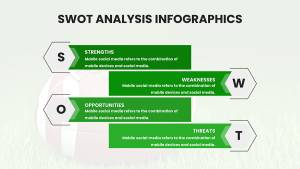
Category: Relationship, Tables, Illustrations
Sources Available: .key
Product ID: KC01056
Template incl.: 42 editable slides
Download the Architectural Keynote Charts Template featuring 42 editable slides with Gantt charts for construction phases, pie charts for material costs, bar graphs for load-bearing capacity, line charts for site progress, and flow diagrams for logistics. High-resolution blueprints and vector icons included. Instant .key download.
What's Included
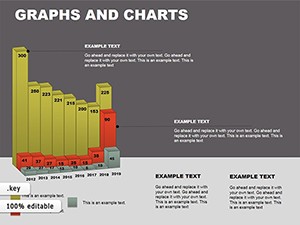
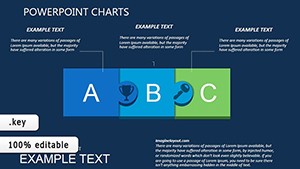
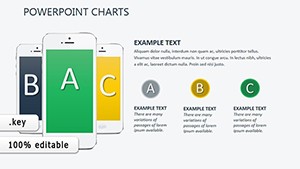
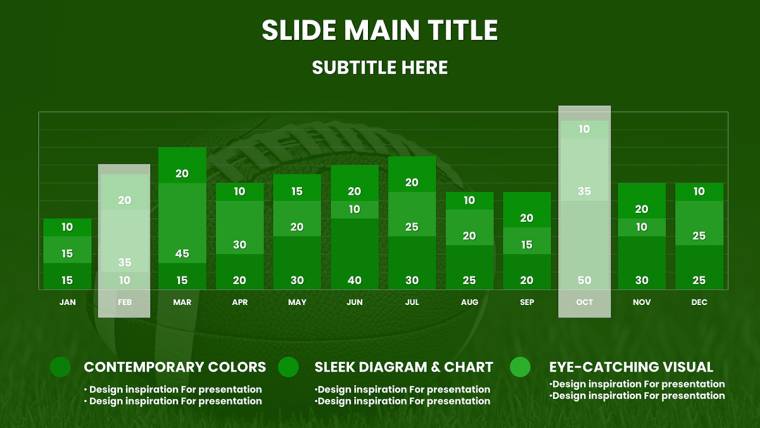
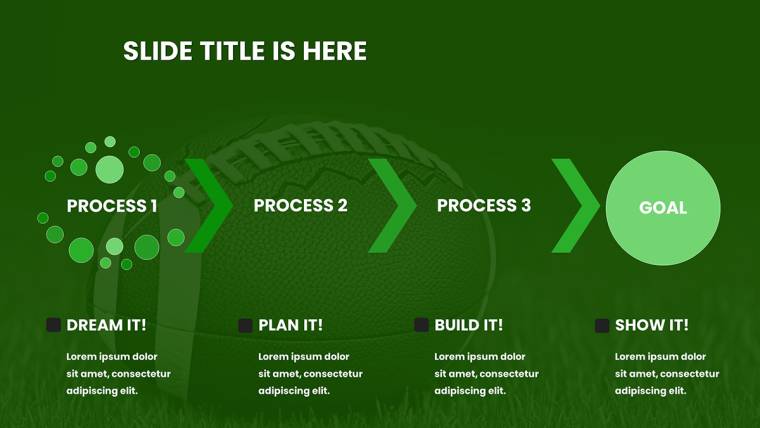
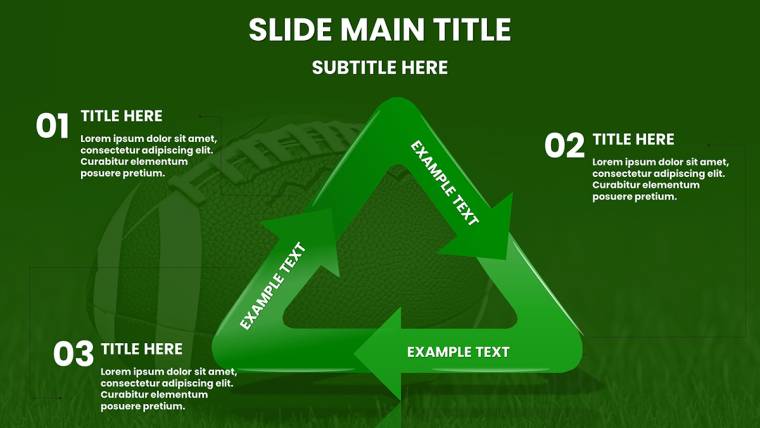
The Architectural Keynote Charts Template provides 42 fully editable slides in native .key format. Contents include Gantt charts mapping construction phases, pie and donut charts breaking down material costs, bar graphs visualizing load-bearing capacities, line charts tracking site progress against milestones, relationship diagrams for team hierarchies, flow diagrams for site logistics, and tables for detailed spec sheets. High-resolution architectural illustrations such as shaded elevations and sectional cutaways plus vector icons complete the package.
Key Features
This template uses precise architectural styling with layered nodes and arrow-driven paths deliberately chosen to mirror real blueprint logic, helping stakeholders grasp complex builds quickly. Gantt charts sync with Microsoft Project timelines via drag-and-drop. Pie charts feature color-coded budget segments. All elements are retina-ready and infinitely resizable. Unlike general infographic or economic analysis templates in the related section, this set contains 42 slides focused exclusively on architecture, urban planning, and construction project visualization.
Key Architectural Elements
- Phased Gantt timelines
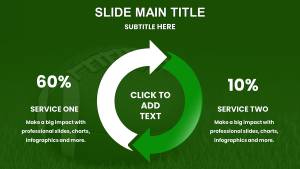
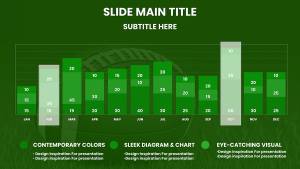
- Material cost pie charts
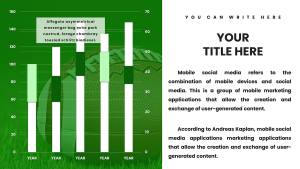
- Load-bearing bar graphs
- Site progress line charts
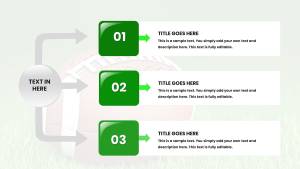
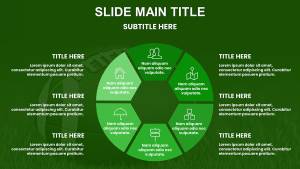
- Team hierarchy diagrams
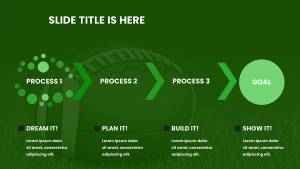
- Logistics flow arrows
Professional Use Cases
An architect at a sustainable design firm used the Gantt charts and flow diagrams to present a high-rise project to city planners, clearly mapping crane placements and pedestrian flows to gain approval in a single review cycle. A project manager at a commercial construction company incorporated load-bearing bar graphs and material cost pie charts into a client update meeting, enabling the owner to approve budget reallocations on the spot. These 42 slides also assisted an urban planner presenting site progress line charts at an AIA conference, resulting in new collaborations with engineering partners. The blueprint-focused design ensures direct relevance for architecture and development workflows.
How to Customize
After instant download of the .key file, open in Keynote and edit Gantt timelines by dragging phase bars or updating milestone dates. Recolor pie chart segments for different material types or paste new load data into bar graphs. Add annotations to sectional cutaways using native tools. Typical workflow: open template - import project data into Gantt slide - adjust flow diagram arrows - apply conditional formatting to tables - export PDF for client handover. The 42 slides support smart grouping and conditional formatting for effortless updates.
Why Choose This Template
Building architectural charts from scratch involves sourcing elevation illustrations, aligning construction timelines, and verifying load calculations visually, often requiring days of work. This template supplies pre-verified Gantt, pie, bar, and flow diagrams with high-resolution cutaways already in place, allowing focus on narrative instead of graphics. The layered node and arrow design was chosen specifically to replicate professional blueprint readability. Related products cover rulers or consumer confidence data, but this one uniquely delivers 42 architecture-centric slides. Comparison table:
| Feature | This Template | From Scratch |
|---|---|---|
| Gantt charts | Phased builds | Manual timelines |
| Material pies | Color-coded | Basic shapes |
| Flow diagrams | Arrow paths | Hours to draw |
| Illustrations | High-res cutaways | Sourced separately |
| Data capacity | Up to 1,000 points | Variable |
| Blueprint style | Vector ready | Inconsistent |
Choose this template to turn technical blueprints into persuasive client stories.
Begin transforming your next project presentation today.
Frequently Asked Questions
How do I sync the Gantt charts with external project management tools?
Open the .key file and copy timeline data from Microsoft Project or similar software directly into the Gantt slide data fields. Drag phase bars to adjust durations; the template updates automatically. All 42 slides maintain vector precision after import, allowing seamless integration with your existing construction scheduling workflow.
Can I recolor the material cost pie charts to match my firm’s branding?
Yes, each pie and donut chart segment is individually editable. Select the fill tool in Keynote and apply your brand colors to any material category. The high-resolution illustrations and flow diagrams retain consistent styling across the 42 slides after recoloring, ensuring professional cohesion in every client deliverable.
What commercial rights are included for architectural client presentations?
Purchase grants full rights to use Gantt charts, bar graphs, and all elements in client pitches, proposals, and conference materials. You may export flow diagrams or load-bearing visuals as PDFs or images. The original .key file is licensed for your firm’s internal and external architectural projects without additional fees.
Do the site logistics flow diagrams support animation for client walkthroughs?
Yes, arrow-driven paths on every flow diagram include built-in Keynote animation options to reveal crane or pedestrian routes sequentially. Timing and order remain fully adjustable after customization. The 42 slides ensure these animations work perfectly on Mac or iPad for dynamic project reviews.
What file format and compatibility does the 42-slide template offer?
The instant download delivers one native .key file compatible with all recent Keynote versions on Mac, iPad, and iCloud. The 42 slides open instantly with no conversion needed. Retina-ready vectors and tables display crisply on any device used for architectural presentations.
Can I add my own elevation illustrations to the sectional cutaway slides?
Yes, each cutaway slide includes drag-and-drop placeholders sized for high-resolution images. Import your shaded elevations or custom drawings directly; the template maintains alignment and scaling automatically. All 42 slides preserve professional layout integrity after adding firm-specific visuals.