Psychology of Leadership Charts Keynote Template: Insightful Tools for Dynamic Leaders


Type: Keynote Charts template
Category: Relationship, Analysis
Sources Available: .key
Product ID: KC01051
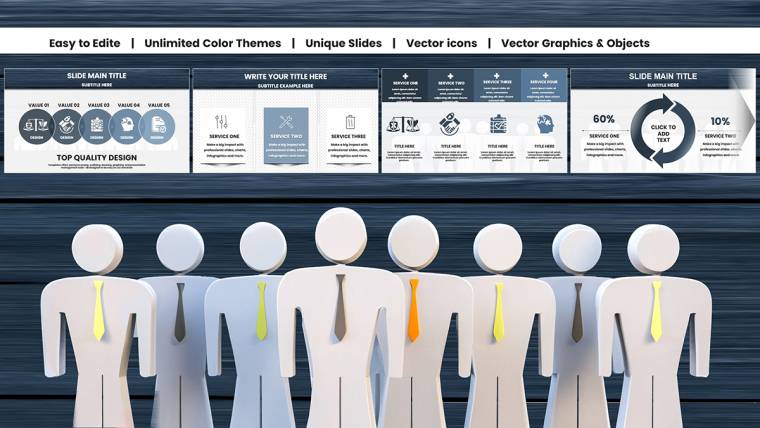
Template incl.: 39 editable slides
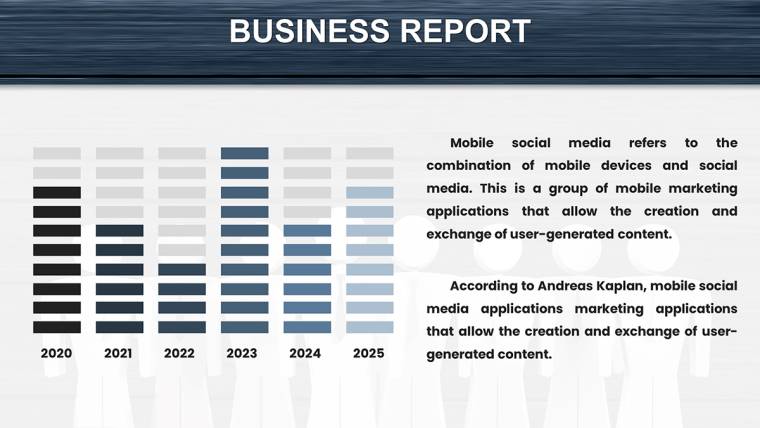
Leadership isn`t just about strategy; it`s rooted in psychology - understanding motivations, emotions, and team behaviors. Envision leading a workshop where charts vividly illustrate emotional intelligence models, sparking real change among participants. Our Psychology of Leadership Charts Keynote Template provides 39 editable slides to do exactly that, crafted for coaches, HR specialists, and executives who aim to foster better leadership through visual psychology.
This template transforms abstract concepts into tangible visuals, addressing common challenges like low team morale or decision-making pitfalls. Drawing from frameworks by experts like Daniel Goleman on EQ, it offers diagrams that make psychology accessible. Whether in corporate training or academic settings, these slides enhance engagement, much like successful programs at Harvard Business School that use visuals to boost retention.
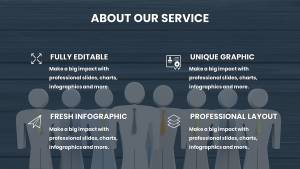
Essential Features for Psychological Depth in Presentations
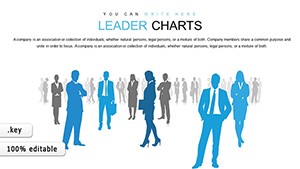
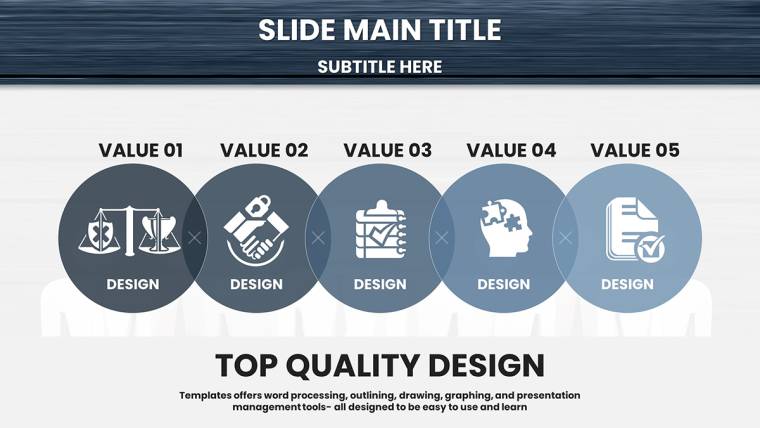
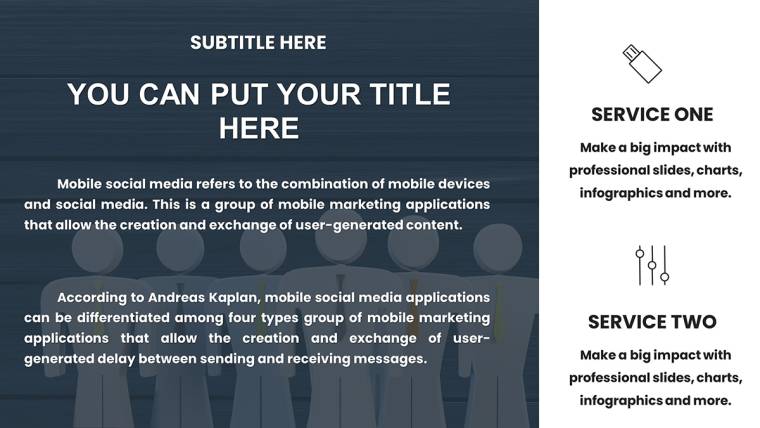
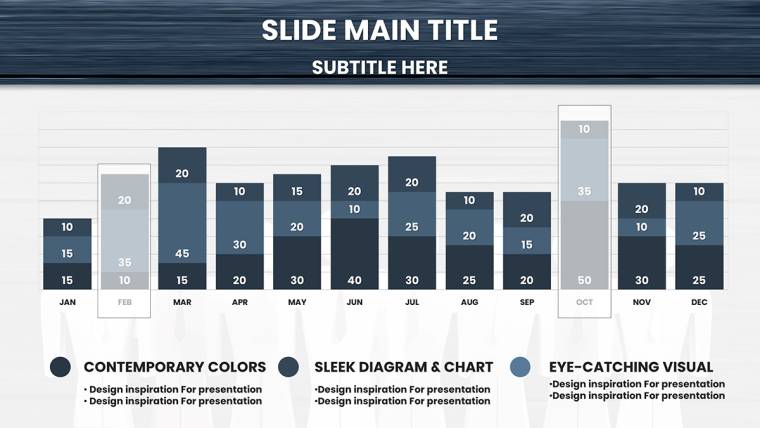
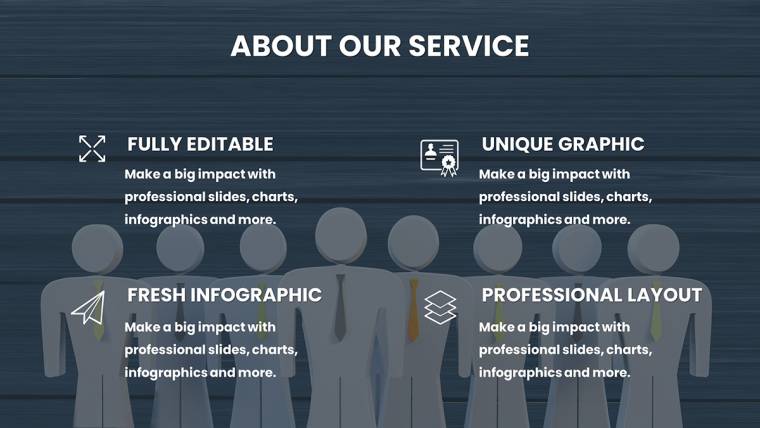
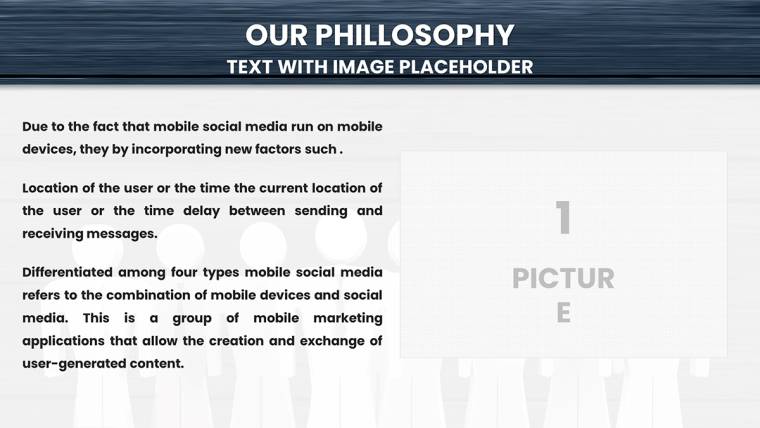
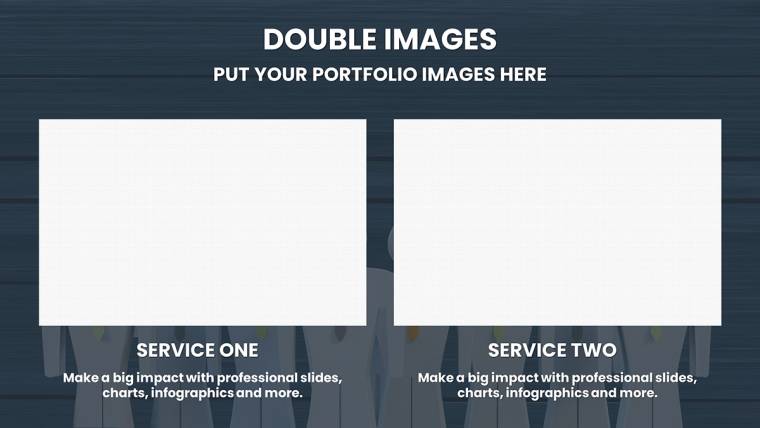
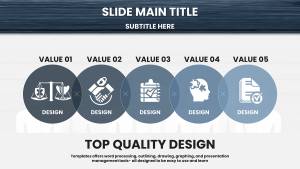
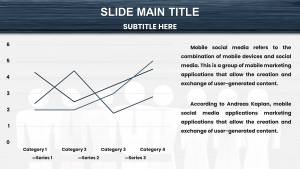
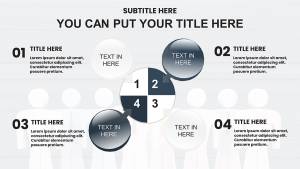
Key to this template are high-resolution diagrams depicting leadership styles - from transformational to transactional - with editable nodes for personalization. Clean layouts ensure focus on content, with responsive designs that scale beautifully.
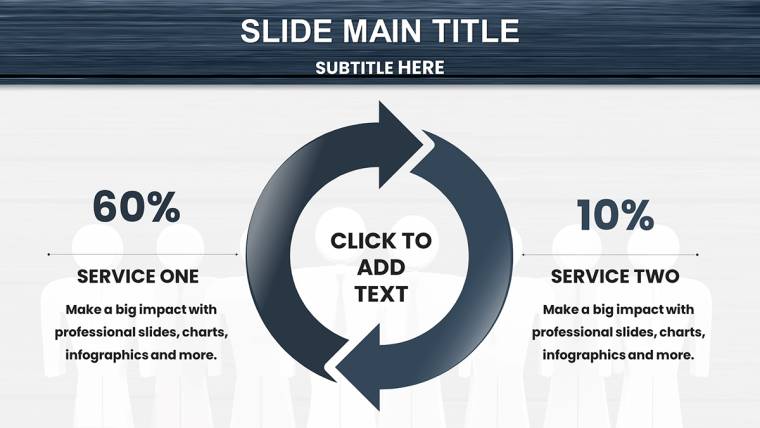
Built for Apple Keynote, it includes easy-edit elements like color schemes reflecting psychological themes (e.g., calming blues for trust). Animate flows to show decision trees, adding interactivity without complexity.
Comprehensive Slide Exploration: Building Blocks of Leadership
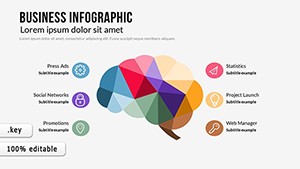
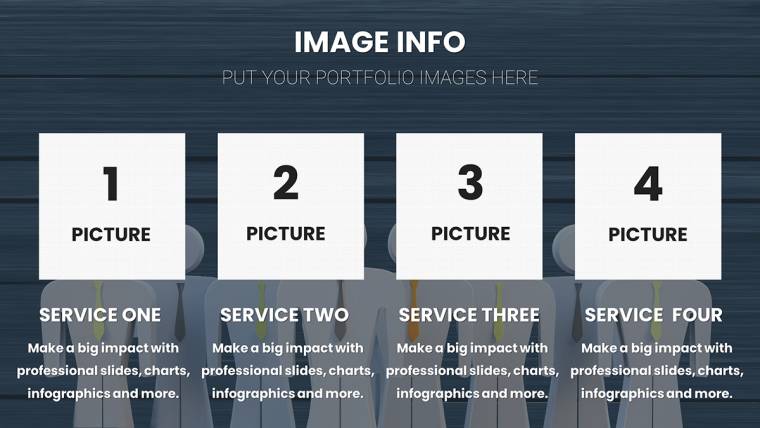
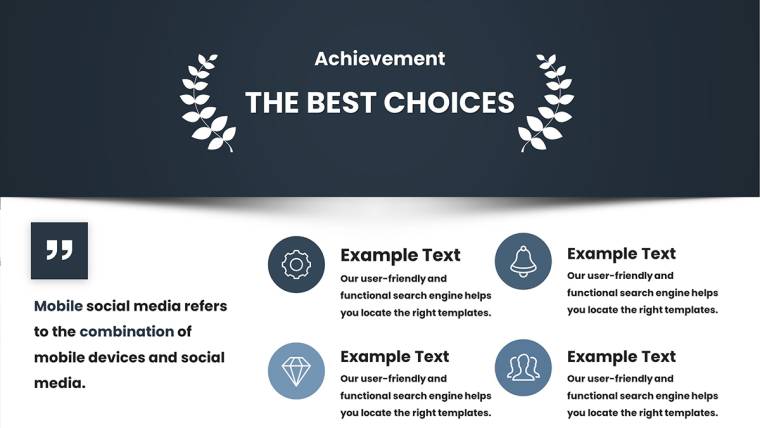
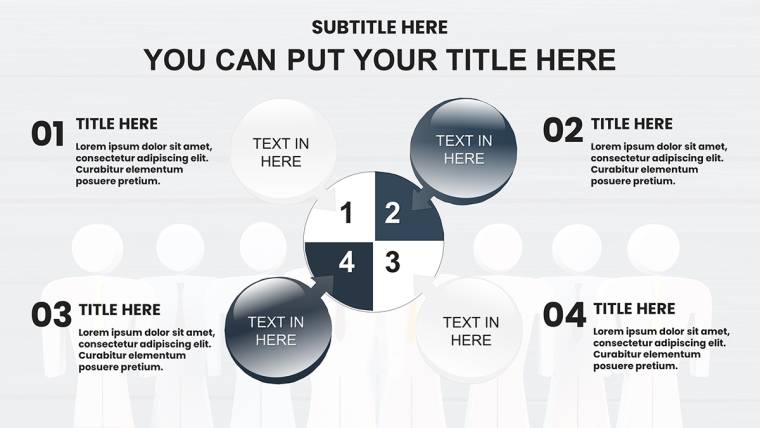
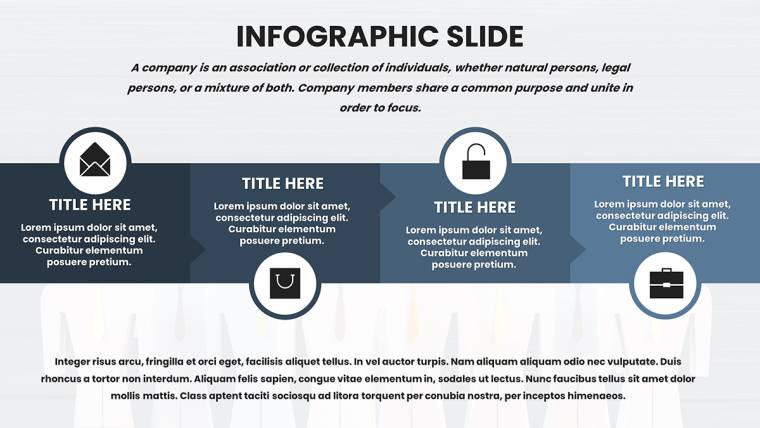
Starting slides (#1-10) cover basics: Personality profiles via charts like the Big Five model, customizable for case studies. Slide #7, for example, uses infographics to map motivation theories, ideal for explaining Maslow`s hierarchy in team meetings.
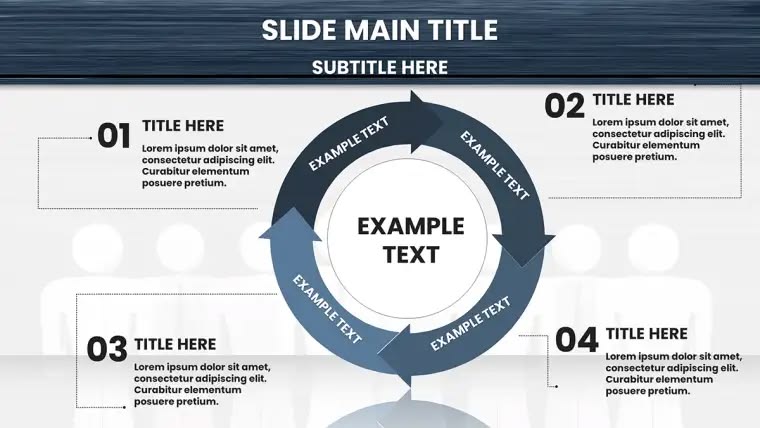
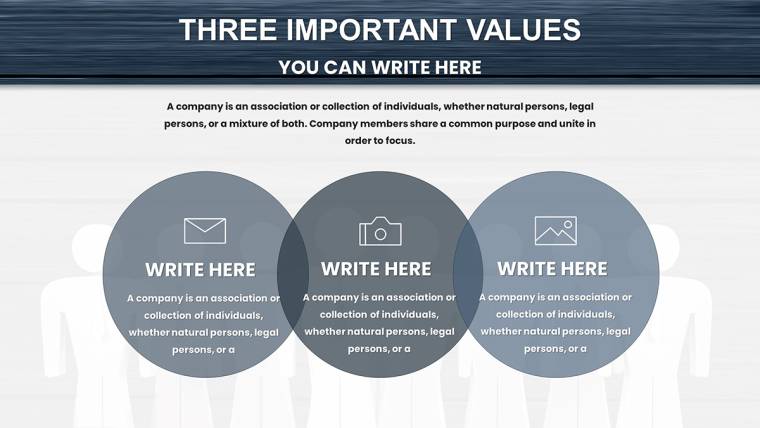
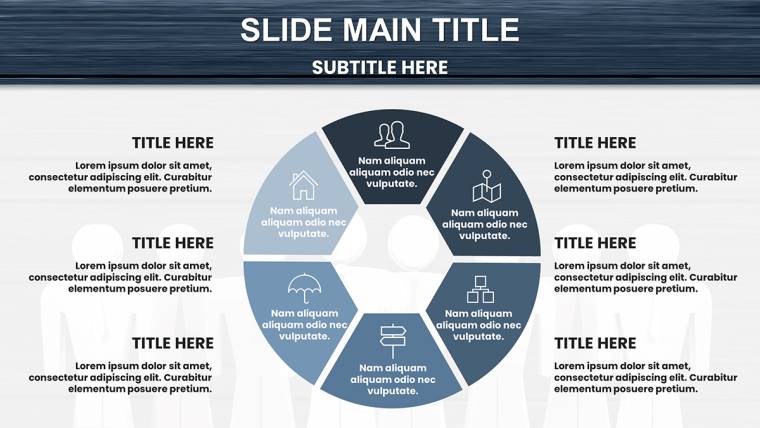
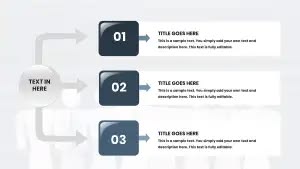
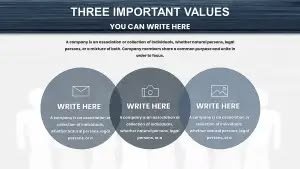
Core sections (#15-25) delve into dynamics: Network graphs for team interactions, highlighting communication bottlenecks. Use these in workshops to visualize conflict resolution, similar to methods in Google`s Project Aristotle on team effectiveness.
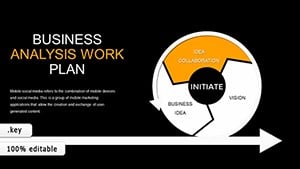
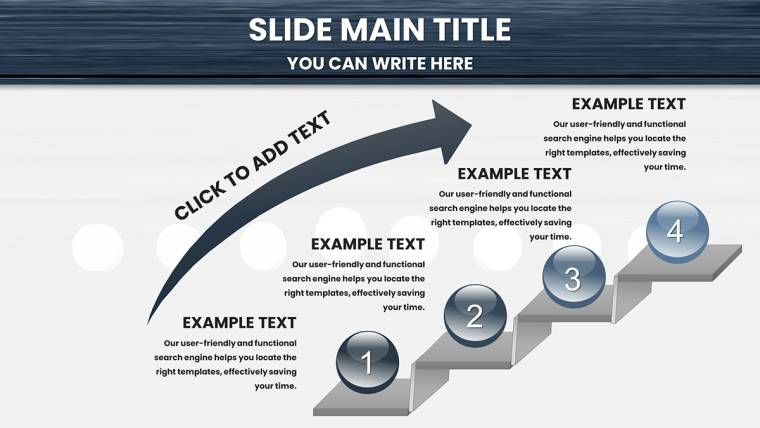
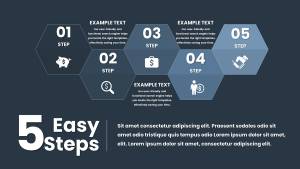
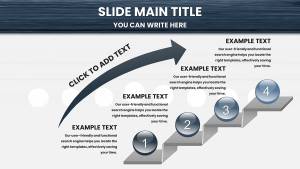
Advanced slides (#30-39) focus on applications: Comparison charts for leadership outcomes, with timelines for development paths. End with reflective summaries to encourage audience introspection.
Versatile Applications: Empowering Leaders Across Fields
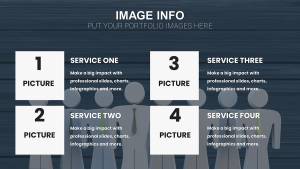
For HR pros, adapt for onboarding, showing how psychological insights improve retention. Coaches can use in seminars to diagram goal-setting, boosting client outcomes as per ICF standards.
In academia, enhance lectures on behavioral economics. A Yale study analogue shows visual aids increase comprehension by 25%. Unlike generic slides, this offers psychology-specific tailoring, streamlining prep.
Strategic Tips for Effective Use
- Personalize deeply: Swap in real team data for relevance.
- Balance visuals: Pair charts with narratives for holistic impact.
- Facilitate discussions: Use slides as prompts for group exercises.
- Integrate tools: Combine with apps like Mentimeter for polls.
From my experience in leadership content, these elevate sessions profoundly.
Inspire Change with Confidence
Step up your leadership game - download the Psychology of Leadership Charts Keynote Template and lead with psychological savvy.
Frequently Asked Questions
- How customizable are the leadership diagrams?
- Completely - edit shapes, texts, and colors to fit your needs.
- Compatible with iPad Keynote?
- Yes, works seamlessly on macOS and iOS devices.
- What psychology models are included?
- Features for EQ, motivation, and team dynamics frameworks.
- Can I export to other formats?
- Easily to PDF or images for versatility.
- Ideal for beginners?
- Yes, intuitive design suits all skill levels.