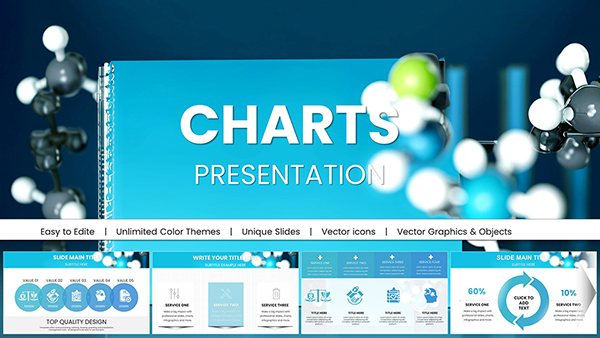
Construction Companies Keynote Charts Template: Build Visions with Data-Driven Clarity


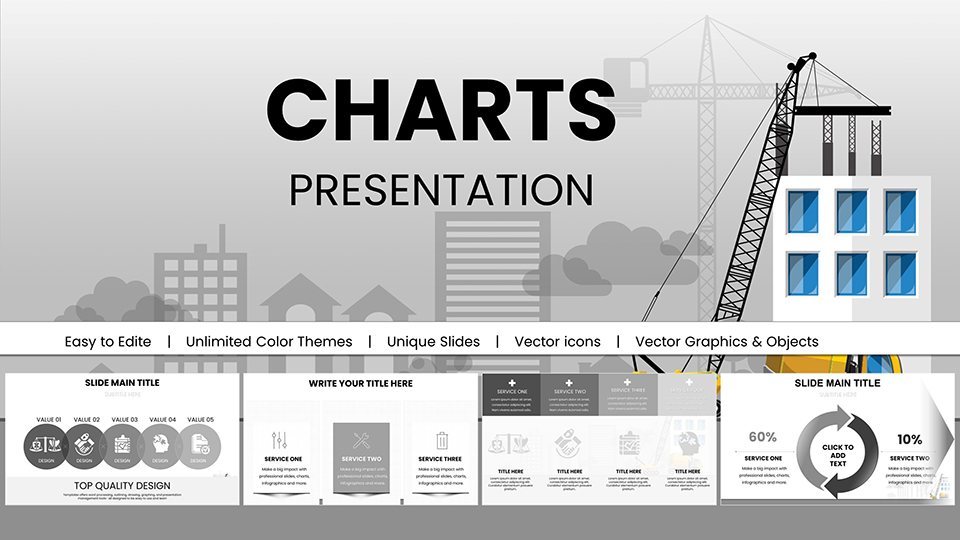


For construction managers and architects navigating the complexities of urban development, turning blueprints into reality demands more than sketches - it requires compelling data presentations that align teams and secure approvals. Our Construction Companies Keynote Charts Template delivers exactly that, with 59 editable slides engineered to showcase project timelines, resource allocations, and progress metrics. Inspired by AIA standards for architectural presentations, this tool helps professionals like you articulate designs and forecasts with precision, fostering collaboration in high-stakes environments.
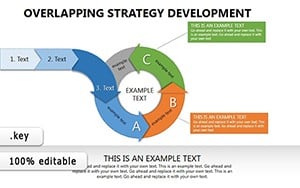
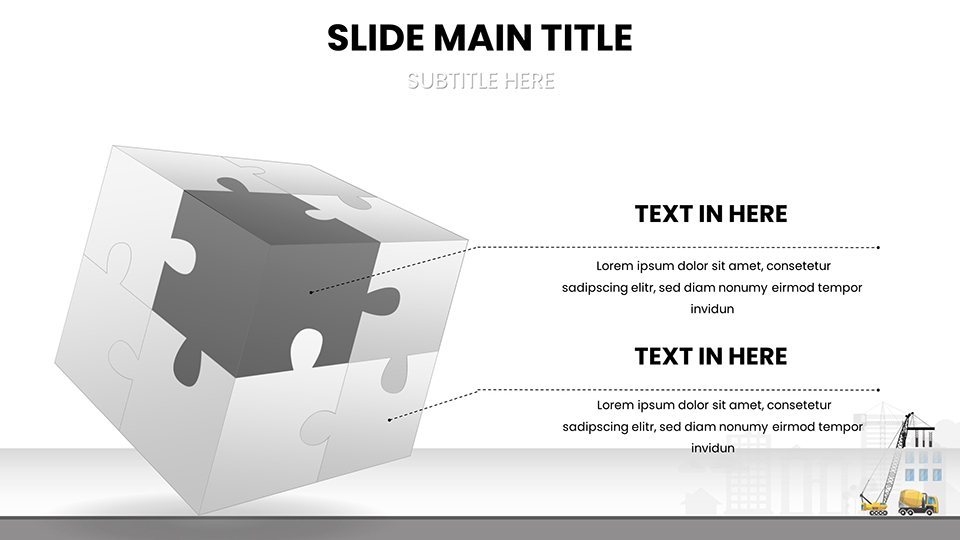
Envision presenting a skyscraper proposal where Gantt charts seamlessly outline phases from foundation to finishing, or 3D models highlight structural innovations. This template bridges the gap between technical data and stakeholder understanding, drawing from successful case studies like LEED-certified builds to demonstrate sustainable practices. It's not just about displaying numbers; it's about crafting narratives that propel projects forward, ensuring every slide contributes to your project's success story.
Core Features Tailored for Construction Excellence
The template's design caters to the unique needs of the construction industry, offering intuitive tools for visualizing everything from site surveys to cost breakdowns. Real-time data integration means your charts update as projects evolve, keeping presentations current amid changing scopes.
Highlighting Key Components
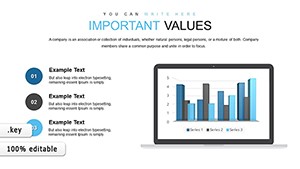
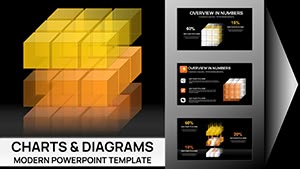
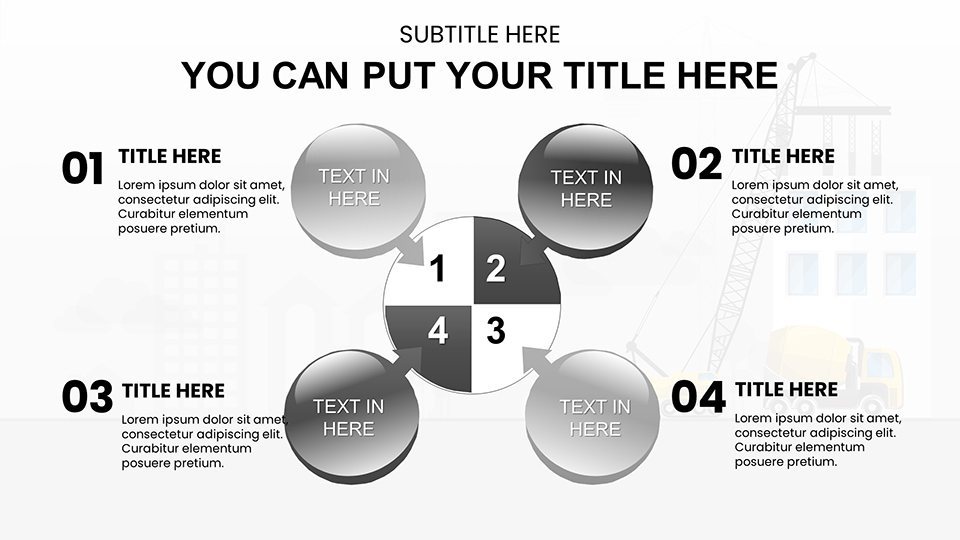
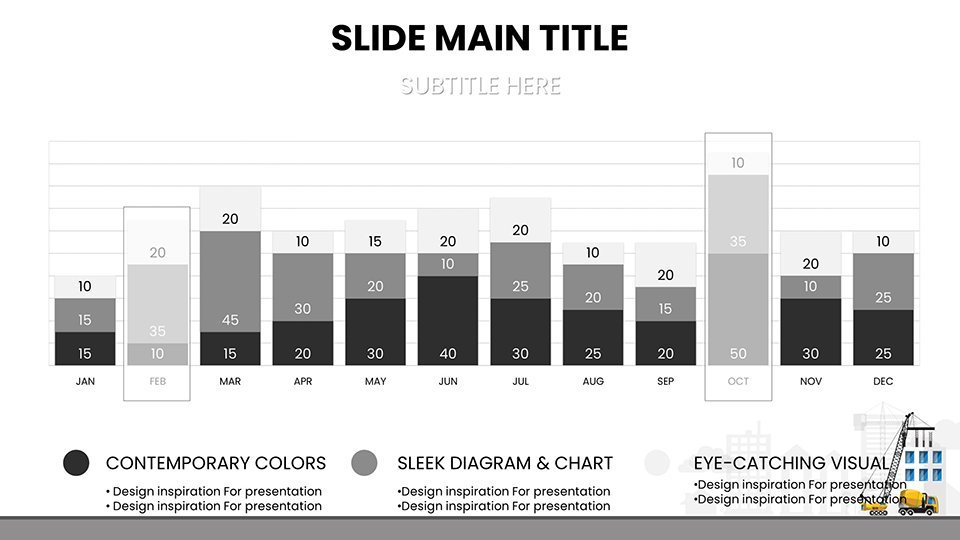
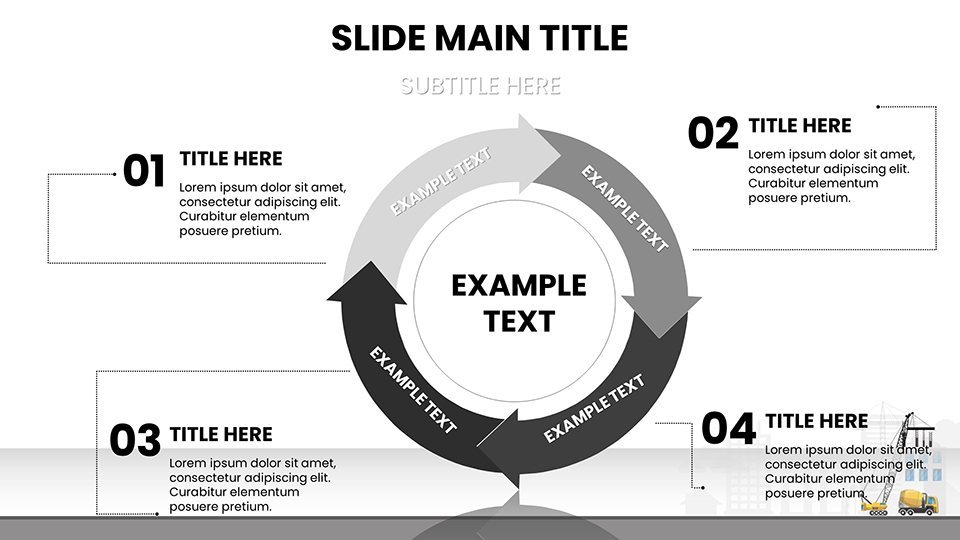
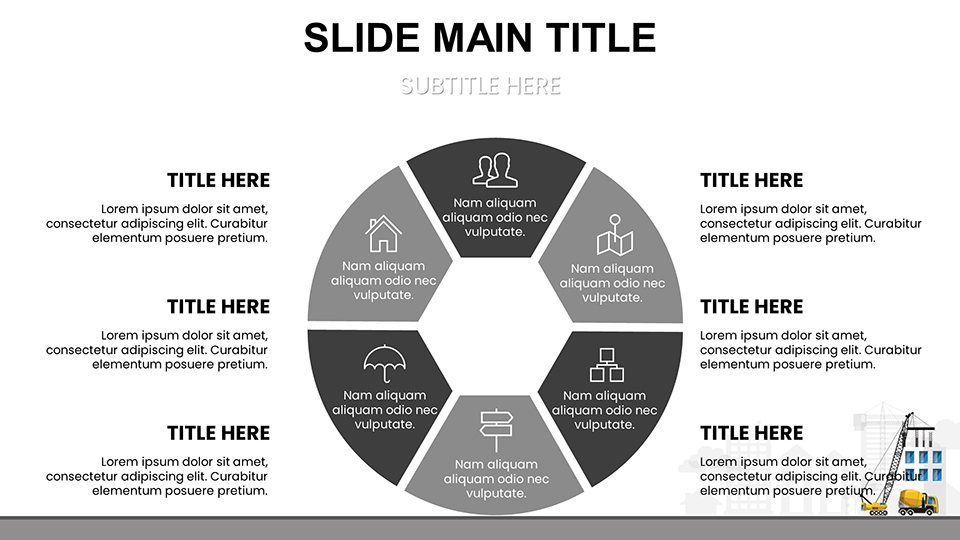
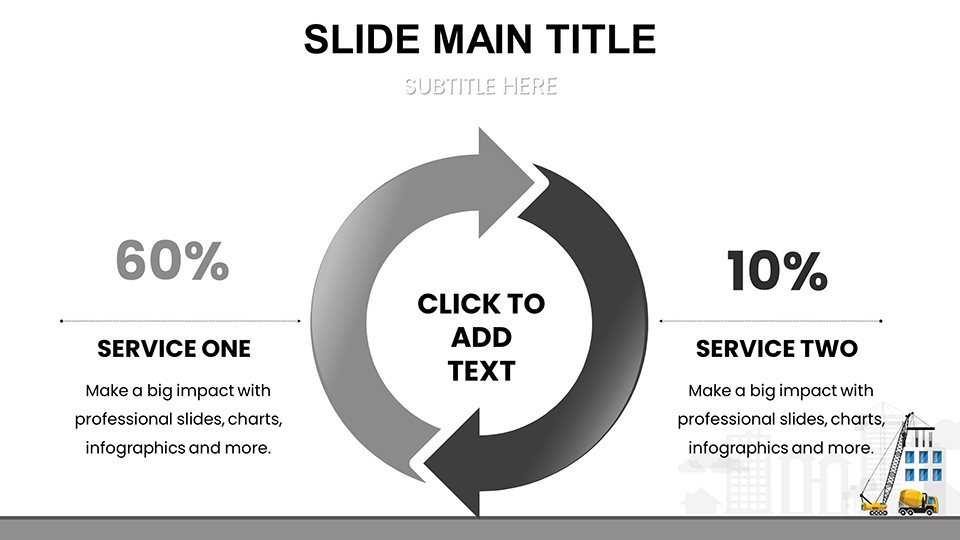
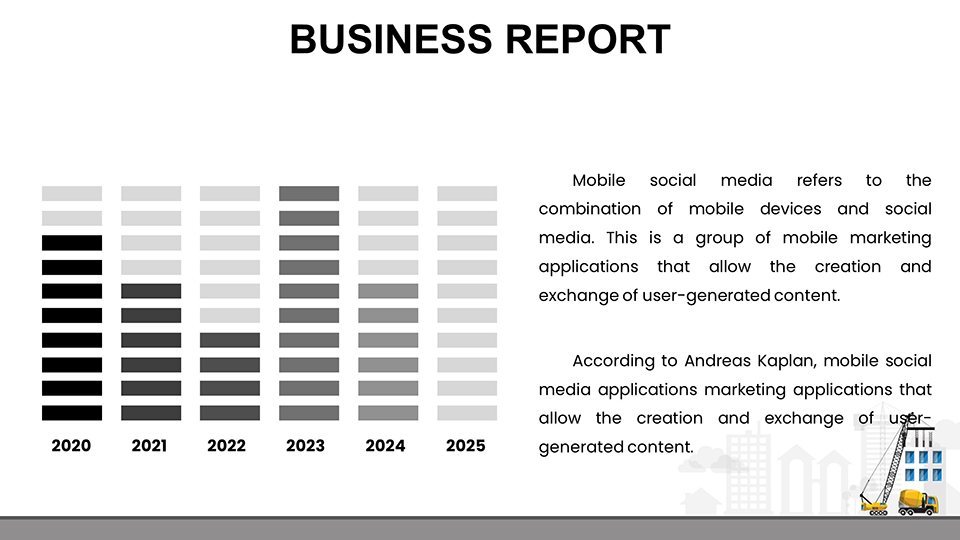
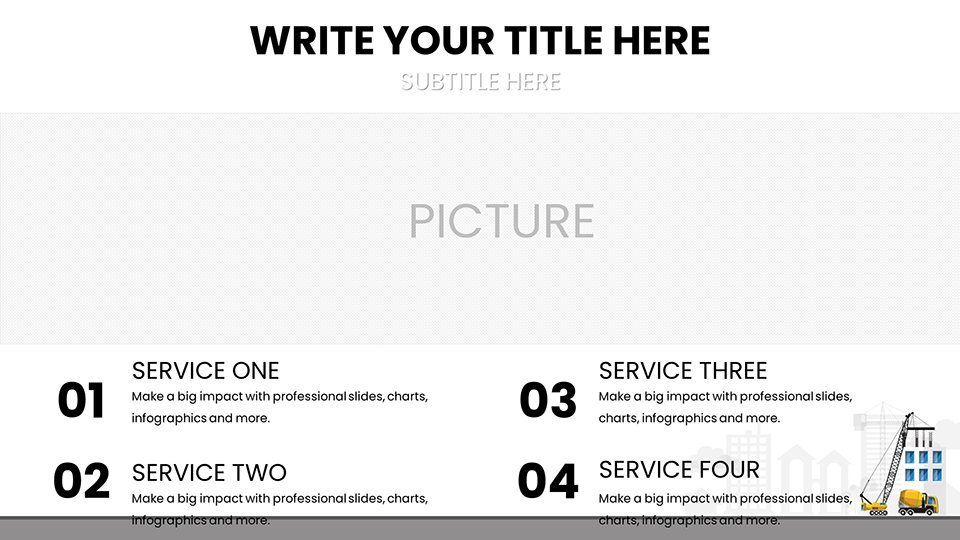
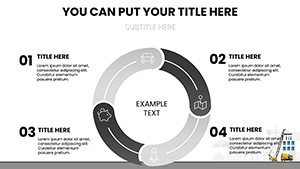
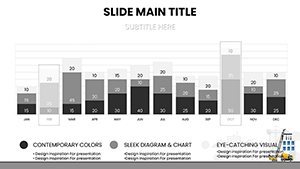
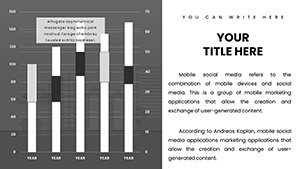
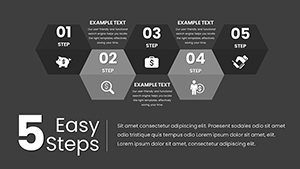
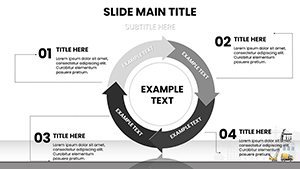
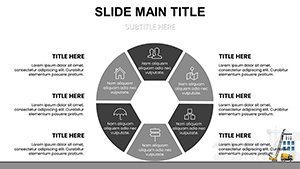
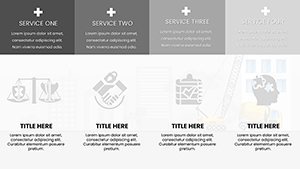
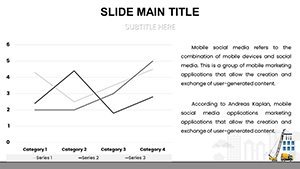
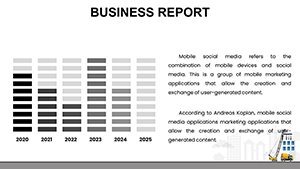
- Diverse Chart Options: Gantt for scheduling, pie for material distributions, and bar for budget variances.
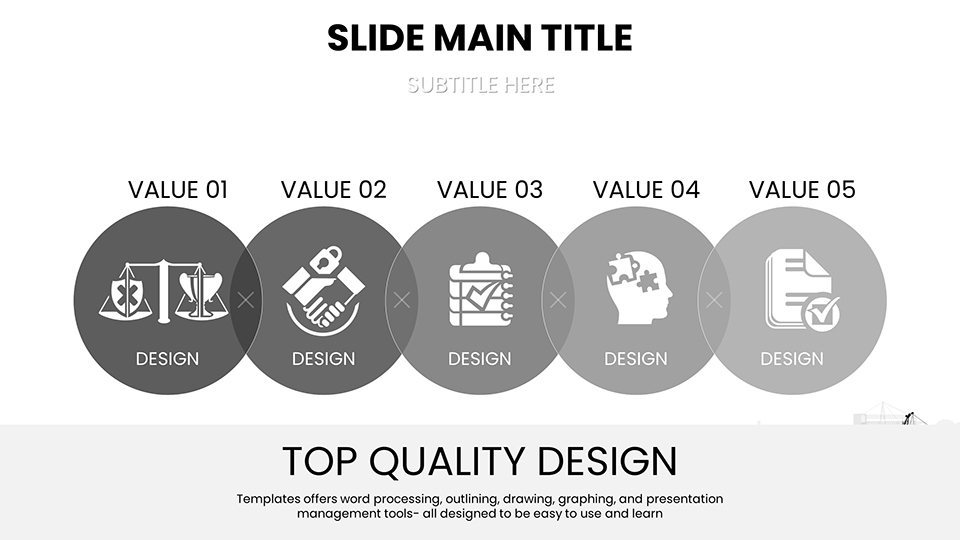
- Customization Freedom: Adapt layouts to project scales, incorporating earth tones for eco-friendly themes.
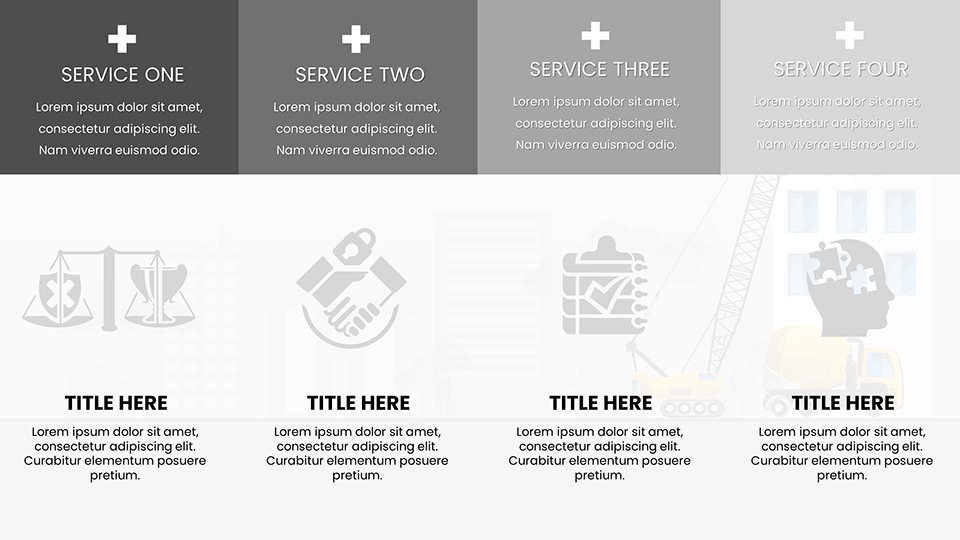
- Intuitive Interfaces: Drag-and-drop elements simplify complex data like subcontractor performance metrics.
- Compatibility Assurance: Works flawlessly in Keynote, with exports for broader team access.
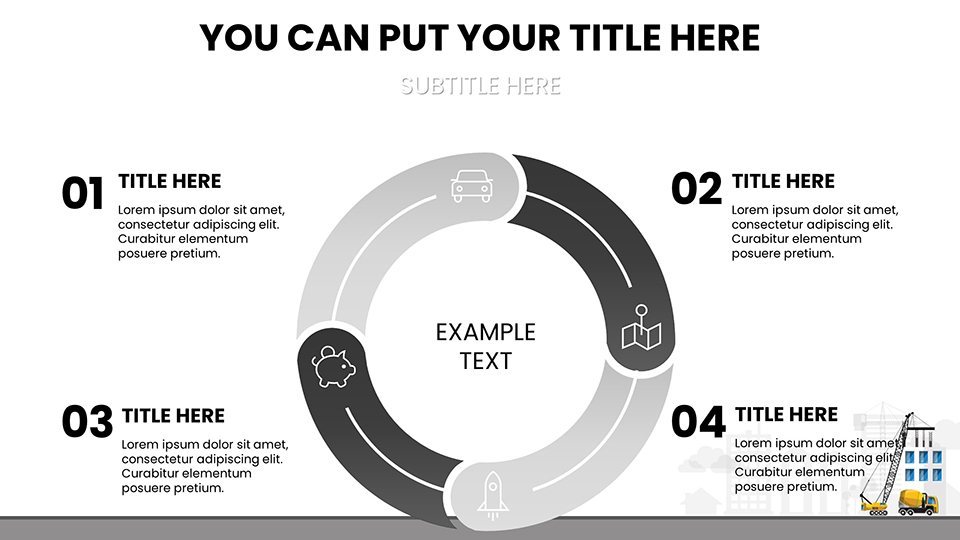
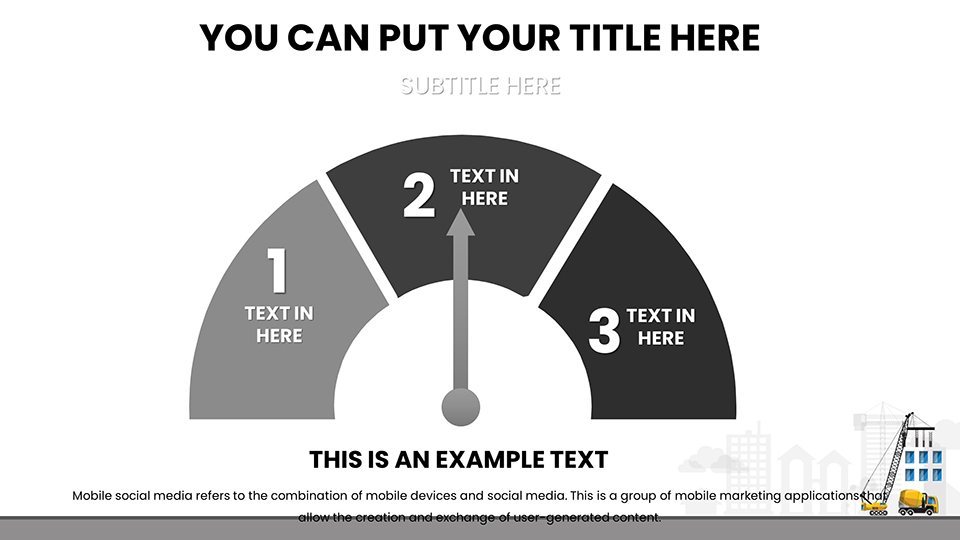
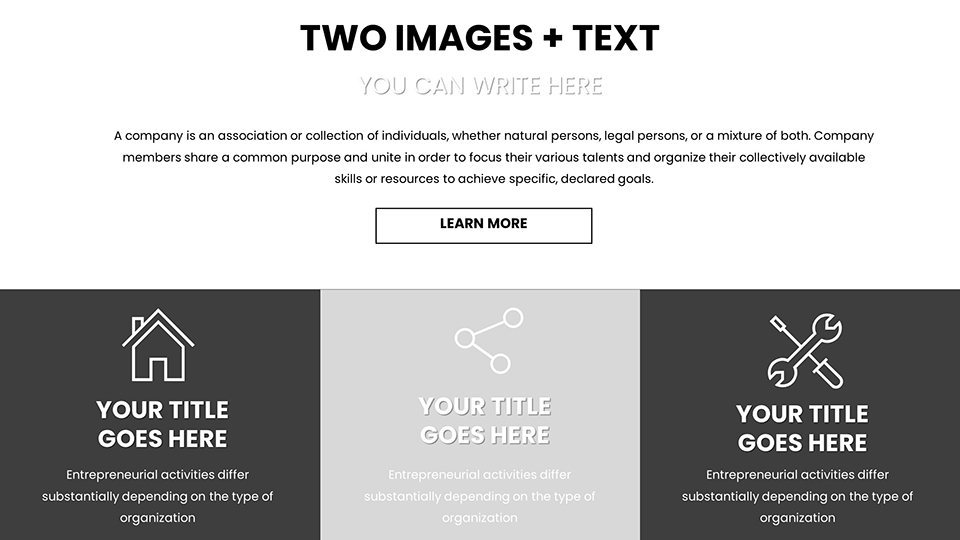
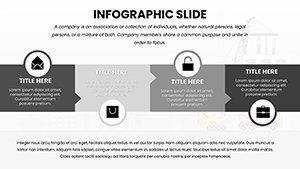
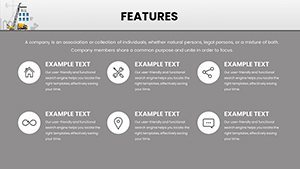
- High-Impact Visuals: Incorporate icons like hard hats and cranes for thematic relevance.
These features reflect insights from engineering pros, aligning with standards like those from the American Society of Civil Engineers (ASCE).
From Blueprints to Boardrooms: Versatile Applications
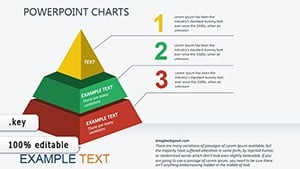
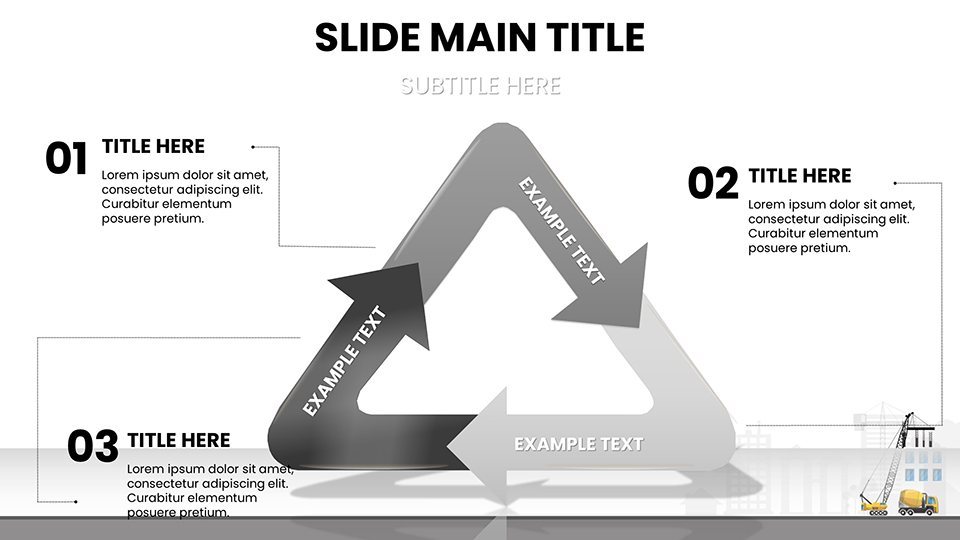
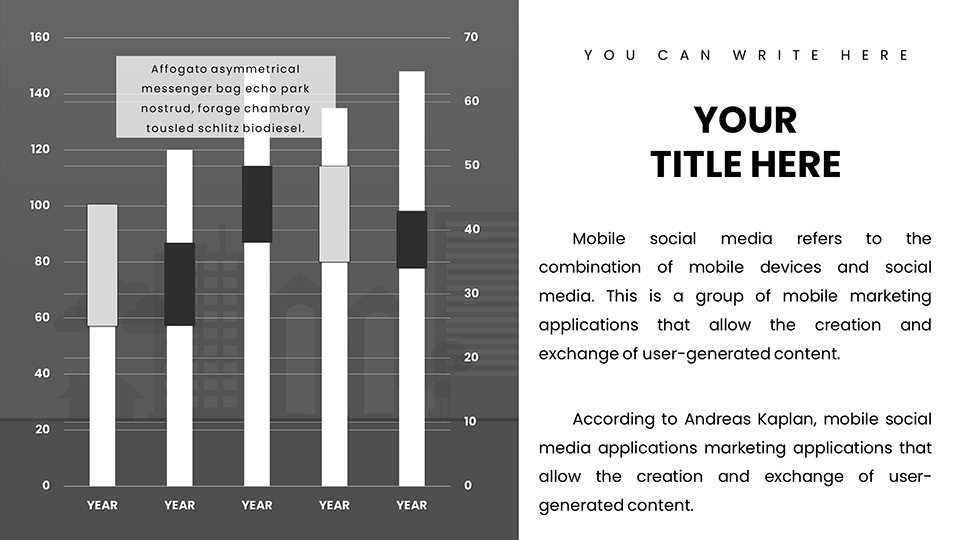
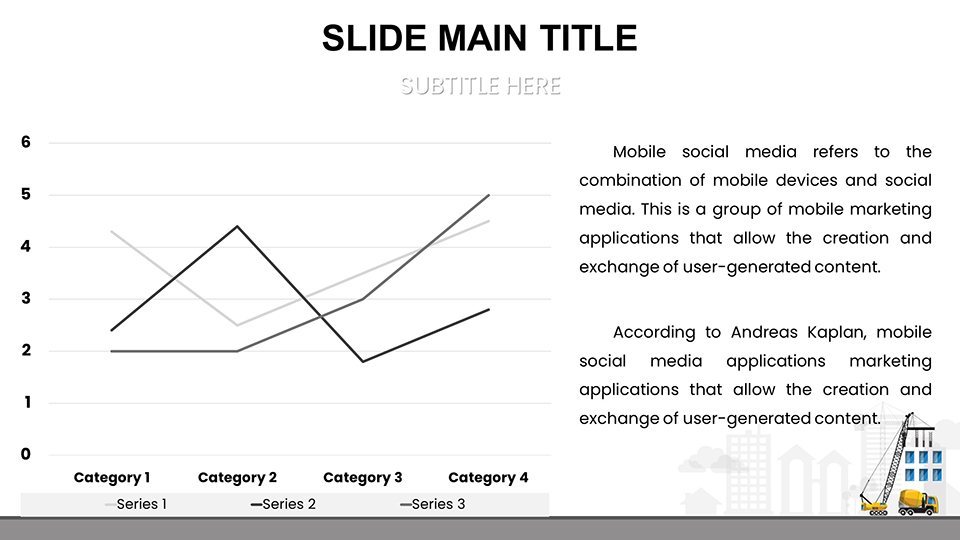
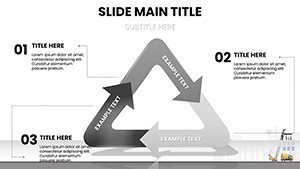
In practice, architects can use 3D pie charts to depict space utilization in designs, while project managers track milestones with progress bars, referencing real-world wins like efficient bridge constructions. For investor pitches, combine area charts with financial projections to showcase ROI, as seen in urban renewal projects.
Engineering teams benefit from scatter plots analyzing soil stability data, and stakeholders appreciate summary dashboards that consolidate risks and mitigations. The template shines in on-site briefings, where mobile-compatible slides facilitate quick updates, reducing miscommunications that plague 30% of construction delays.
Step-by-Step Customization for Project Mastery
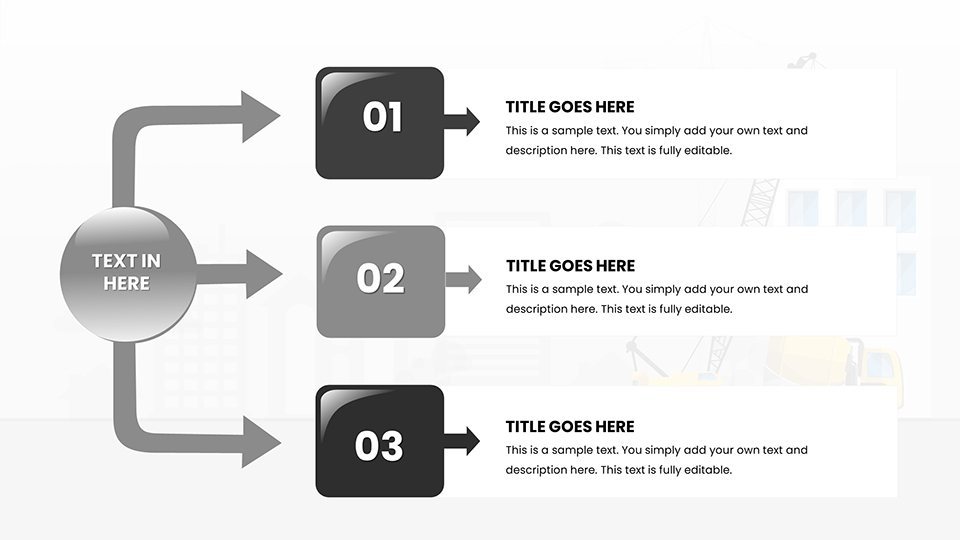
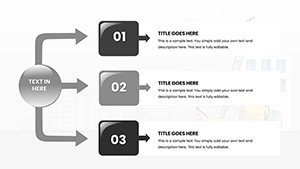
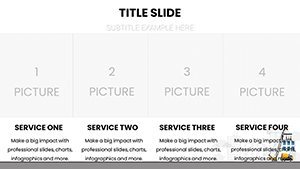
- Outline your structure: Start with a master slide for overall project overview.
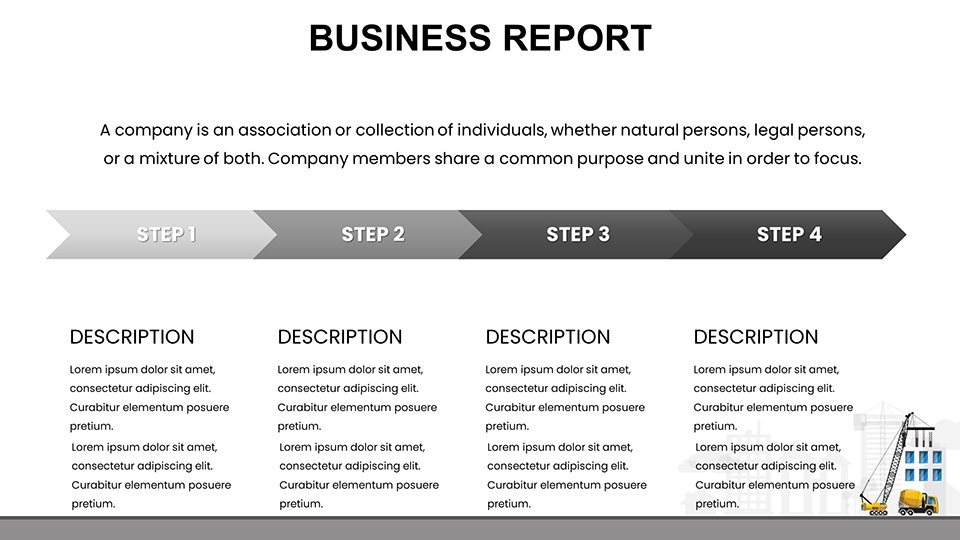
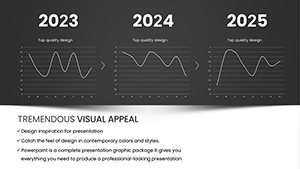
- Select appropriate visuals: Use timelines for phased developments.
- Input site-specific data: From BIM software exports for accuracy.
- Enhance with details: Add legends explaining acronyms like RFQ.
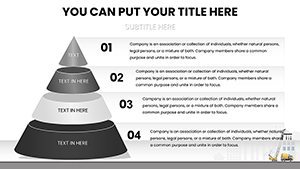
- Animate for emphasis: Reveal budget layers progressively.
- Polish and present: Ensure scalability for large screens in meetings.
This method integrates seamlessly with tools like AutoCAD, enhancing workflow efficiency.
Elevating Beyond Basic: Template Advantages
Surpassing default Keynote capabilities, this template provides ready-made, construction-optimized designs that cut prep time by half. With LSI integration like "project management visuals" and "architectural data graphs," it caters to search intents in the building sector. Authoritative elements, such as compliance icons, bolster , making your presentations credible resources.
Inclusivity features, like alt text suggestions for images, ensure accessibility, complying with ADA guidelines in construction communications.
Pro Tips for Construction Presentation Success
- Prioritize clarity: Use one focal chart per slide to spotlight key metrics like completion percentages.
- Incorporate real examples: Reference past projects to ground data in reality.
- Engage visually: Layer animations to simulate build progressions.
- Call for collaboration: Include interactive elements like feedback prompts.
- Refine iteratively: Post-meeting reviews to adapt for future bids.
Drawn from AIA-award-winning presentations, these strategies turn data into decisive action.
Embrace the Construction Companies Keynote Charts Template to construct not just buildings, but unbreakable project narratives. Start building your success - download and customize today.
Frequently Asked Questions
How flexible are the customization options?
Extremely - edit every aspect to match project specifics, from colors to data sources.
Is it optimized for large-scale projects?
Yes, with scalable charts handling complex datasets like multi-phase developments.
What chart types suit architecture best?
3D models and Gantt charts for visualizing designs and timelines effectively.
Can it integrate with construction software?
Supports data imports from tools like Procore for seamless updates.
How does it aid stakeholder communication?
By providing clear, visual insights that simplify technical jargon.