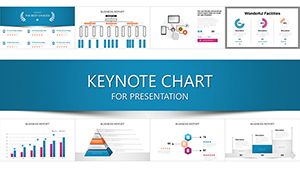
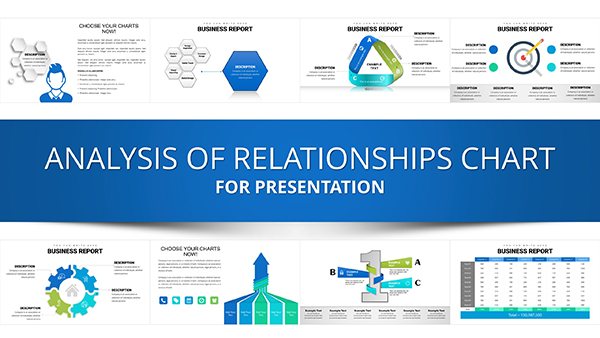
International Currency Exchange Keynote Charts


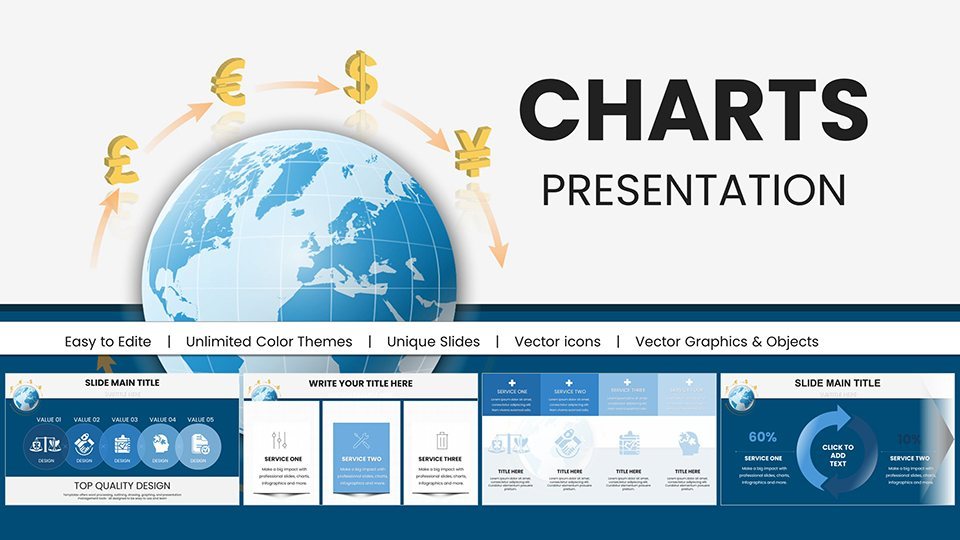


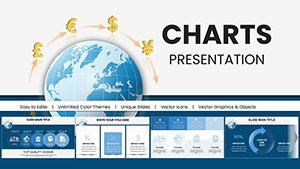
Navigating the intricate web of international currency exchange demands clarity amid volatility. Our International Currency Exchange Keynote Charts Presentation delivers exactly that with 59 editable slides, crafted to demystify forex trends and economic indicators for professionals worldwide. Whether you're a forex trader spotting arbitrage opportunities, a corporate executive hedging risks, or an academic dissecting monetary policies, this template equips you with visuals that cut through the noise. Envision a slide where a candlestick chart overlays currency pair movements with economic news annotations, revealing correlations that inform trades. Rooted in economic principles from bodies like the International Monetary Fund (IMF), these charts promote informed, data-backed strategies, allowing customization to fit emerging market analyses or G7 currency shifts.
Empowering Insights in a Global Financial Landscape
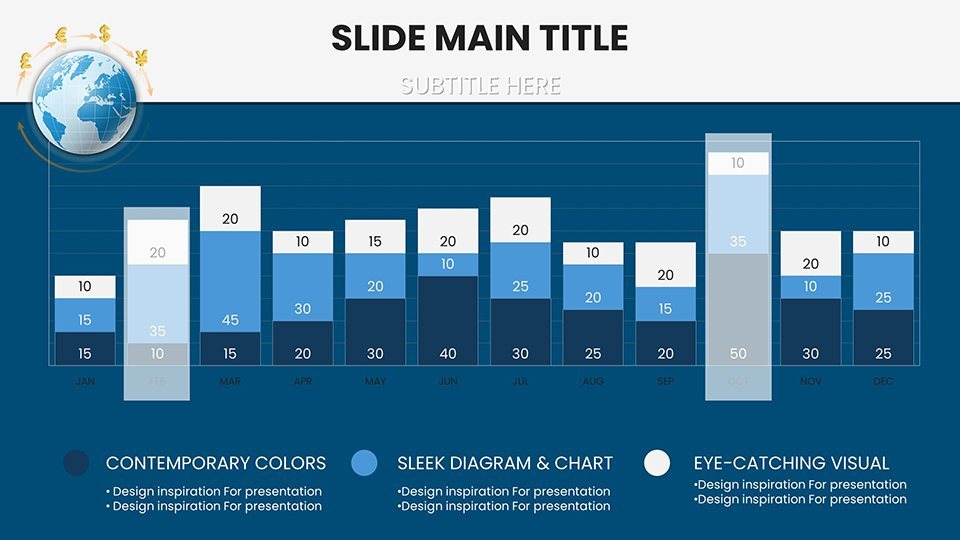
The global economy's pulse is best captured through precise visualizations, and this template excels at that. It enables you to present intricate data - like exchange rate volatilities or balance of payments - with elegance, using tools that highlight patterns often missed in spreadsheets. For instance, deploy area charts to show cumulative trade deficits over quarters, annotated with events like Brexit impacts for contextual depth. Benefits include sharper decision-making; by visualizing scenarios, you anticipate shifts, such as currency devaluations in developing economies. Aligning with IMF's transparency standards, the editable features ensure your presentations maintain integrity, fostering trust in boardrooms or classrooms alike.
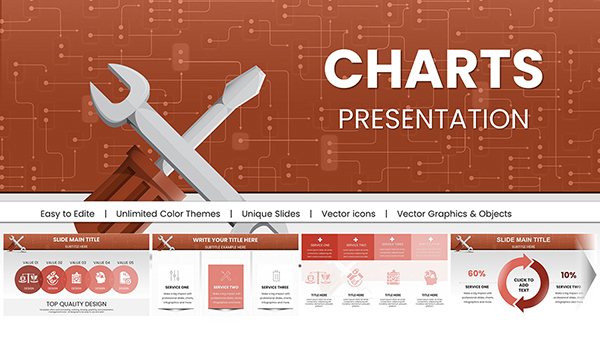
Core Features for Financial Precision
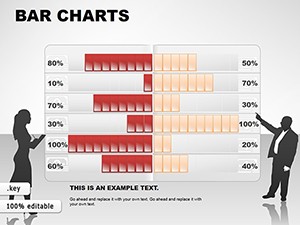
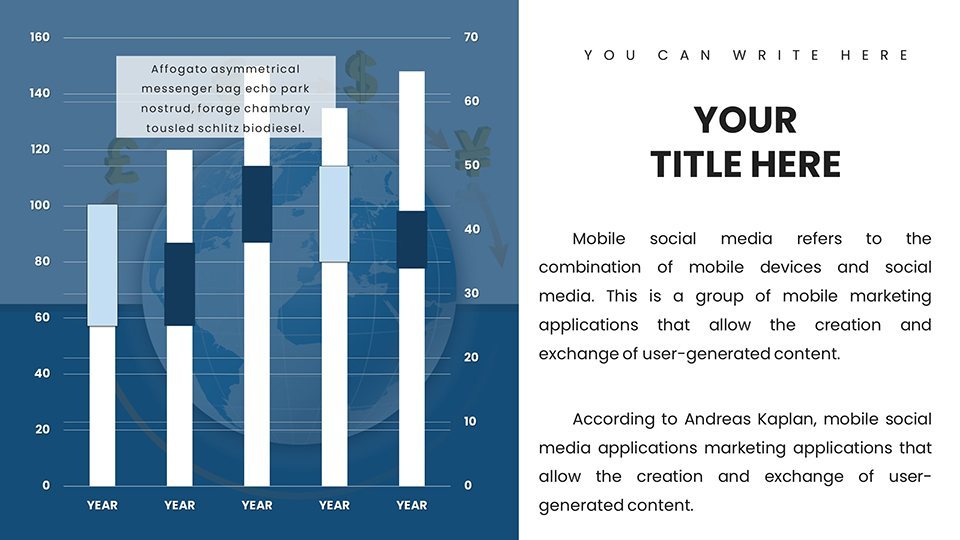
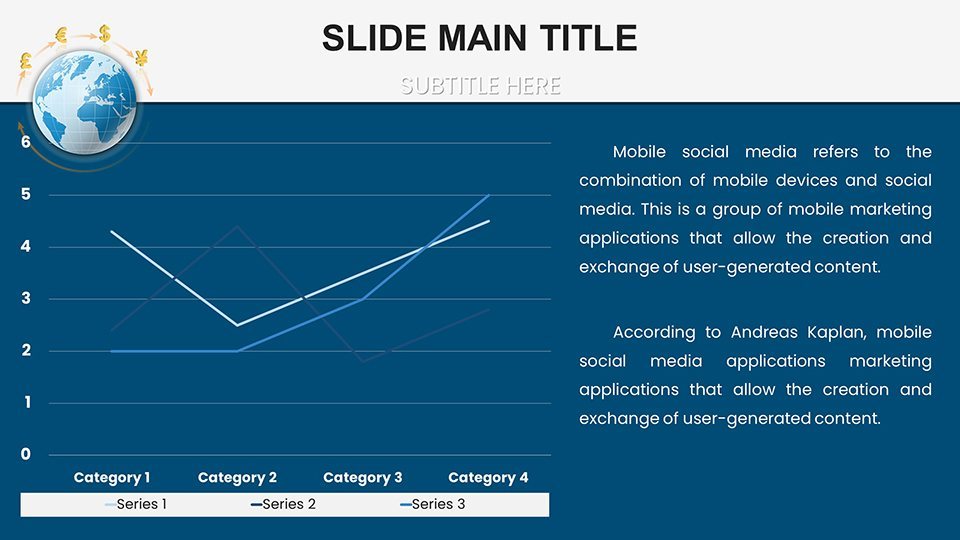
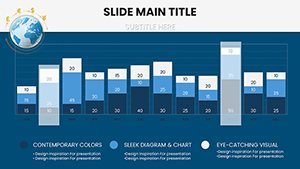
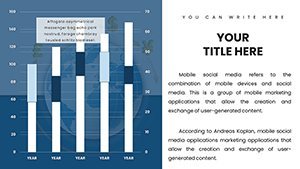
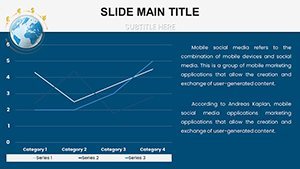
- Advanced Chart Types: Candlestick for price actions, line graphs for long-term trends, and pivot tables for multi-currency comparisons, all with built-in formulas.
- Real-Time Adaptability: Integrate live data feeds or APIs, customizing axes for logarithmic scales in high-volatility pairs like USD/JPY.
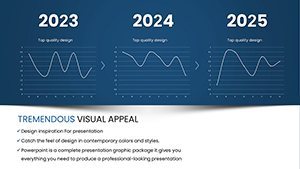
- Forecasting Elements: Include regression lines and scenario sliders to project future rates based on interest differentials.
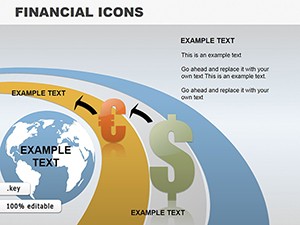
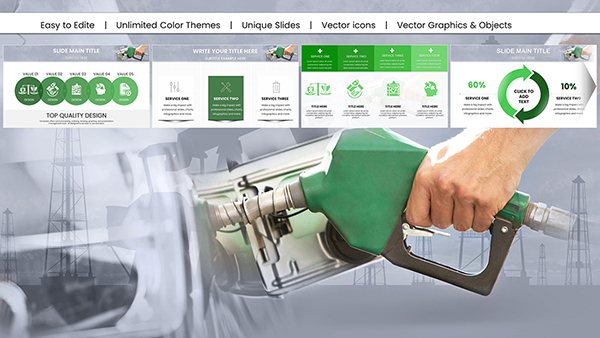
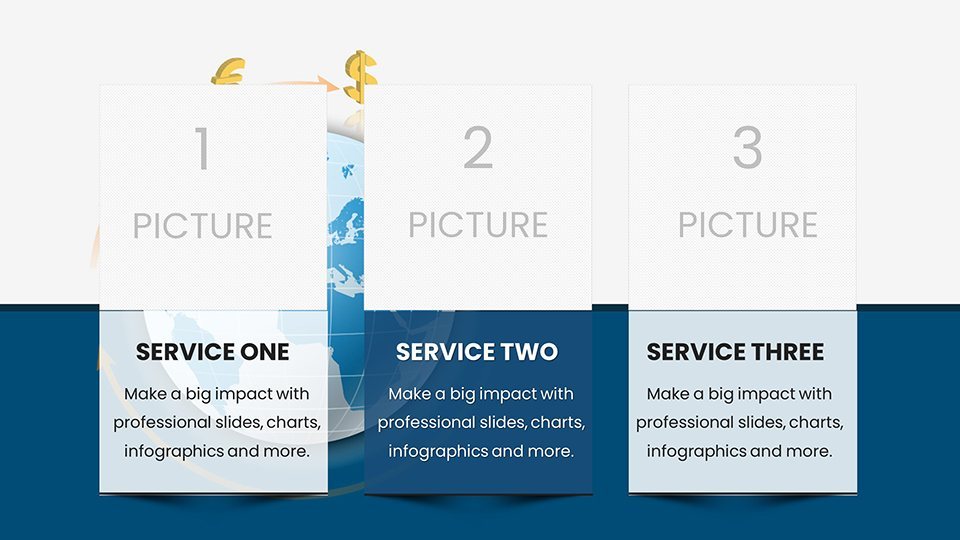
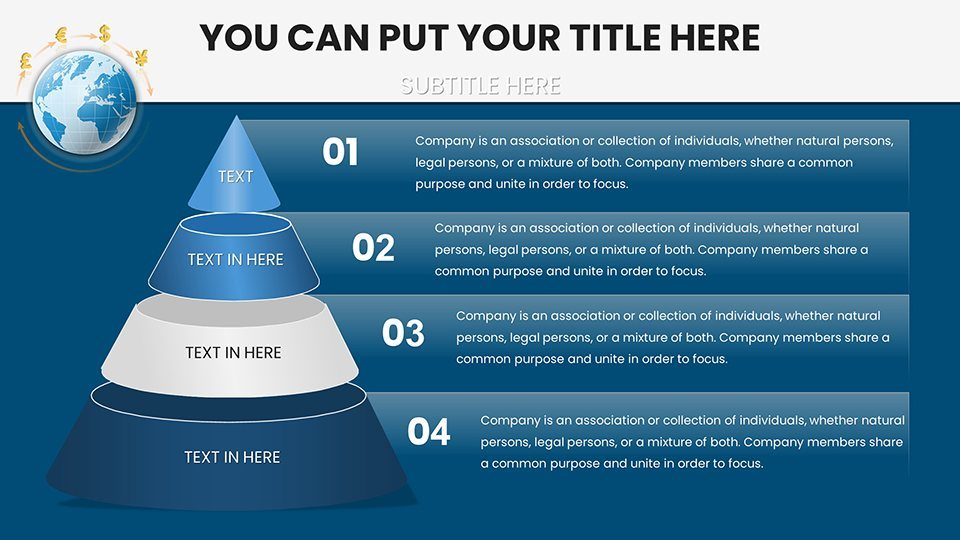
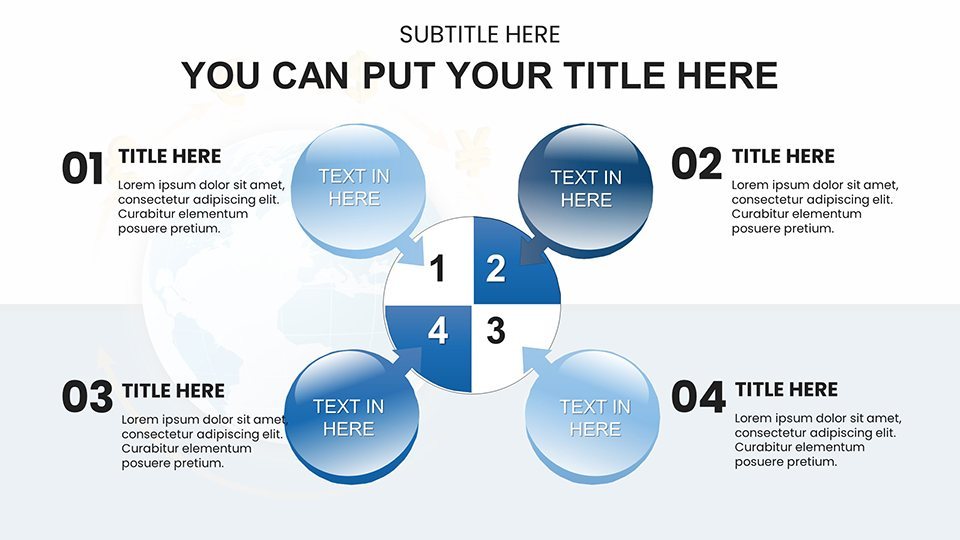
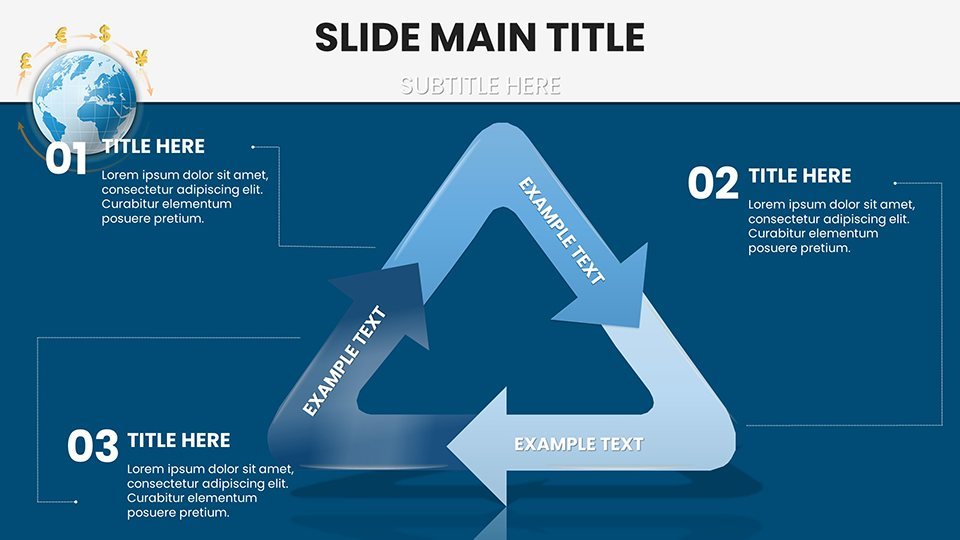
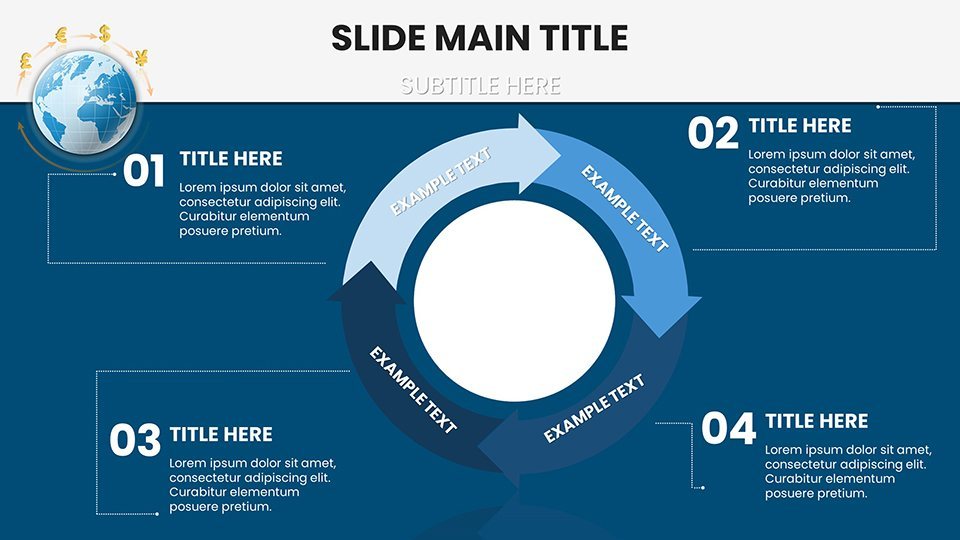
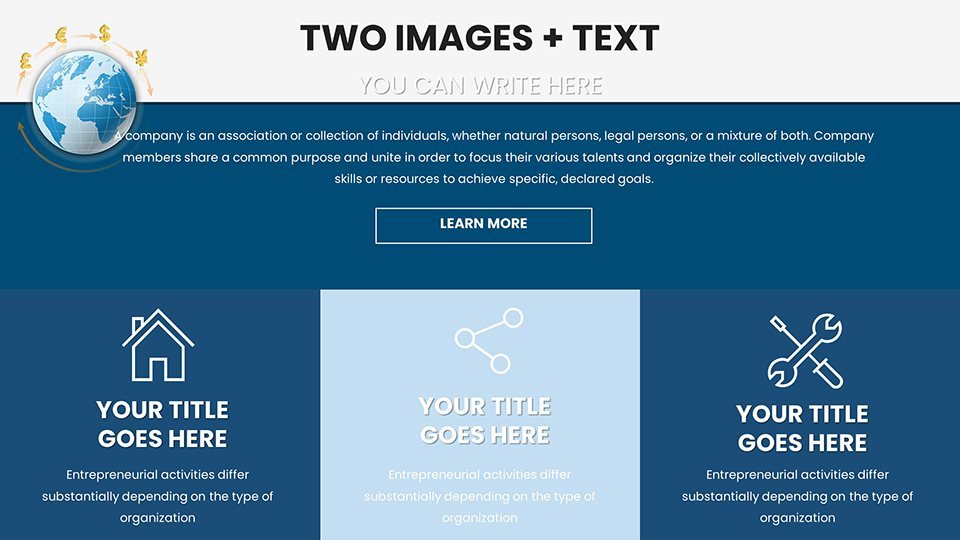
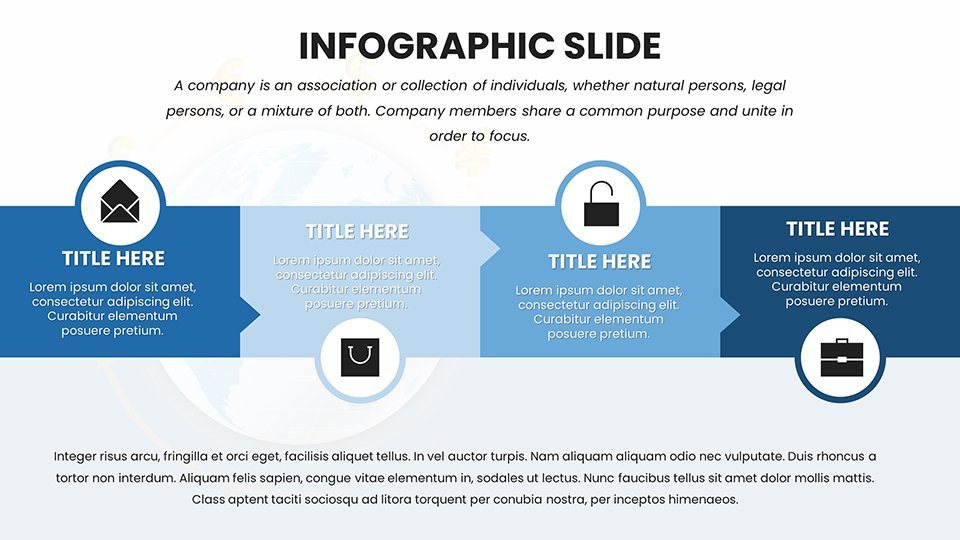
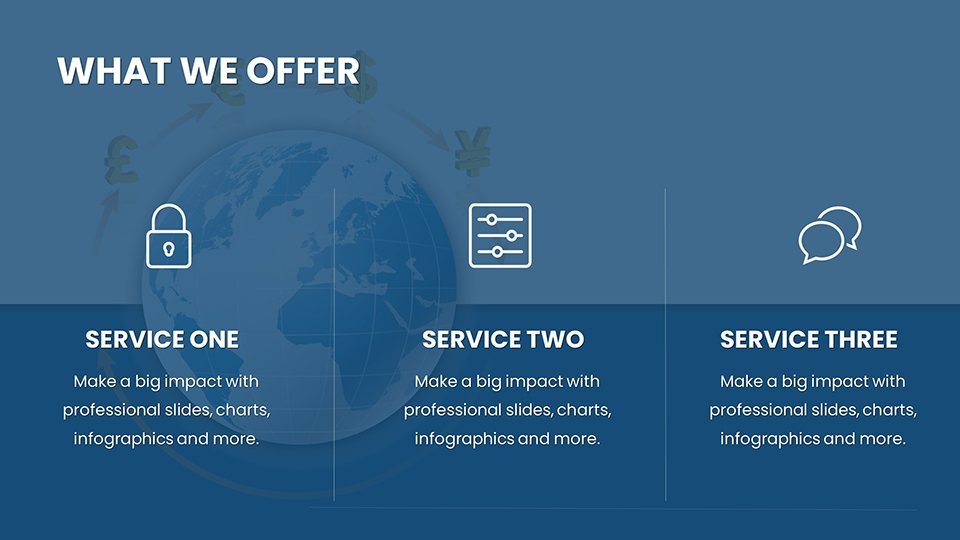
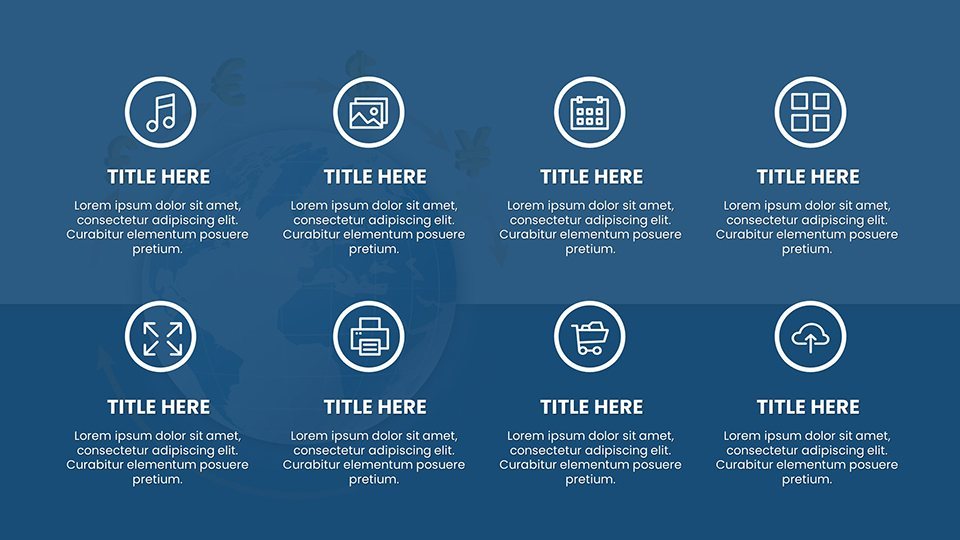
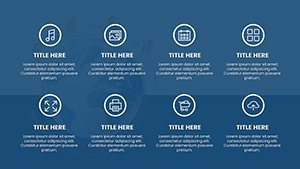
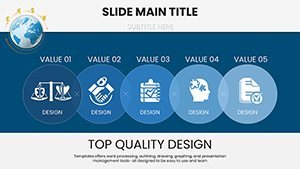
- Thematic Icons: Currency symbols, globes, and trend arrows to visually reinforce global interconnectivity.
These capabilities make the template a step above standard Keynote offerings, providing specialized tools for finance pros.
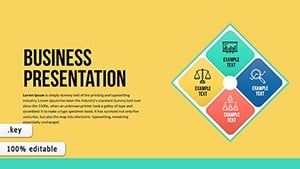
Targeted Applications Across Finance Sectors
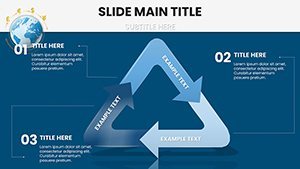
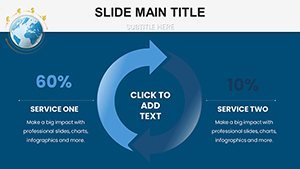
Versatility defines this template's value, suiting varied financial contexts. Financial analysts can craft reports on emerging market currencies, using heat maps to pinpoint inflation hotspots, drawing from IMF case studies on Argentina's peso fluctuations. Multinational corporations benefit from risk assessment slides, like matrix charts evaluating exposure to EUR/USD swings amid trade wars. Forex traders might utilize dashboard summaries for quick scans of RSI indicators and moving averages, enabling rapid strategy adjustments. Business students can explore theoretical models, such as purchasing power parity, through interactive slides that simulate exchange rate equilibria. A compelling example: A hedge fund in London employed similar customizable charts to navigate the 2022 energy crisis's impact on RUB/USD, securing profits by visualizing supply chain disruptions aligned with economic forecasts from the World Bank.
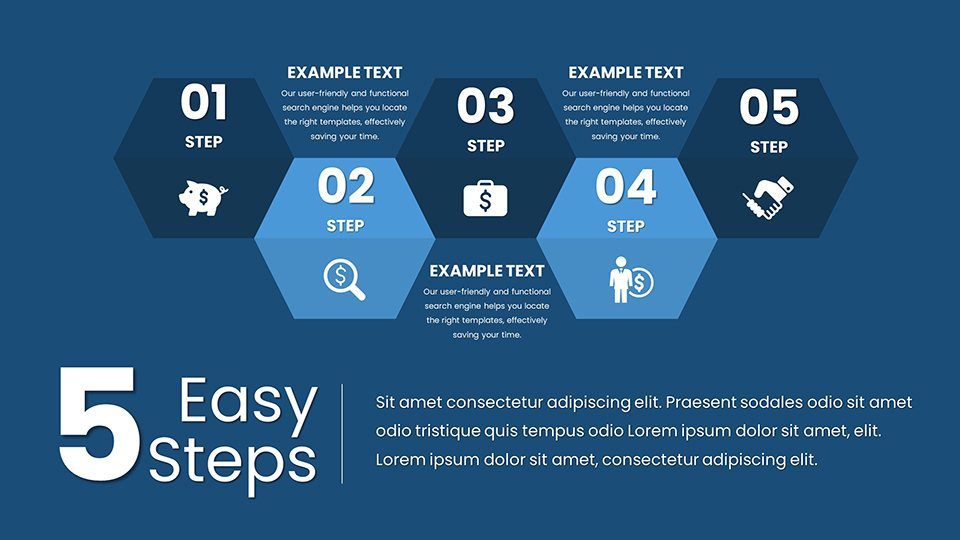
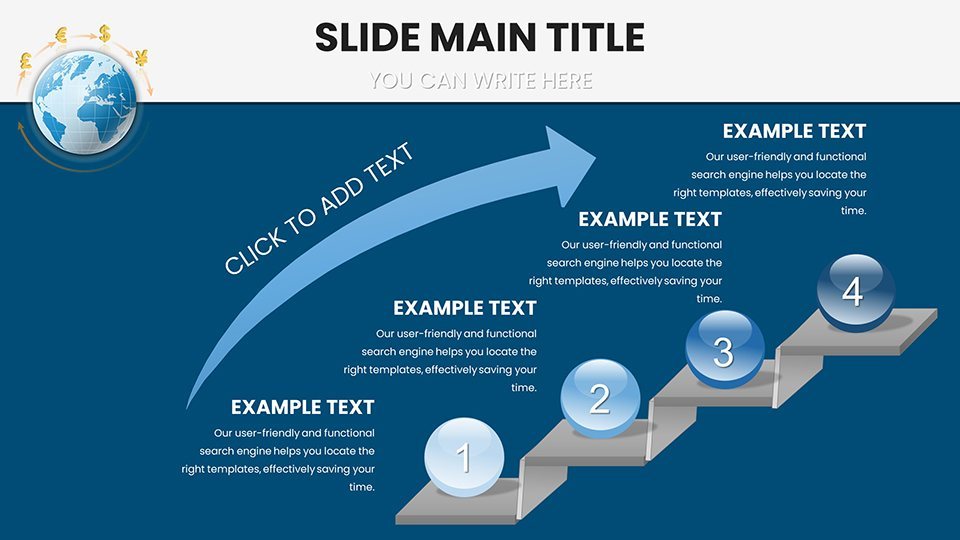
Step-by-Step Guide to Financial Storytelling
- Compile Data: Source from Bloomberg or ECB reports for accuracy.
- Choose Slides: Select from 59, e.g., waterfall charts for breaking down carry trade profits.
- Personalize: Adjust for your focus, like adding volatility indexes for crypto-fiat comparisons.
- Incorporate Analysis: Use annotations to explain anomalies, such as central bank interventions.
- Present Strategically: Build narratives that lead to actionable insights, like buy/sell recommendations.
This process enhances efficiency, turning hours of analysis into minutes of preparation compared to ad-hoc designs.
Expert Strategies for Mastering Currency Presentations
Amplify your edge with proven techniques from financial experts. Employ Elliott Wave theory in wave charts to forecast cycles, adding layers of sophistication. Keep slides focused - limit to three key metrics per view, like spot rates, forwards, and options premiums. For authoritativeness, reference IMF working papers on exchange rate regimes to substantiate claims. Inject subtle wit: "Don't let currency fluctuations catch you off-guard - chart your course with precision." Unlike basic templates, this one integrates finance-specific metrics, avoiding irrelevant fluff. Ensure compliance with accessibility norms, using color-blind friendly palettes for global audiences. Simulate scenarios on mobile Keynote for on-the-go trading reviews.
Further, collaborate by sharing editable versions with teams, facilitating real-time updates during market events. A pro insight: Layer macroeconomic overlays, like GDP growth correlations, to enrich micro-level currency analyses.
Your Gateway to Financial Foresight
This International Currency Exchange Keynote Charts template, with its 59 slides, is more than visuals - it's a conduit for strategic acumen in turbulent markets. Trusted by analysts who've weathered crises like the Eurozone debt saga, it delivers clarity that drives success.
Seize market opportunities - download and tailor this template to your financial narrative right away.
Frequently Asked Questions
How do I integrate real-time data?
Easily link to APIs or import from Excel for live updates in charts.
Are forecasting tools included?
Yes, with built-in trend lines and scenario builders for projections.
Can it handle multiple currencies?
Absolutely, supporting cross-pair analyses and custom baskets.
What format is the file?
.key, optimized for Keynote compatibility.
Is it suitable for academic use?
Yes, with slides for theoretical models and case studies.