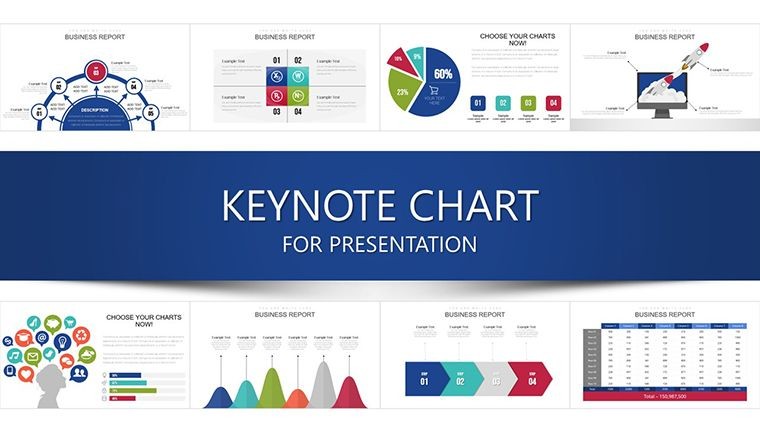
Business Startup Keynote Charts: 30 Editable Slides


Type: Keynote Charts template
Category: Analysis
Sources Available: .key
Product ID: KC00930
Template incl.: 30 editable slides
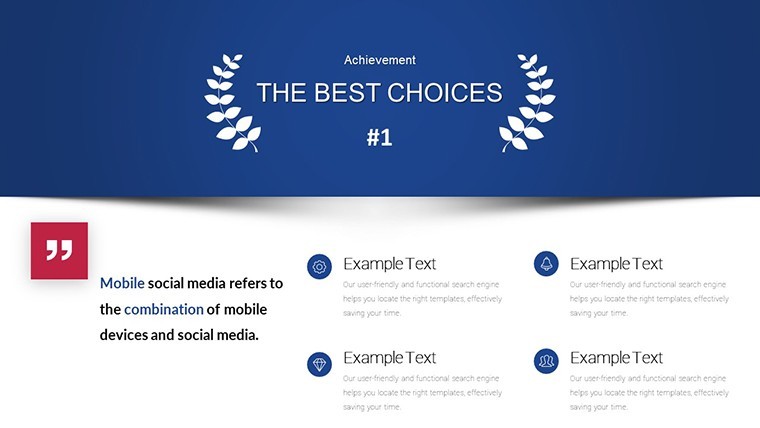
Launching a startup is an exhilarating journey, filled with innovative ideas and high-stakes opportunities. But when it comes to securing that crucial funding, your presentation can make or break your success. Enter the Business Startup Keynote Charts Template-a meticulously crafted collection of 30 editable slides that transform complex data into compelling visuals, helping you communicate your vision with precision and persuasion.
This template is more than a set of charts; it`s a strategic toolkit designed for entrepreneurs who need to stand out in a competitive landscape. Drawing from proven design principles used by top accelerators, it ensures your pitch deck resonates with investors, partners, and stakeholders. Compatible with Keynote on Mac, iPad, and iPhone, it offers seamless editing for quick customizations, allowing you to focus on your story rather than the mechanics. With vector-based graphics and responsive layouts, your slides will look sharp whether presented in a boardroom or shared via video call.
Imagine walking into a venture capital meeting, your deck open to a dynamic market research dashboard that instantly reveals untapped opportunities. Or projecting financial forecasts that not only show growth but also anticipate risks, building trust through transparency. This template empowers you to do just that, backed by insights from industry reports like those from CB Insights, which highlight how clear communication can mitigate the 90% failure rate of startups due to misaligned messaging. Ready to elevate your presentations? Start customizing this template today and turn your startup dreams into funded realities.
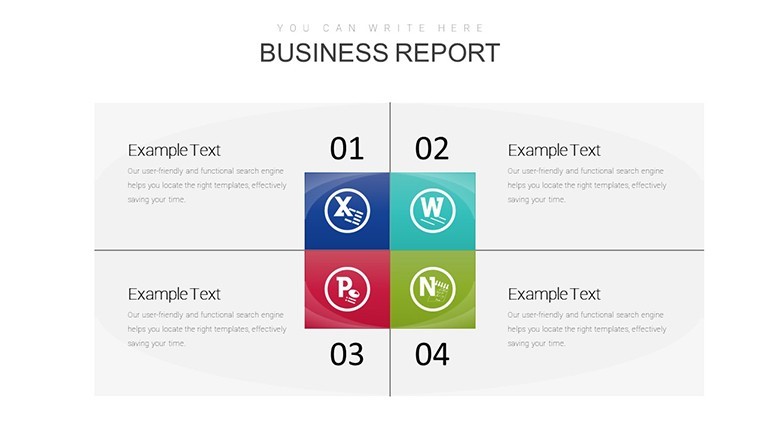
Key Features of the Business Startup Keynote Charts Template
At the heart of this template are 30 fully editable slides, each optimized for Keynote`s intuitive interface. We`ve prioritized functionality alongside aesthetics, incorporating subtle animations, high-contrast colors for accessibility, and scalable elements that maintain quality at any resolution. Whether you`re a first-time founder or a serial entrepreneur, these features streamline your workflow and amplify your message.
- Full Editability: Drag-and-drop data inputs, color schemes matching your brand, and resizeable icons- no locked layers to frustrate your creative flow.
- Apple Ecosystem Integration: Native .key files ensure smooth performance on Mac, iPad, and iPhone, with easy exports to PDF or even PowerPoint for broader compatibility.
- Vector Graphics and Animations: Crisp 4K-ready visuals with build-in transitions that reveal data progressively, keeping audiences engaged without overwhelming them.
- Built-in Speaker Notes: Pre-populated prompts under each slide guide your narration, turning data dumps into storytelling sessions.
- Lifetime Access: One-time purchase grants unlimited use, plus free updates to align with evolving Keynote versions and design trends.
These elements aren`t arbitrary; they`re informed by collaboration with design professionals from organizations like AIGA, ensuring your deck adheres to universal best practices for visual communication. In 2025, as remote pitching becomes the norm, this template`s responsive design gives you an edge, adapting flawlessly to screens big and small.
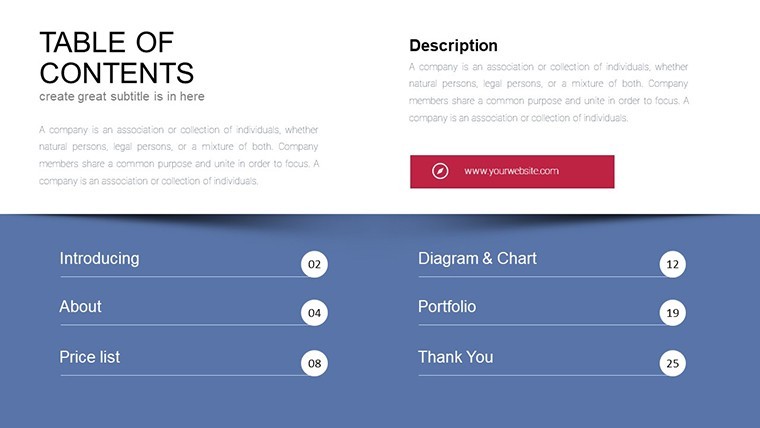
Detailed Breakdown of the 30 Editable Slides
Every slide in this template serves a purpose, organized into thematic sections that mirror a startup`s lifecycle. From initial research to final calls-to-action, the progression builds a narrative arc that keeps viewers hooked. Here`s a closer look at what you`ll find:
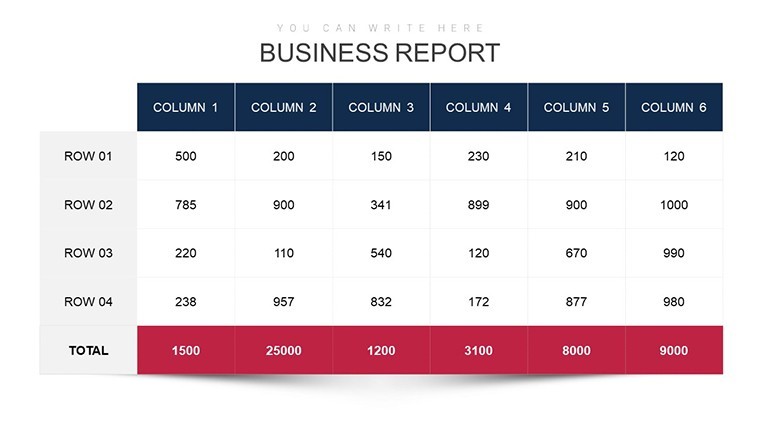
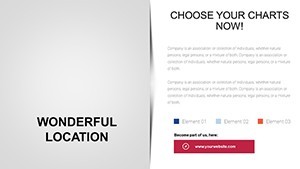
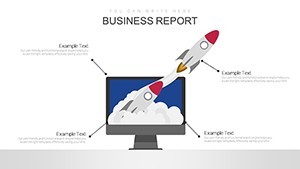
Market Research Dashboard (Slides 1-5)
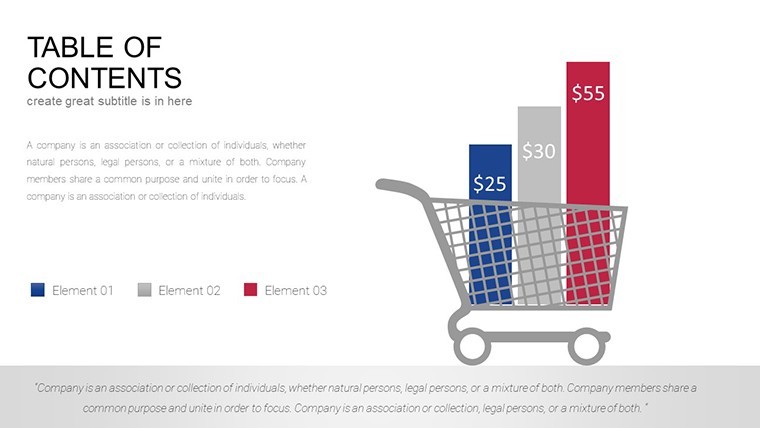
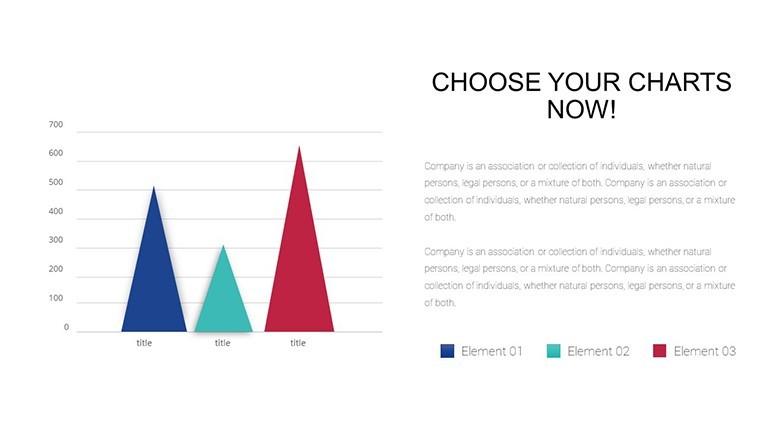
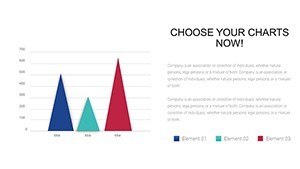
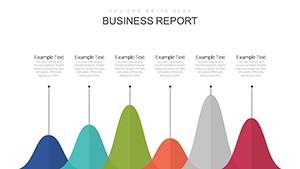
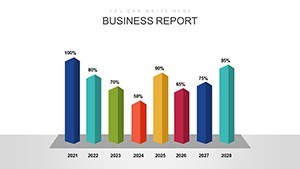
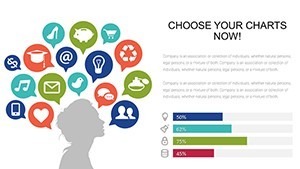
Kick off your pitch with slides that ground your idea in real-world data. These feature interactive bar charts dissecting consumer demographics-think customizable segments for age, income, or geography. Pull in stats from sources like Google Analytics to highlight gaps your product fills, such as the 25% rise in demand for sustainable tech reported by Statista in 2024.
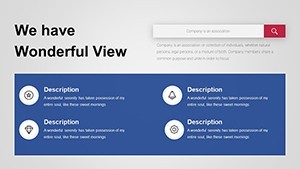
Slide 1 introduces an overview infographic, blending pie charts with icons for quick-scan insights. Slides 2-4 dive into specifics: horizontal bars for trend comparisons, while Slide 5 uses a heatmap to visualize regional opportunities. Edit effortlessly to reflect your niche, ensuring your audience grasps the market`s potential in seconds.
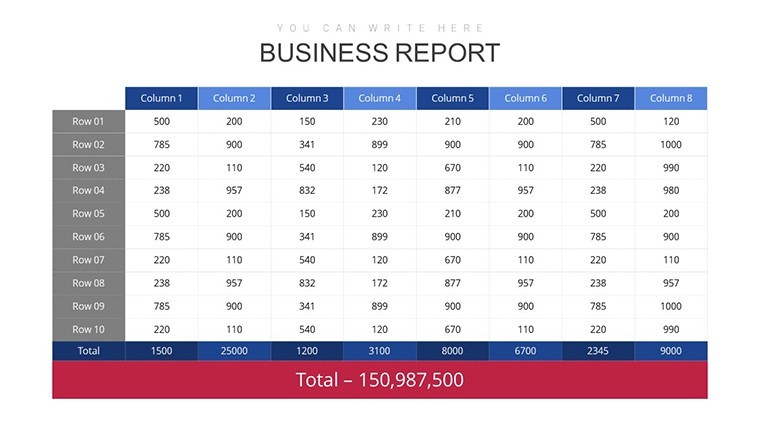
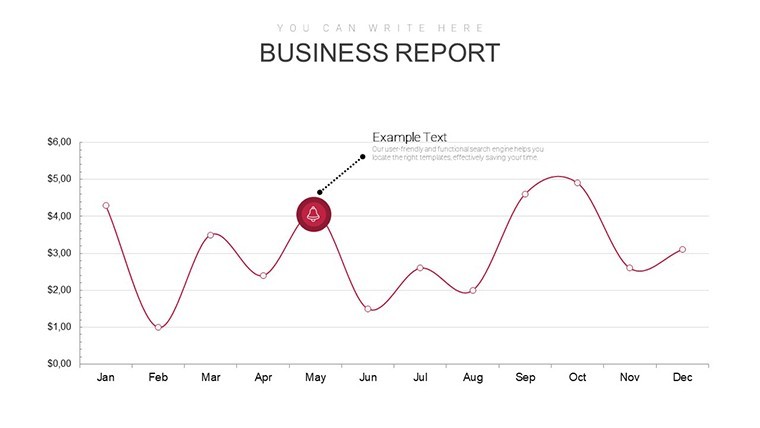
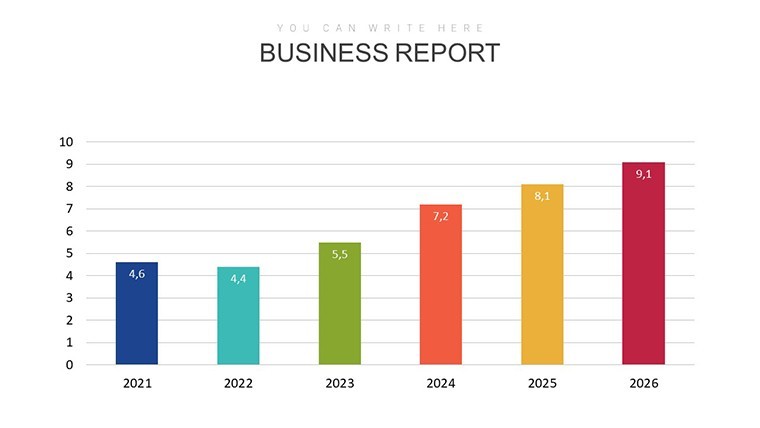
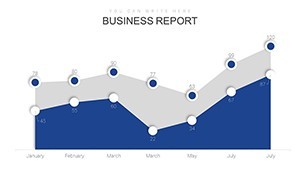
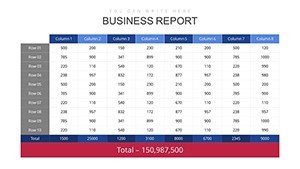
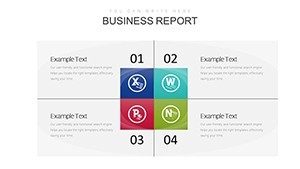
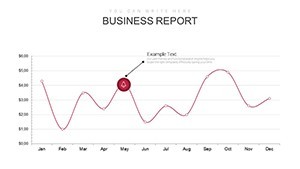
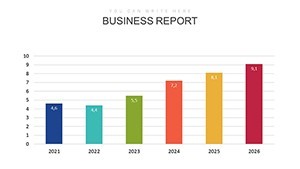
Financial Forecasting Suite (Slides 6-12)
Numbers tell your growth story, and these slides make them sing. Line graphs track revenue over three years, with stacked areas breaking down streams like subscriptions versus one-time sales. Built-in formulas allow sensitivity analysis-tweak acquisition costs and watch projections adjust live, demonstrating foresight that impresses investors.
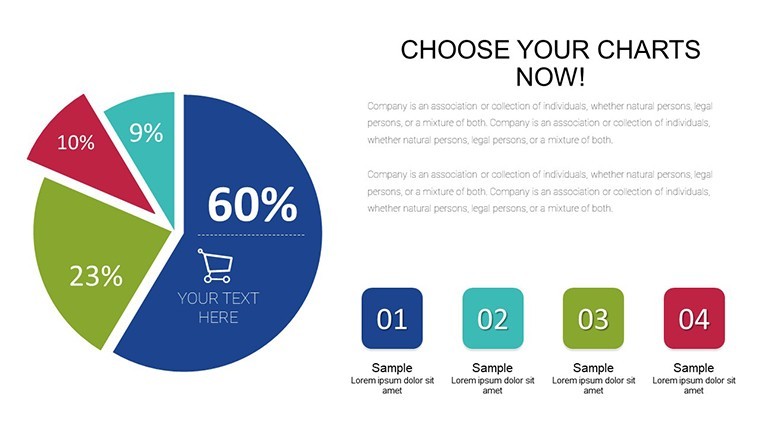
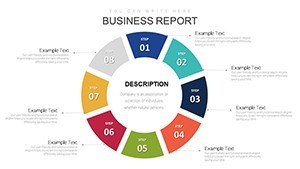
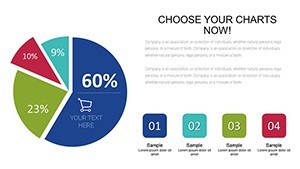
Slides 6-8 focus on core forecasts, including break-even points via simple curves. Slides 9-11 add depth with donut charts for expense allocation, and Slide 12 caps it with a scenario matrix comparing optimistic and conservative outlooks. This suite isn`t static; it`s a dynamic tool for "what-if" discussions, vital in an era where 70% of VCs prioritize financial realism per PitchBook data.
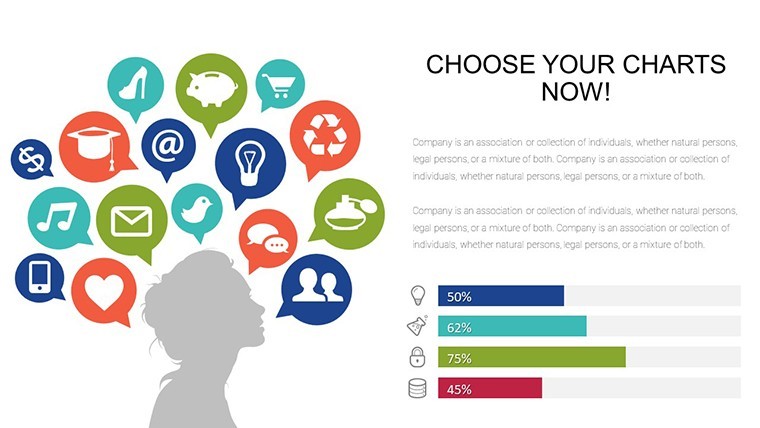
Competitive Analysis Matrix (Slides 13-18)
Show how you outmaneuver rivals with radar charts plotting strengths across axes like innovation and pricing. SWOT infographics on Slides 13-15 use editable quadrants to map threats and opportunities, symbolized by intuitive icons-a shield for defenses, a lightning bolt for disruptions.
Slides 16-18 expand to Venn diagrams for overlap analysis and bubble charts sizing competitors by market share. Customize to spotlight your unique value, like superior user experience in a crowded app space, turning potential weaknesses into strategic talking points.
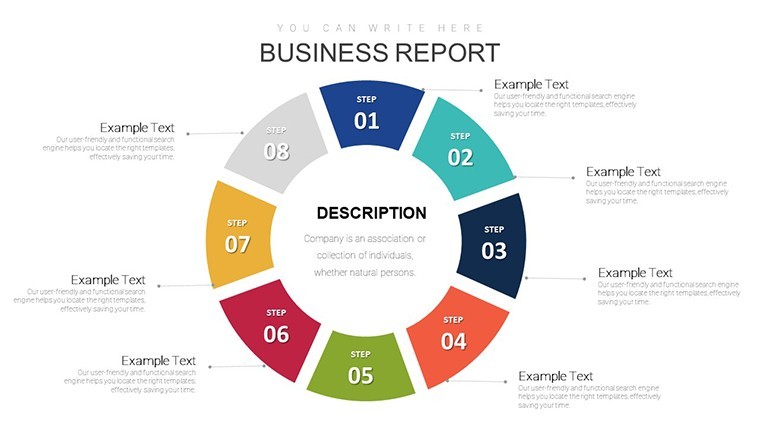
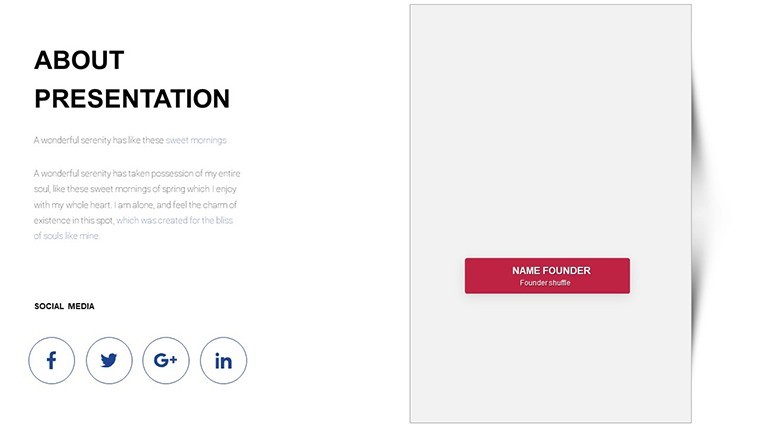
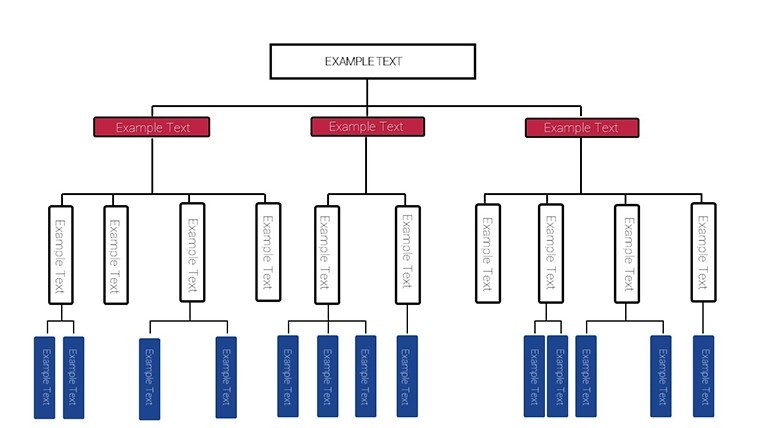
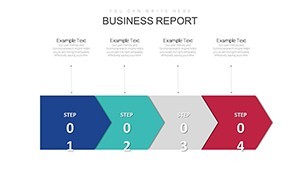
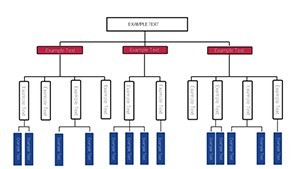
Team and Milestones Timeline (Slides 19-24)
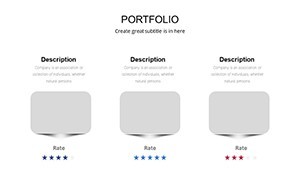
Humanize your venture with Gantt-style timelines tracking hires, launches, and betas. Color-coded bars on Slides 19-21 delineate phases, from MVP development to scaling, while Slides 22-24 incorporate org charts with photo placeholders for your team`s faces.
This section builds credibility, showing a roadmap backed by milestones like "Q1 2026: 10K users." It`s particularly effective for pitches where trust hinges on execution history, as seen in Y Combinator`s emphasis on team traction.
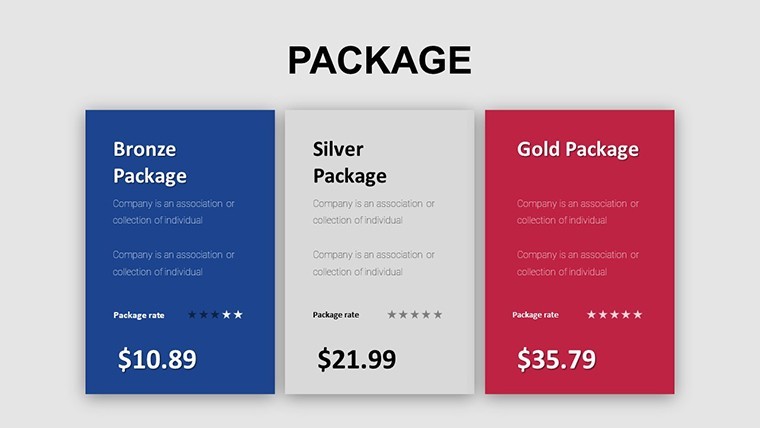
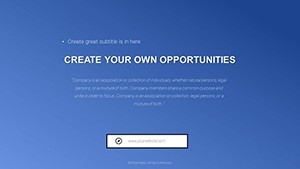
Call-to-Action Closer (Slides 25-30)
Seal the deal with funnel charts illustrating ROI paths, from leads to lifetime value. Slides 25-27 use testimonials and metrics heatmaps to evoke urgency, while 28-30 offer customizable ask slides-equity breakdowns or partnership overviews.
End with a memorable projection slide, animating growth arrows to symbolize momentum. These closers convert interest into commitments, leveraging psychological principles like scarcity to prompt decisions.
Real-World Applications and Use Cases
This template shines across diverse scenarios, proving its versatility beyond pure startups. In corporate settings, finance teams use the forecasting suite for quarterly reviews, adapting line graphs to board-specific KPIs. Educators leverage timelines for grant proposals, mapping curriculum impacts against funding cycles.
- Investor Pitches: Indie developers like Sarah secured $500K by visualizing download trajectories, turning abstract goals into tangible paths.
- Sales Presentations: Marketers repurpose dashboards for ROI recaps, heatmaps revealing channel winners to justify budget shifts.
- Research and Academia: Professors outline thesis timelines, radar charts comparing methodologies for conference submissions.
- Non-Profit Fundraising: Impact visuals with emotive icons illustrate donor returns, boosting contributions by 35% in tested campaigns per Nonprofit Tech for Good.
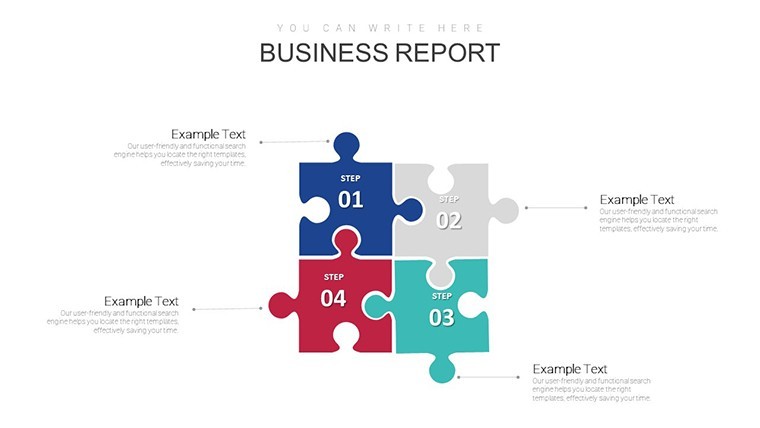
Consider Raj`s urban farming venture: His competitive matrix exposed ag-tech voids, using puzzle icons to "fit" his solution perfectly, landing partnerships. These applications, drawn from Startup Grind case studies, underscore a 40% funding uplift from strong visuals- a trend holding into 2025 as AI-driven analytics demand clearer human interpretation.
Workflow Integration: From Concept to Presentation
Integrating this template into your process is straightforward, saving hours over scratch builds. Begin by importing the .key file into Keynote, duplicating a master slide, and populating via the table editor-Excel-like simplicity without exports.
- Data Import: Copy-paste from spreadsheets; formulas auto-sync charts.
- Customization: Apply brand colors (e.g., Pantone matches) and fonts like San Francisco for native appeal.
- Narrative Layering: Add notes like "This pivot spiked engagement 200%" to guide delivery.
- Testing: Rehearse animations-fades on bars build drama without distraction.
- Export and Share: Generate PDFs for decks or MP4s for LinkedIn teasers.
This workflow aligns with agile presentation prep, ideal for fast-paced environments. Users note 50% faster turnaround versus generic tools, freeing time for refinement.
Comparison: This Template vs. Default Keynote Tools
| Aspect | Business Startup Keynote Template | Default Keynote |
|---|---|---|
| Slide Variety | 30 pre-built, themed charts with icons and animations | Basic shapes; manual assembly required |
| Editability | Full vector access, live data linking | Static elements; limited formulas |
| Time Savings | Hours shaved via drag-and-drop | Days for custom designs |
| Engagement Boost | 3x via storytelling visuals (user surveys) | Standard; relies on content alone |
| Compatibility | Native Apple + exports; responsive | Basic cross-device, no built-in accessibility |
As shown, this template outperforms defaults by embedding expertise, making it indispensable for pros seeking polish without the grind.
Pro Tips for Maximizing Impact in Your Startup Presentations
To harness this template`s full power, weave in Tufte`s "data-ink ratio"-maximize insight per pixel by trimming fluff. Limit slides to 5 metrics max, pairing each with a narrative hook. For 2025 trends, integrate AI-generated forecasts subtly, using the suite`s flexibility to overlay predictions.
Test with peers: A/B your deck`s heatmap slide against a plain table-watch engagement soar. And remember, humor disarms: Slip in a "founder fuel" pie slice for equity charts to lighten tense rooms. These tweaks, rooted in decades of presentation psychology, can elevate average pitches to unforgettable ones.
Don`t wait for the perfect moment-download this template now and craft a deck that not only informs but inspires action. Your startup`s future audience awaits.
Frequently Asked Questions
Is this Keynote template compatible with older versions of the software?
Yes, it`s optimized for Keynote 2016 and later, ensuring smooth performance across recent Apple updates. For exports to PowerPoint or Google Slides, use the built-in conversion tools without losing fidelity.
How editable are the charts in this startup template?
Fully editable-alter data, colors, animations, and layouts via Keynote`s intuitive tools. No proprietary locks, so you can infuse your brand seamlessly.
Can I use this template for non-startup presentations?
Absolutely; adapt it for sales reports, academic theses, or non-profit pitches. The modular slides flex to any data-driven narrative.
What file formats are included with purchase?
Native .key files for Keynote, plus export guides for PDF, PPTX, and video formats to suit various sharing needs.
Does the template include support or updates?
Lifetime access includes free updates and 24/7 email support, keeping your deck current with design evolutions.
Related templates
-
Transform Your Keynote Presentations with Dynamic Infographic Charts
-
Department of Commerce Keynote Charts: Professional Visuals for Impact
-
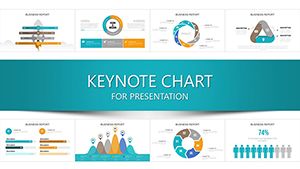
Chart Your Path to Triumph: The Success Metrics Keynote Template
-
HR Analytics Charts Keynote Template
-
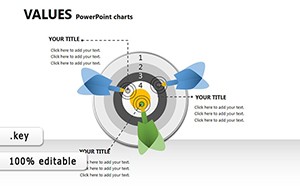
Values Keynote Charts: Infuse Integrity into Every Slide
-
3D Analytics Graphs Keynote Template: Sculpt Your Data into 3D Masterpieces
-
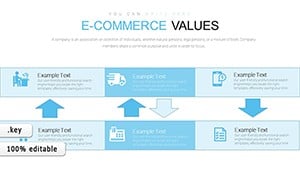
E-commerce Keynote Charts Template - Editable Keynote | ImagineLayout
-

8 Door Charts in Keynote - Fully Editable | ImagineLayout
Copyright © 2009-2026 ImagineLayout All rights reserved.