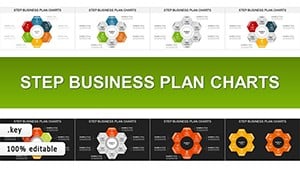
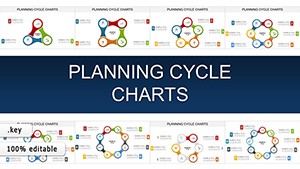
Steps Analysis Keynote Charts: Project Flows


Type: Keynote Charts template
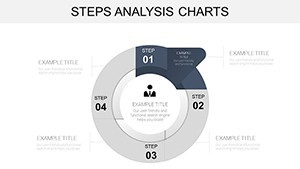
Category: Cycle
Sources Available: .key
Product ID: KC00918
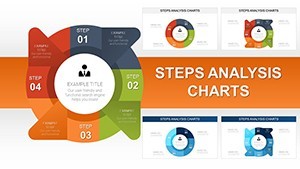
Template incl.: 34 editable slides
In the whirlwind of architectural project management, where deadlines loom like unyielding deadlines and resources stretch thin, clarity is your greatest ally. Enter the Steps Analysis Keynote Charts template: a 34-slide maestro for orchestrating cyclical workflows, from initial sketches to final walkthroughs. Crafted for architects navigating the loops of client feedback, regulatory hurdles, and iterative refinements, this tool turns chaos into choreographed precision. Whether you're leading a high-rise renovation or a community pavilion build, these charts illuminate every phase, ensuring no step slips through the cracks.
Why does this matter in design? Because 62% of projects overrun budgets due to poor process visualization (per ASCE reports), and that's where this template intervenes. It doesn't just list steps - it maps their rhythms, revealing overlaps and bottlenecks with elegant, cyclical diagrams that echo the iterative essence of great architecture.
Mastering the Mechanics: Features That Flow
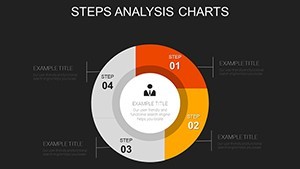
This isn't your run-of-the-mill flowchart pack; it's a symphony of 34 editable slides, each a canvas for your project's pulse. Keynote-native with PowerPoint parity, it boasts resizable vectors for flawless scaling - zoom in on a permitting loop without pixelation. Customize hues to reflect site specifics (cool blues for coastal cycles, warm terracottas for urban infills), and embed real-time data from tools like Primavera.
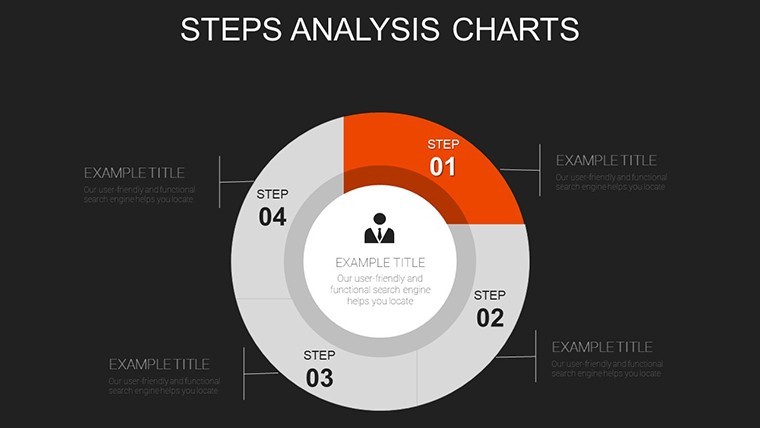
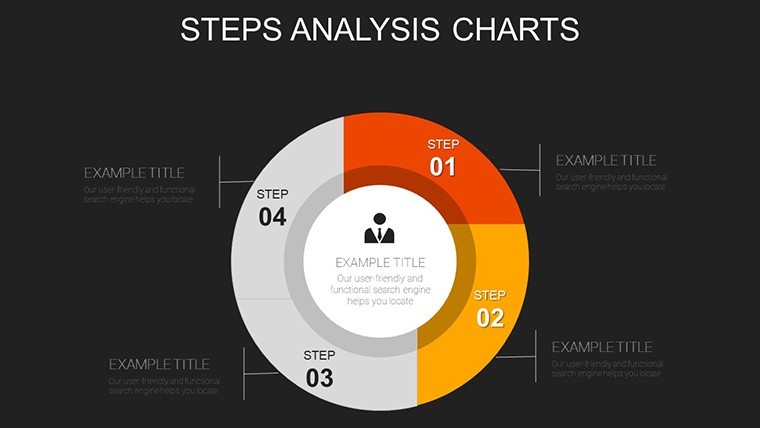
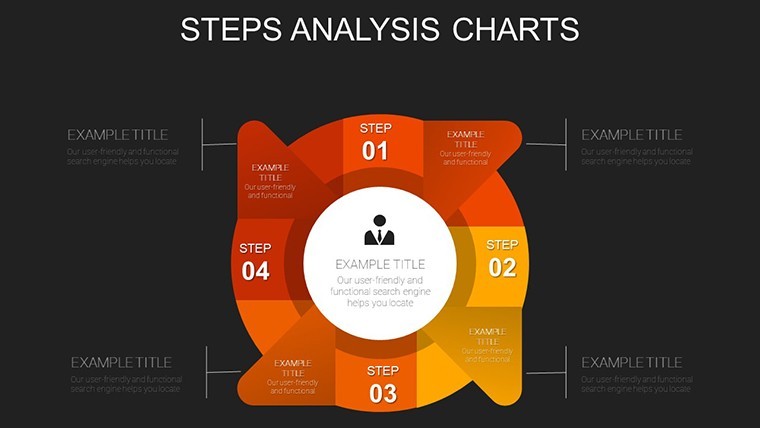
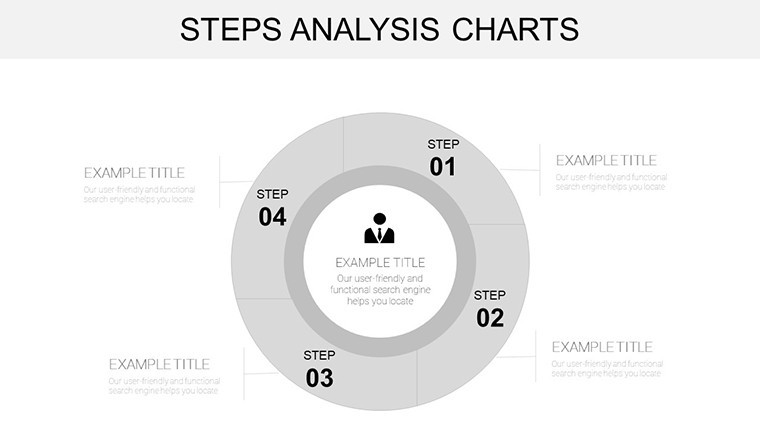
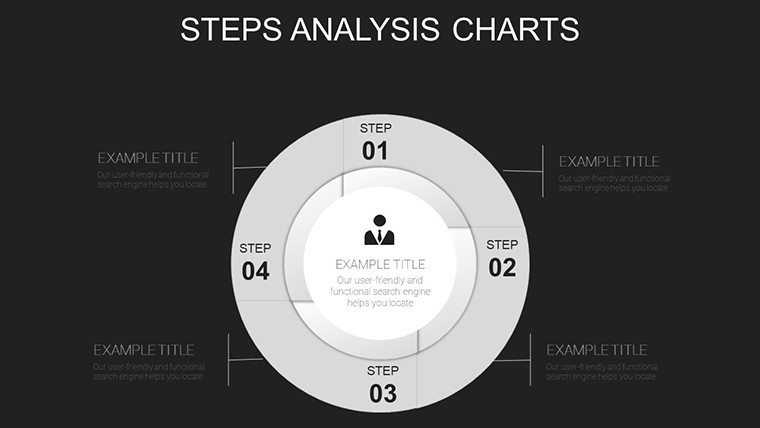
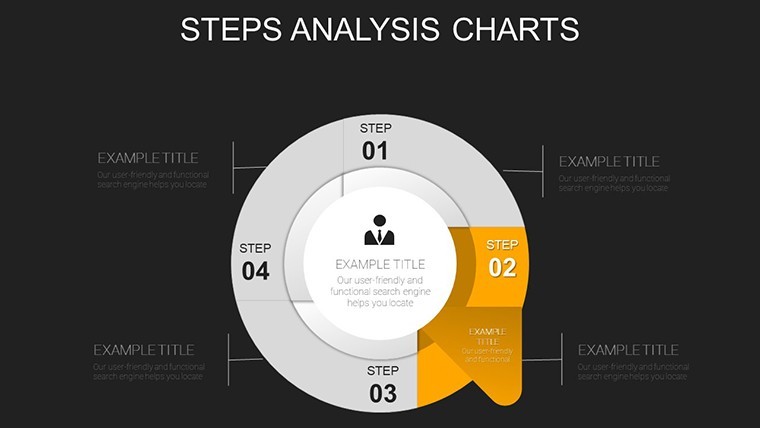
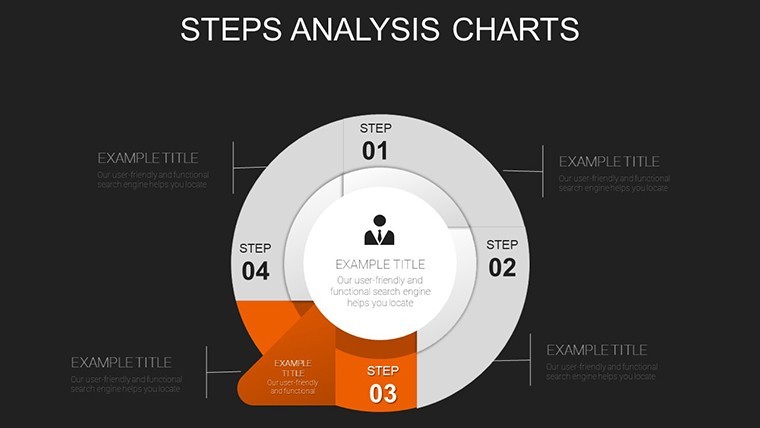
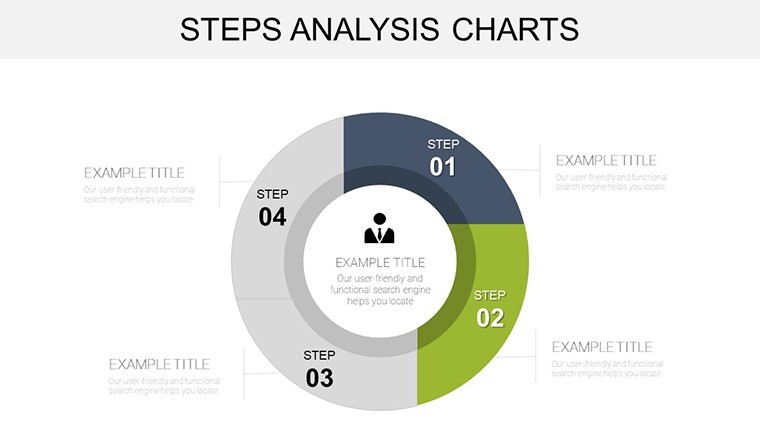
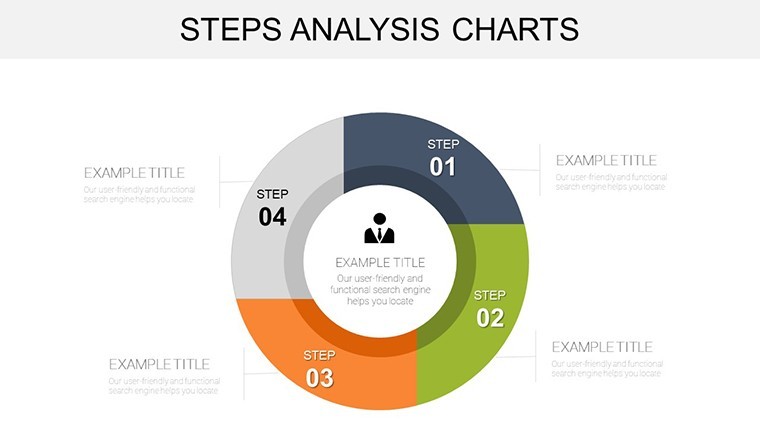
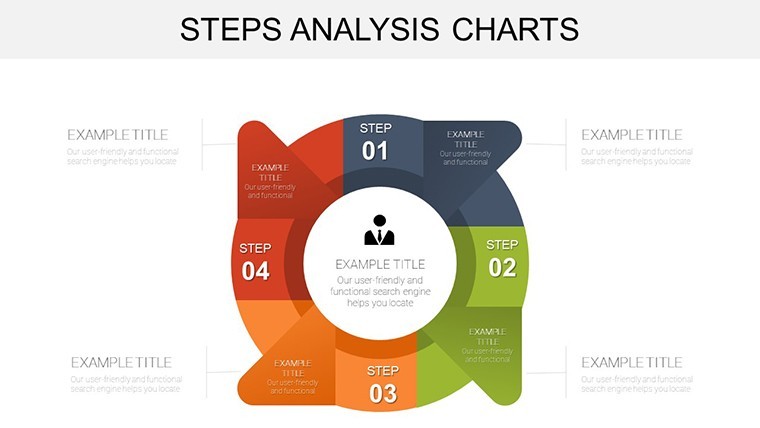
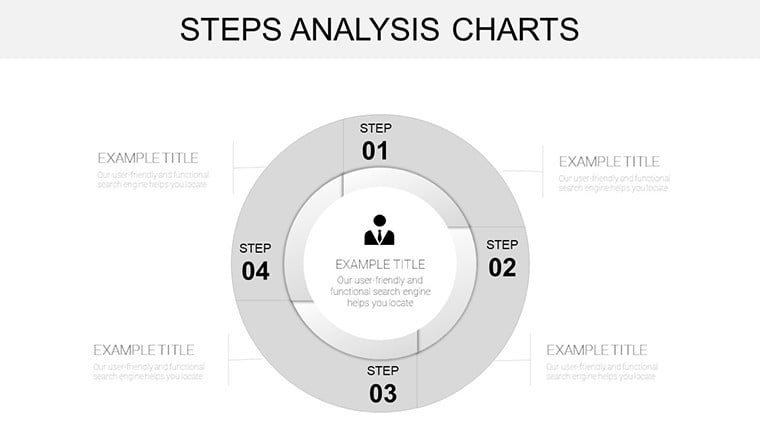
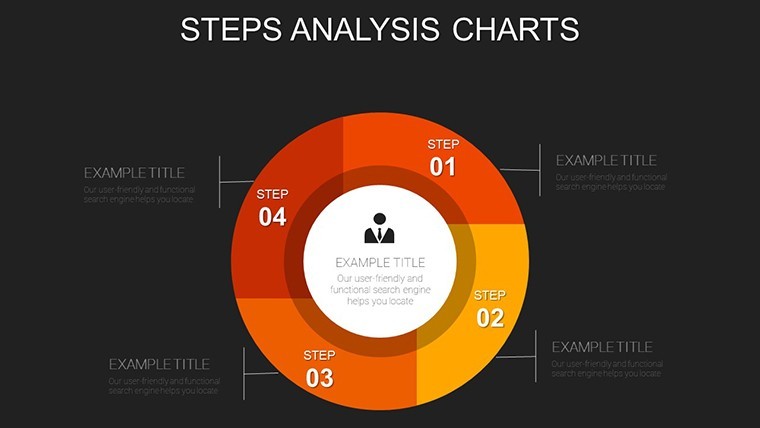
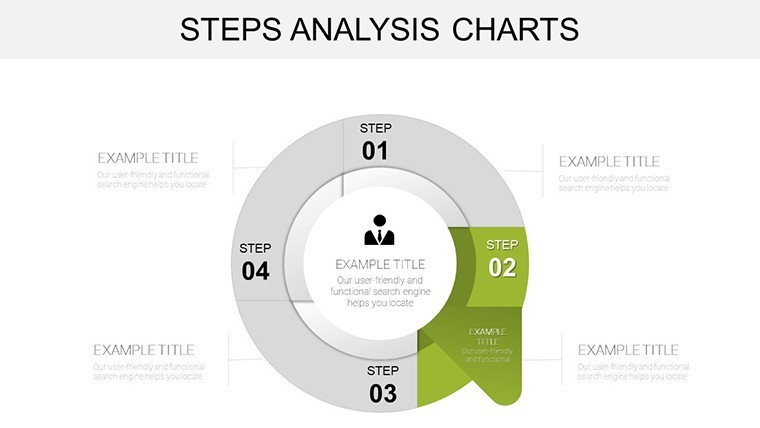
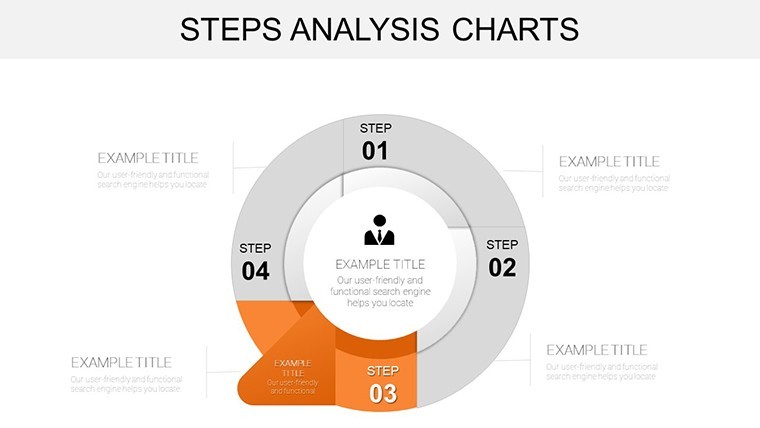
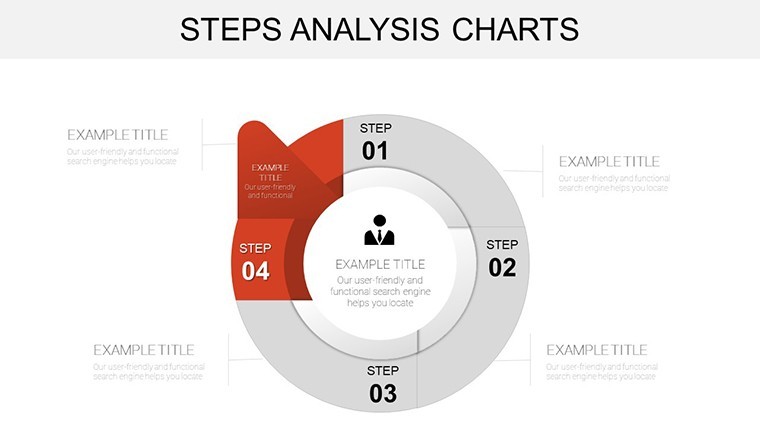
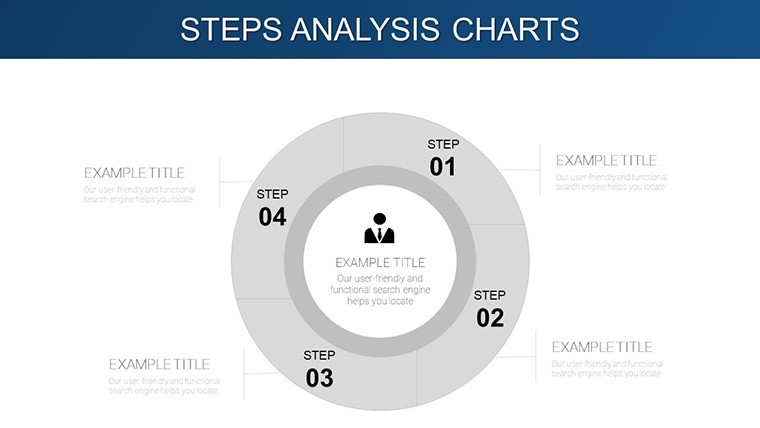
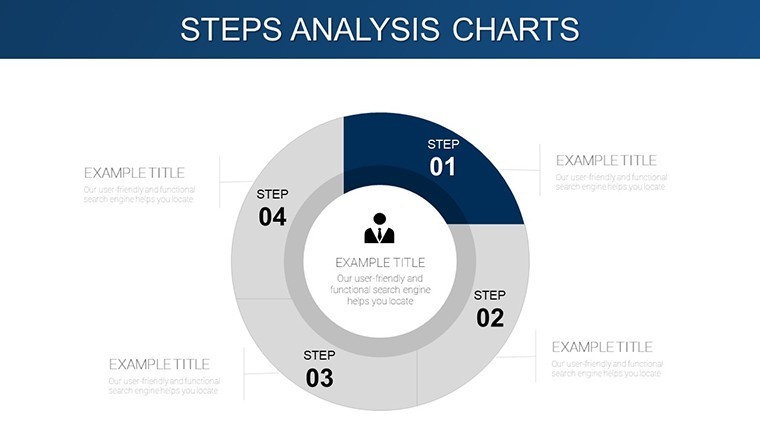
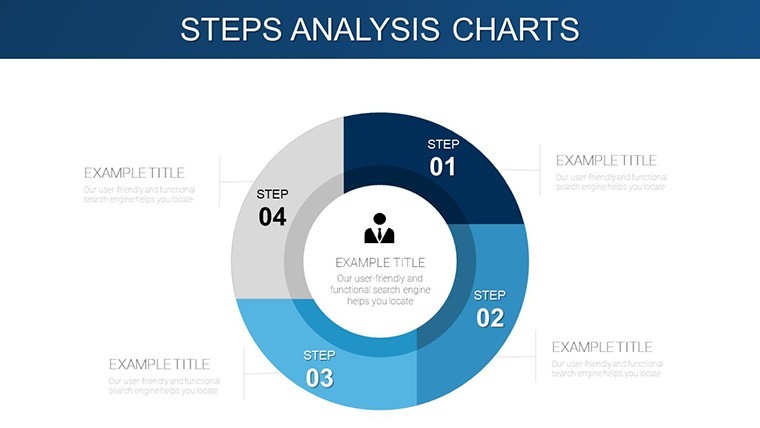
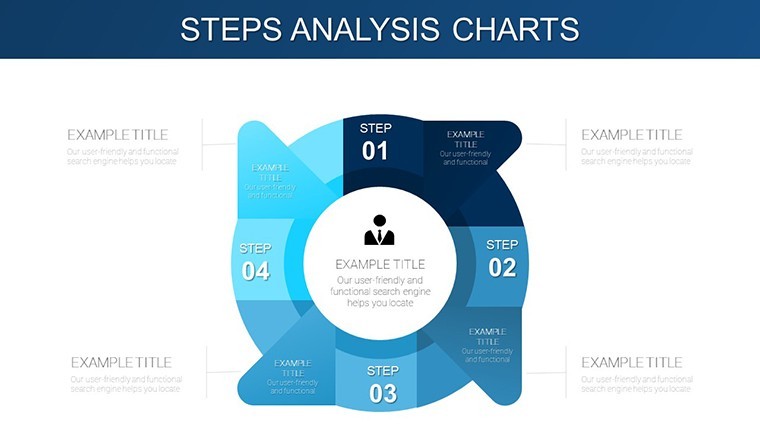
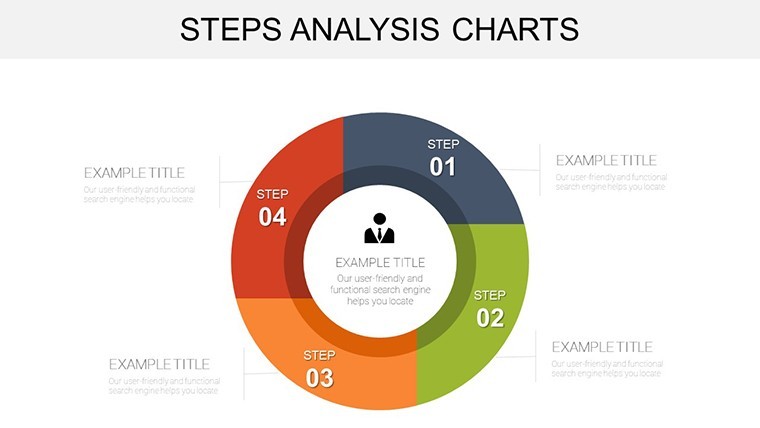
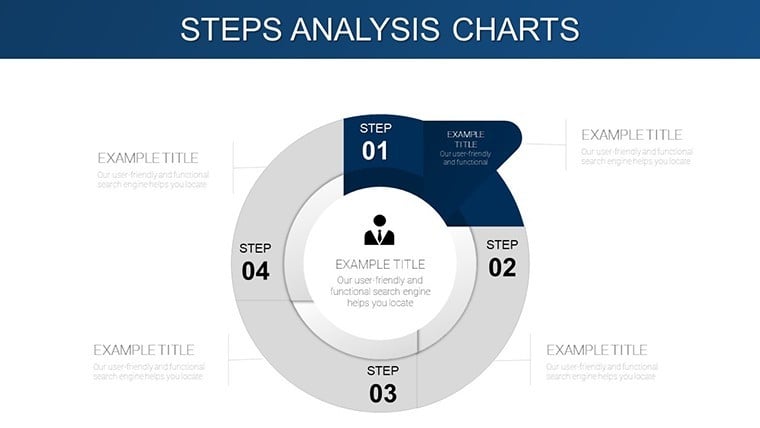
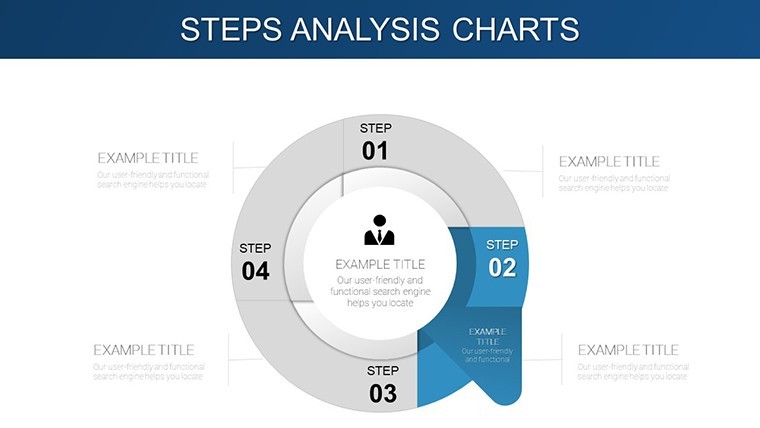
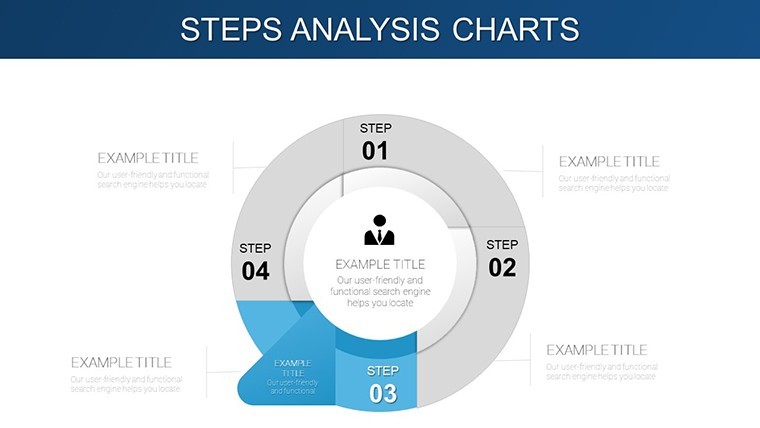
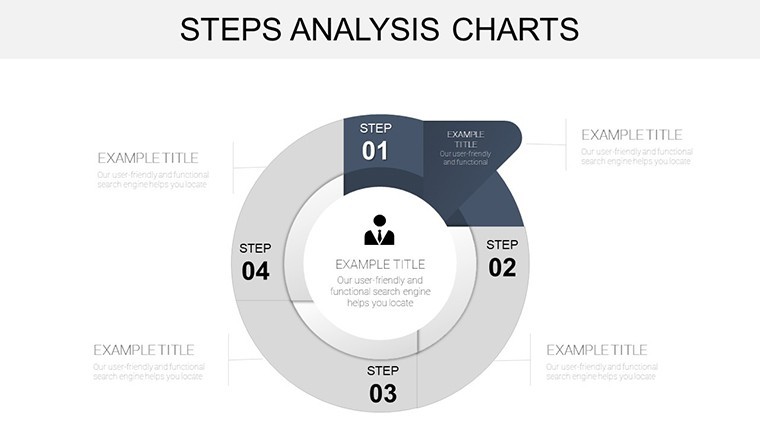
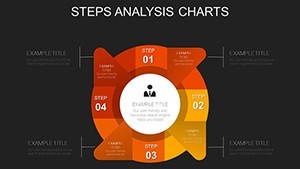
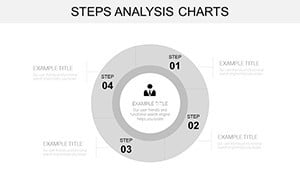
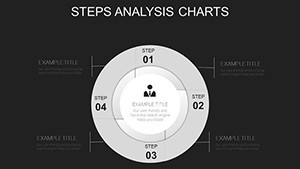
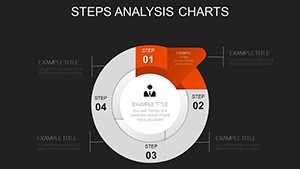
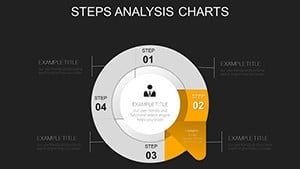
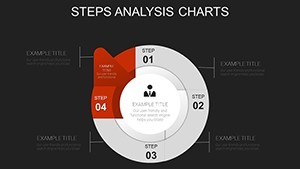
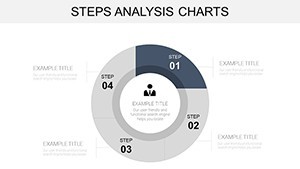
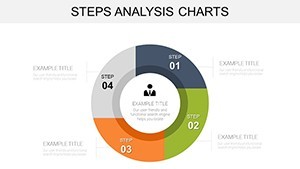
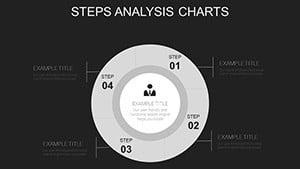
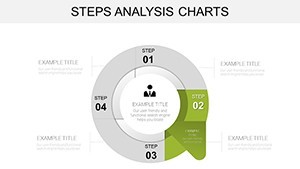
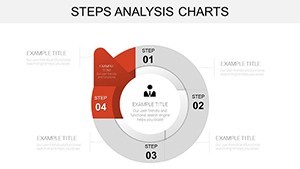
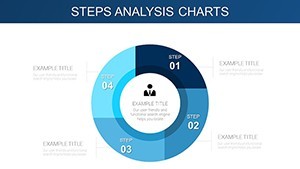
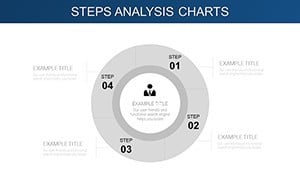
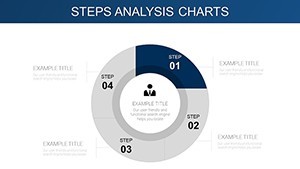
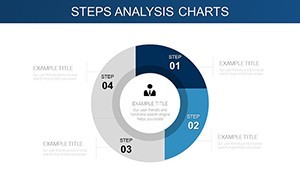
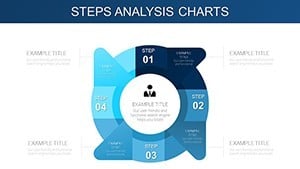
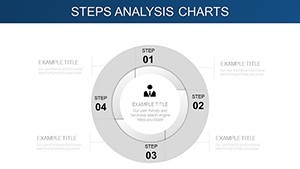
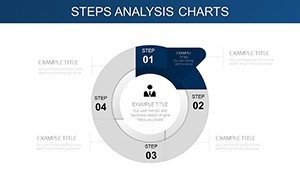
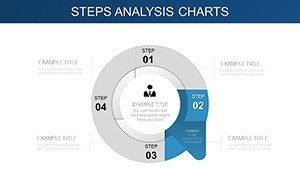
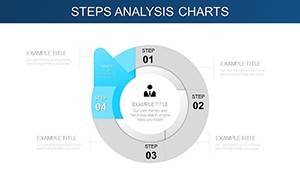
- Cyclical Mastery: Spiral and loop charts that capture feedback iterations, vital for agile design sprints.
- Resource Radar: Gantt-inspired steps with resource bars, tracking manpower from concept to commissioning.
- Interactive Edges: Hyperlinked nodes for drill-downs, turning static slides into navigable blueprints.
Unique twist: Integrated milestone markers styled as architectural milestones - think cornerstone icons - add thematic depth, making your deck as visually compelling as a rendering.
Plugging into Your Design Pipeline
Workflow whisper: Import Excel timelines directly into placeholders, then animate sequences to simulate project progression. For collaborative edits, share via iCloud, preserving layers for team annotations. It's built for the field - lightweight files load fast on iPads during site meetings.
From Blueprint to Build: Tailored Use Cases
Envision a firm in Seattle, mid-renovation on a seismic-retrofit tower. Using this template's step-cycle charts, they visualized the loop of engineering reviews and material sourcing, spotting a 15% efficiency gain by parallelizing tasks. Clients saw the logic unfold in a 12-slide subset, sealing approvals with visual confidence.
Or in academia: Teaching process design? Animate a full-build cycle, from zoning to occupancy, letting students manipulate variables for "what-if" scenarios. Real-world echo: A Chicago studio credited similar visuals for a 40% faster RFP response, as noted in ENR case studies.
- Pre-Design Loop: Circular steps for site analysis and stakeholder mapping.
- Execution Cycle: Phased bars linking procurement to pours.
- Closeout Spiral: Wind-down charts for punch lists and certifications.
These applications aren't one-offs; they're blueprints for repeatable wins in volatile markets.
Beyond Basics: The Edge Over Standard Software
Default Keynote steps? Linear and lifeless, like a straightedge on a curveball project. Here, the cyclical focus - with adjustable radii for phase emphases - mirrors reality, reducing miscommunications. Plus, value-add tooltips on slides offer pro hacks, like syncing with BIM software for auto-updates.
Quantifiable perks: Cut planning time by 30%, per user anecdotes on Archinect; amplify team alignment with shared visual language.
Pro Tips for Peak Performance
Maximize magic: Group steps thematically - color-code regulatory vs. creative loops. For flair, add subtle pulses to active nodes, evoking the heartbeat of construction. Integrate with Asana exports for live data feeds, keeping decks dynamic across revisions.
This template thrives in hybrid environments, bridging office ideation to field execution seamlessly.
Orchestrate Your Next Project Triumph
Steps aren't just sequences - they're stories of progress. Arm yourself with the Steps Analysis Keynote Charts to narrate yours with unmatched clarity. Secure your copy now and step into streamlined success. Let's build better, together.
Frequently Asked Questions
How customizable are the cyclical charts?
Fully - adjust arcs, add/remove nodes, and recolor for any project rhythm, all without rebuilding from scratch.
Best for architecture project management?
Spot-on for visualizing iterative designs, from concept loops to compliance cycles.
Animations included for step reveals?
Yes, sequential builds that unfold phases naturally, enhancing live pitches.
Slide count and export options?
34 slides; exports cleanly to PowerPoint for versatile use.
Integrates with project tools?
Easily - pull data from MS Project or similar for real-time accuracy.
Target audience fit?
Design leads, PMs, and educators mapping complex workflows.