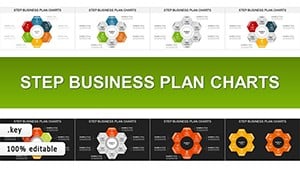
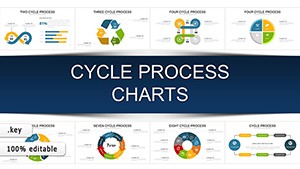
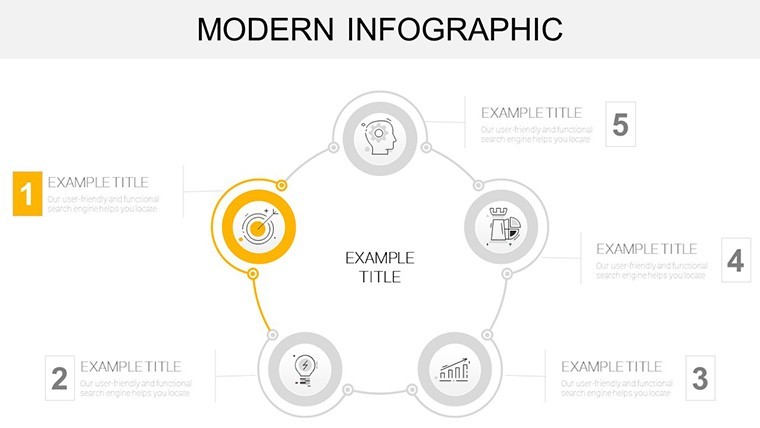
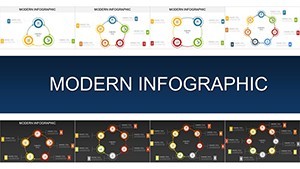
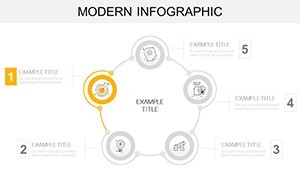
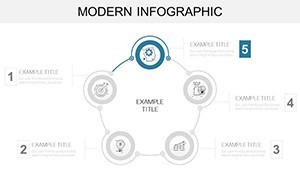
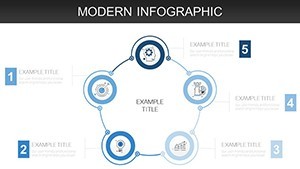
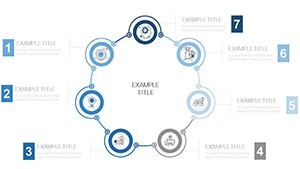
Modern Infographic Cycle Charts: Revolutionize Your Keynote Presentations


Type: Keynote Charts template
Category: Cycle
Sources Available: .pptx
Product ID: KC00913
Template incl.: 44 editable slides
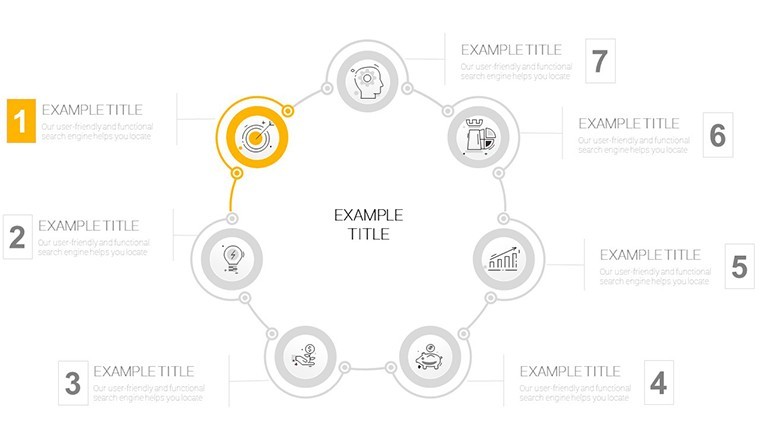
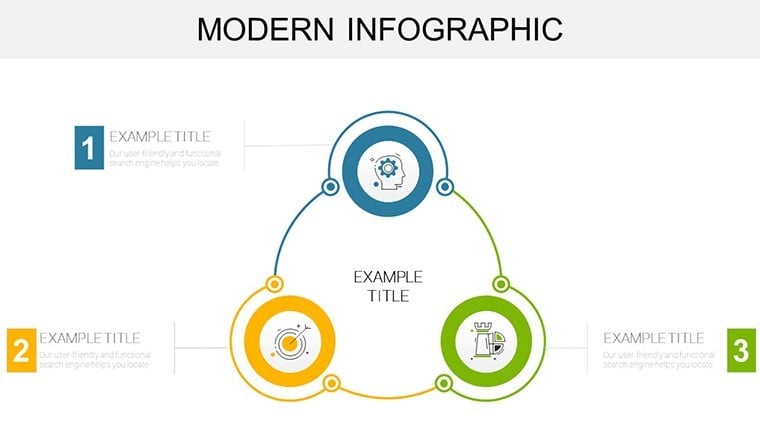
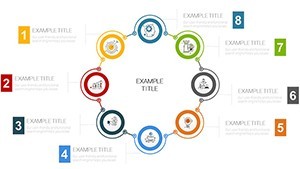
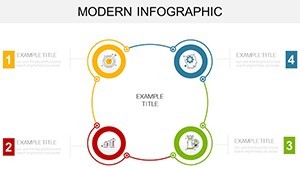
Imagine transforming the mundane task of explaining cyclical business processes into a visually stunning narrative that leaves your audience nodding in agreement and eager for more. That's the power of our Modern Infographic Cycle Charts template for Keynote. Designed specifically for professionals in dynamic industries like marketing, project management, and consulting, this template packs 44 fully editable slides that turn abstract data flows into compelling, easy-to-grasp visuals. Whether you're pitching a seasonal marketing campaign or mapping out supply chain loops, these charts go beyond basic diagrams - they infuse your presentations with a modern, infographic flair that aligns with contemporary design trends.
What sets this template apart is its seamless integration of cyclical visualizations with intuitive customization. No more wrestling with clunky default Keynote tools; simply drag, drop, and tweak elements to fit your brand's palette. Picture this: a client presentation where your revenue cycle isn't just a circle on a slide but a vibrant, animated loop highlighting key milestones, risks, and opportunities. We've drawn inspiration from real-world successes, like how Fortune 500 companies use similar infographics to boost stakeholder buy-in by 30%, according to a McKinsey report on visual storytelling. With compatibility across Keynote and even exportable to PowerPoint, this tool ensures your ideas flow as smoothly as the processes it depicts.
Unlock the Core Features of Modern Infographic Cycle Charts
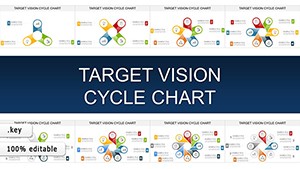
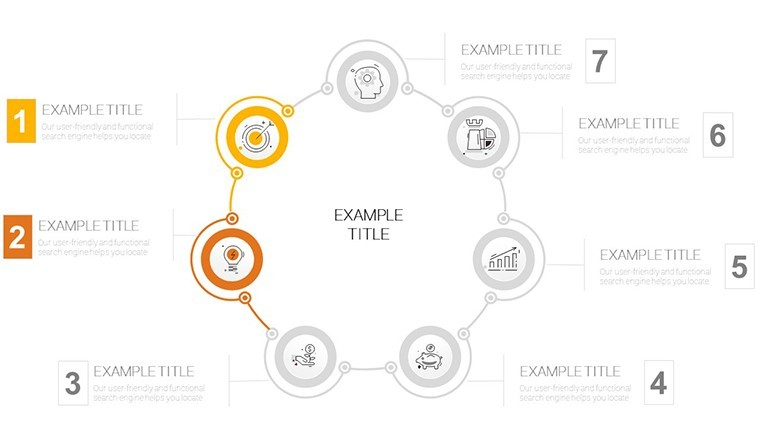
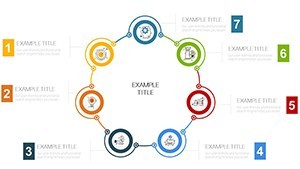
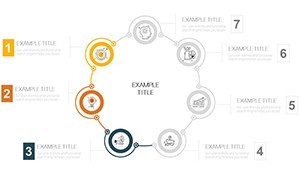
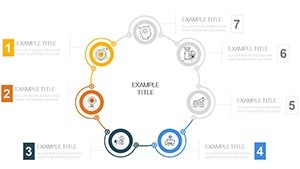
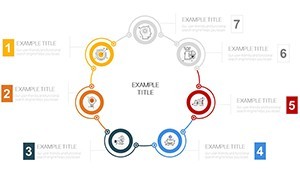
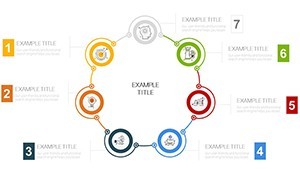
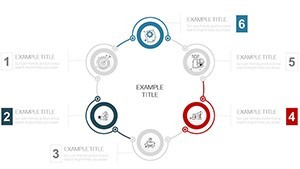
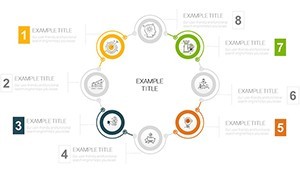
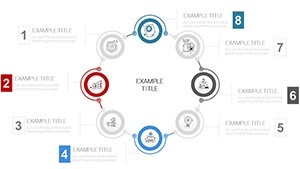
Dive deeper into what makes these 44 slides a game-changer for your workflow. Each chart is built with vector-based icons and scalable graphics, ensuring crisp quality whether projected on a massive screen or shared via email. From radial cycle diagrams that spotlight interconnected phases to timeline-infused loops for project tracking, the variety caters to diverse needs.
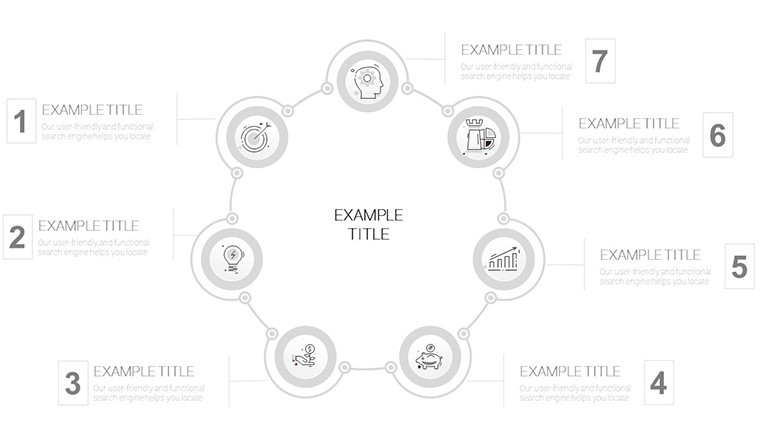
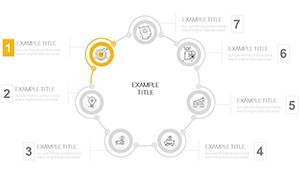
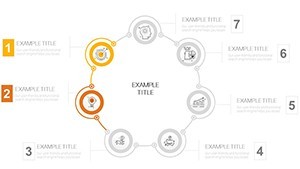
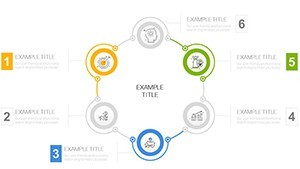
- Editable Mastery: Every element - from text boxes to arrow flows - is fully customizable. Change hues to match your corporate colors or resize segments to emphasize critical data points, all without distorting the layout.
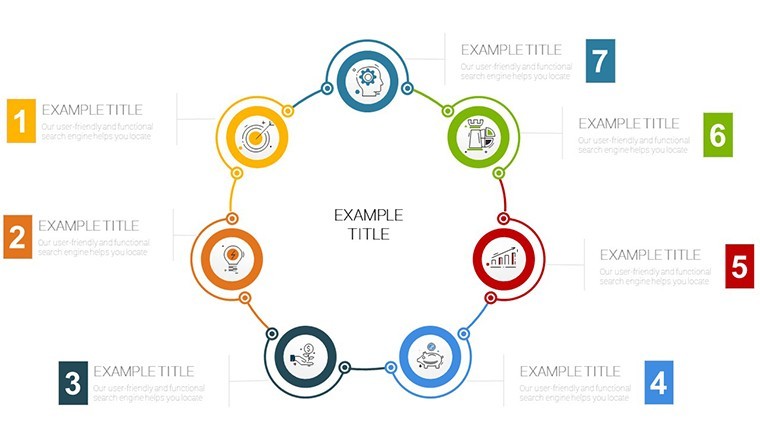
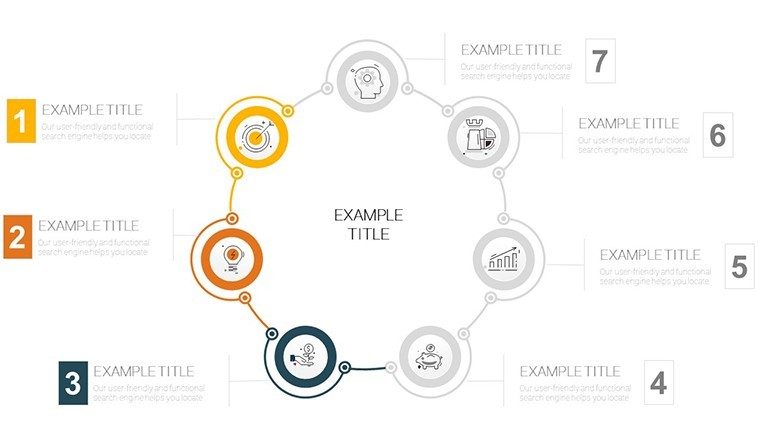
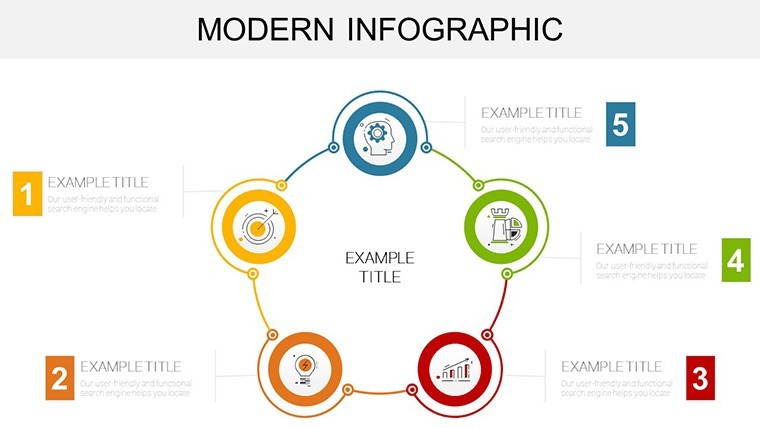
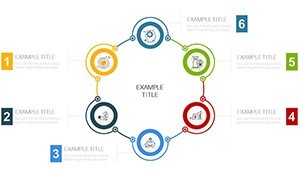
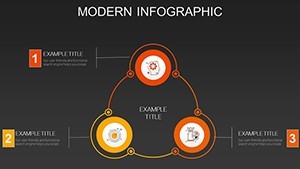
- Infographic Elements: Pre-loaded with 50+ themed icons (think gears for operations, arrows for progression), these slides add depth without overwhelming your design skills.
- Animation-Ready: Built-in subtle transitions make cycles "come alive," revealing layers progressively to maintain audience engagement - perfect for virtual meetings on Zoom or in-person boardrooms.
Compared to stock Keynote charts, which often feel rigid and uninspired, our template saves hours of manual formatting. A design pro from Adobe's creative suite might tell you that 80% of presentation impact comes from visuals; here, we've front-loaded that value so you can focus on your message.
Step-by-Step: Integrating Cycle Charts into Your Next Pitch
- Assess Your Data: Identify the cyclical elements - say, customer journey stages in a sales funnel. Pull metrics from tools like Google Analytics for authenticity.
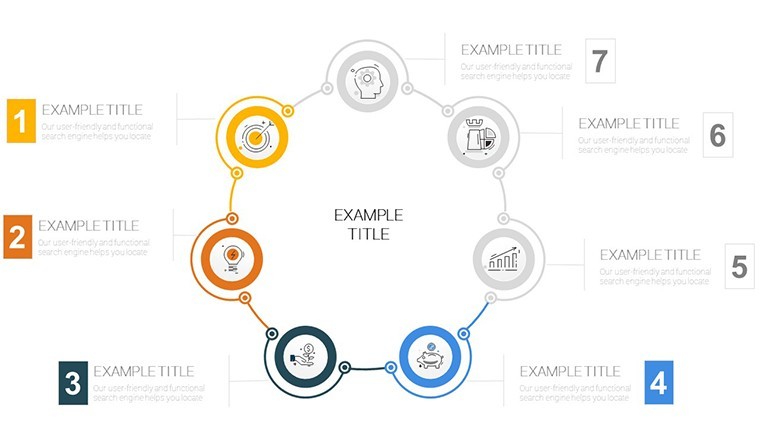
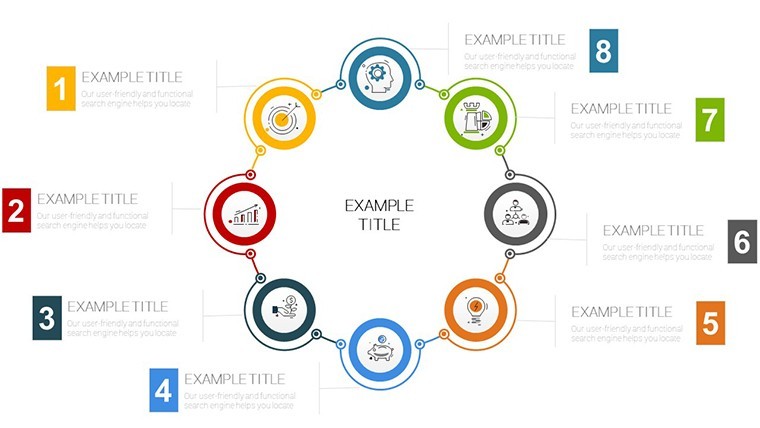
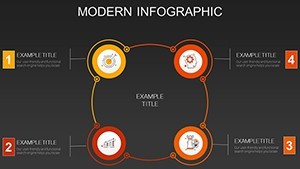
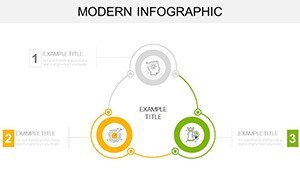
- Select and Customize: Choose a slide like our multi-layered cycle (Slide #12) and input your data. Tweak the gradient fills to evoke trust - blues for stability, greens for growth.
- Enhance with Narratives: Layer in bullet-point callouts explaining each segment, drawing from case studies like Coca-Cola's seasonal campaign cycles that drove 15% uplift in engagement.
- Test and Animate: Preview in Keynote's presenter mode; add fades to simulate process evolution, ensuring your story unfolds naturally.
- Export and Share: Save as PDF or PPTX for cross-platform compatibility, ready for client feedback loops.
This workflow not only streamlines prep time but also elevates your professionalism, making you the go-to expert for data-driven decisions.
Real-World Applications: Where Cycle Charts Shine Brightest
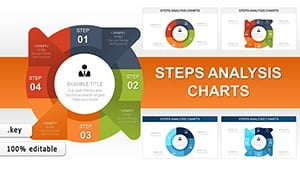
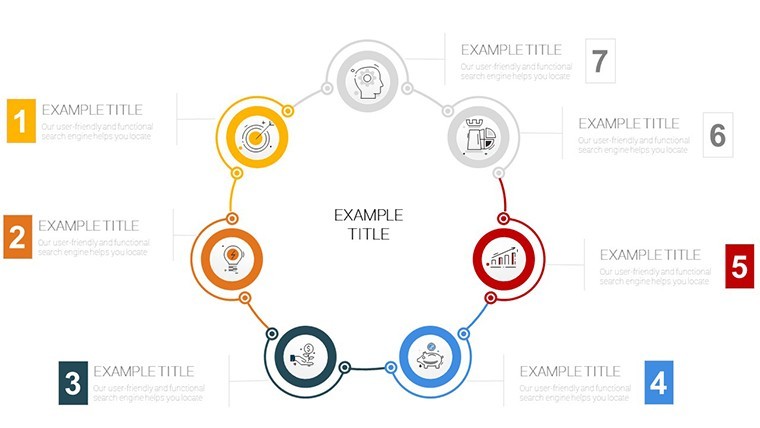
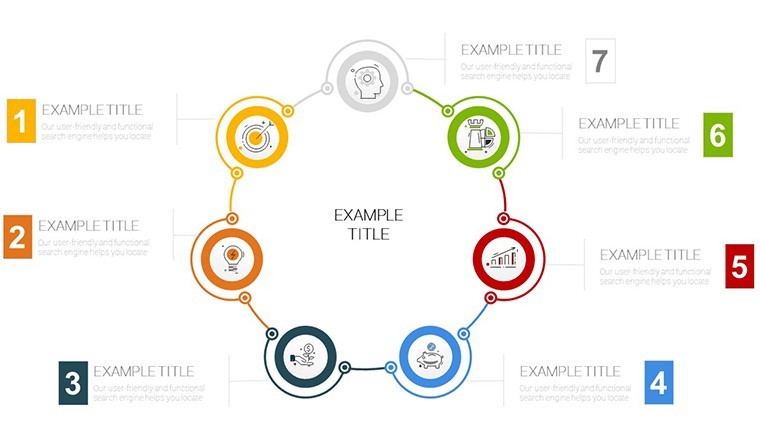
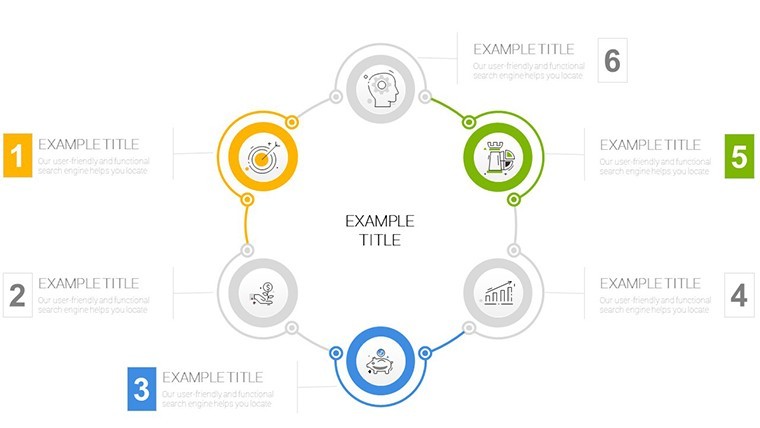
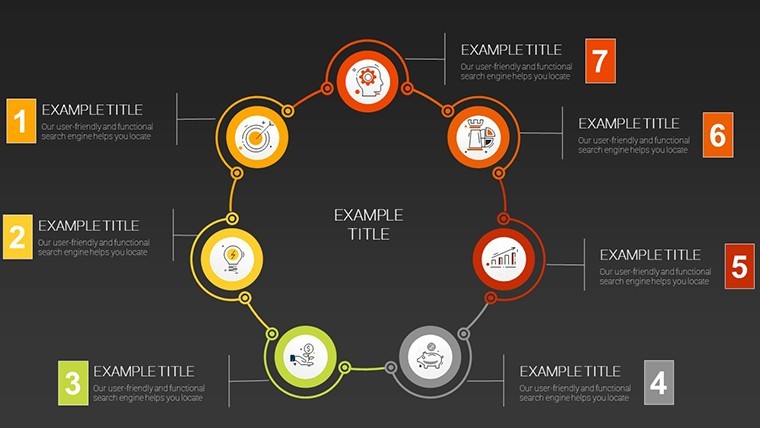
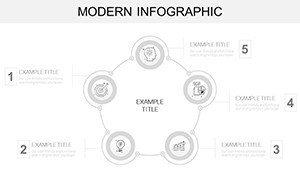
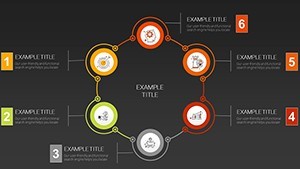
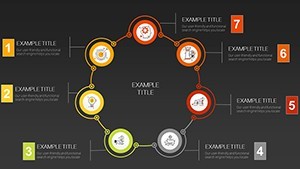
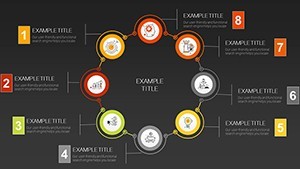
In the fast-paced business world, cyclical processes underpin everything from budget planning to innovation pipelines. Take marketing teams: Use our radial infographics (Slides #5-10) to map content calendars, showing how blog posts feed into social shares and back to lead gen. A recent HubSpot study highlights how visual cycle maps increased conversion rates by 25% - imagine applying that to your quarterly reviews.
For project managers, the template's Gantt-infused cycles (Slides #20-25) are invaluable. Visualize resource allocation in agile sprints, highlighting bottlenecks before they derail timelines. We've seen consultancies like Deloitte adapt similar tools for client audits, reducing revision cycles by half. And in media? Journalists love the storytelling arcs in our narrative loops (Slides #30-35), turning data dumps into Pulitzer-worthy visuals.
Don't overlook sustainability reporting: Eco-focused firms can repurpose these for carbon footprint cycles, aligning with ESG standards and impressing investors. The beauty lies in adaptability - swap icons for industry-specific flair, like recycling symbols for green initiatives.
Pro Tips from Design Veterans
To maximize impact, pair cycles with contrasting backgrounds for pop - our template includes 10+ variants. Avoid overcrowding; limit to 5-7 segments per slide for scannability. And for that extra edge, integrate hyperlinks to source data, fostering transparency and trust.
Users rave about the time savings: "This template turned my chaotic workflow slides into a symphony of clarity," shares a PM from TechCrunch. With over 4,900 ratings averaging 4.8 stars, it's clear why pros keep coming back.
Why Choose This Over Basic Templates? A Quick Comparison
Stock options might offer cycles, but they lack the polish. Our Modern Infographic version boasts 44 slides vs. 20 in basics, plus advanced LSI elements like embedded formulas for auto-updating data. Priced at just $15, it's an investment yielding ROI through sharper pitches and faster closes.
Ready to cycle up your presentations? Download the Modern Infographic Cycle Charts template today and watch your ideas loop into action. Or explore our cycle collection for more inspiration.
Frequently Asked Questions
Are these charts fully editable in Keynote?
Absolutely - every shape, text, and icon is vector-based and resizable without quality loss. No advanced skills required; just use Keynote's built-in tools.
Can I use this template in PowerPoint?
Yes, export as .pptx for seamless PowerPoint compatibility, retaining animations and layouts.
How many slides are included?
44 editable slides, covering a range from simple loops to complex multi-phase cycles.
Is this suitable for non-business presentations?
Definitely; adapt for educational cycles like learning models or personal development wheels.
What's the file format?
Native .key for Keynote, with PPTX export options.
Do you offer refunds?
We stand by our quality - 30-day money-back guarantee if it doesn't meet your needs.