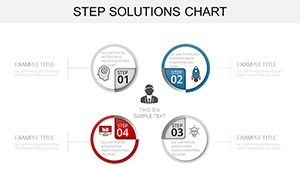
Step Solutions Keynote Charts: Transform Complex Processes into Clear Visual Narratives


Type: Keynote Charts template
Category: Cycle
Sources Available: .key
Product ID: KC00905
Template incl.: 29 editable slides
Imagine standing in front of a room full of stakeholders, armed with a presentation that doesn't just list steps but weaves your business strategy into a compelling, cyclical story. That's the power of the Step Solutions Keynote Charts template. Designed for professionals in economics, finance, and operations who need to illustrate interconnected processes - like supply chain exchanges or financial transaction loops - this 29-slide powerhouse turns abstract data into intuitive visuals. Whether you're pitching a new manufacturing roadmap or dissecting a food chain model for a sustainability report, these charts save you hours of design drudgery, letting you focus on the insights that drive decisions.
In today's fast-paced boardrooms, where attention spans are shorter than a quarterly earnings call, clarity isn't optional - it's your competitive edge. This template, compatible seamlessly with Keynote's native tools, features vector-based elements that scale effortlessly without pixelation. From animated step transitions that mimic real-world flows to color-coded segments highlighting bottlenecks, every slide is crafted to resonate with audiences from C-suite execs to cross-functional teams. And with its roots in real-world applications - like modeling SMAC frameworks (Social, Mobile, Analytics, Cloud) for tech integrations - it's not just pretty; it's purposeful.
Unlock the Core Features That Make Step Solutions Stand Out
Dive deeper into what sets this template apart from generic Keynote defaults. At its heart are 29 meticulously designed slides, each editable down to the finest detail. Swap data points with a click, tweak colors to match your brand palette, or layer in custom icons for that personal touch. Here's a breakdown of standout elements:
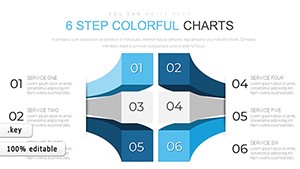
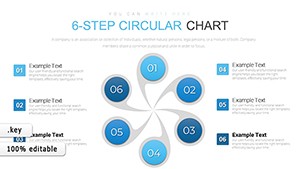
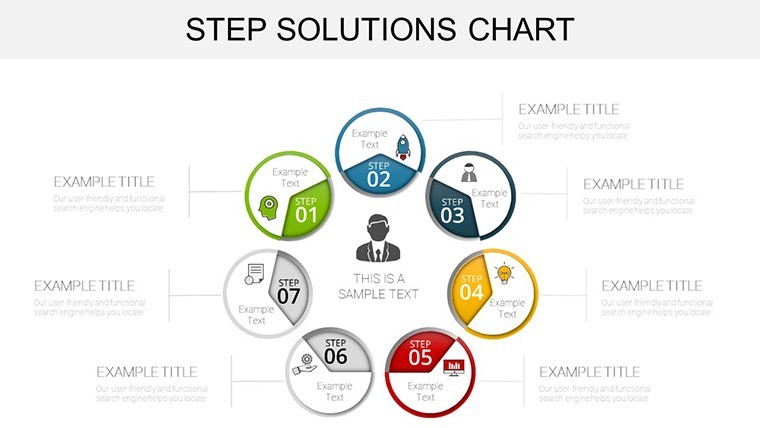
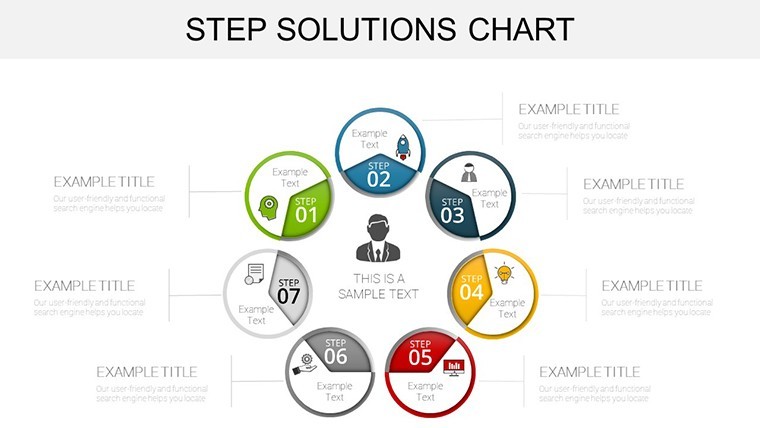
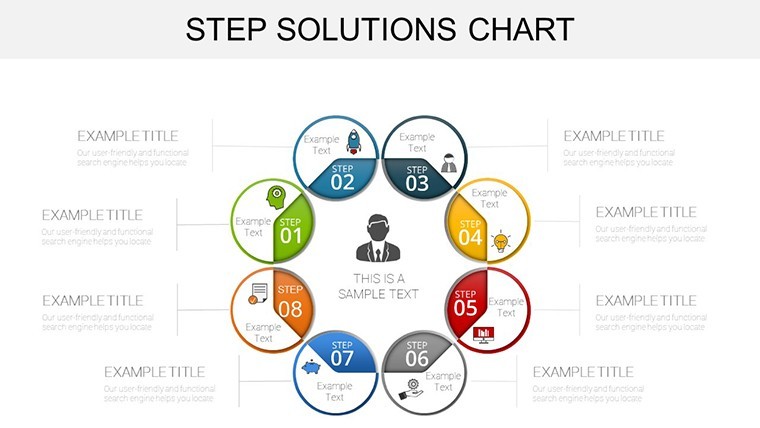
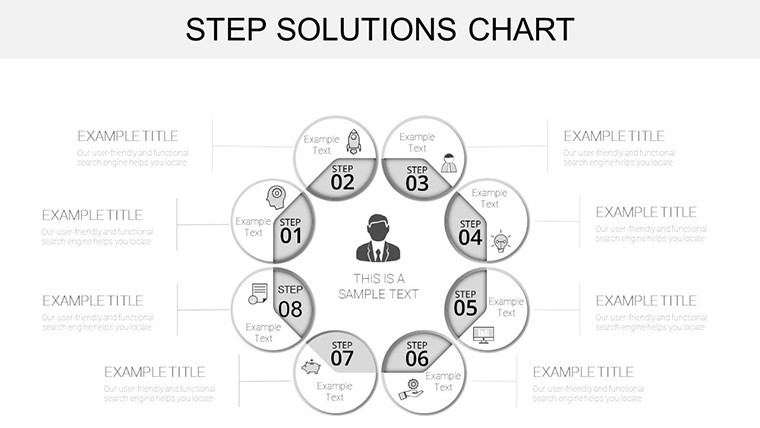
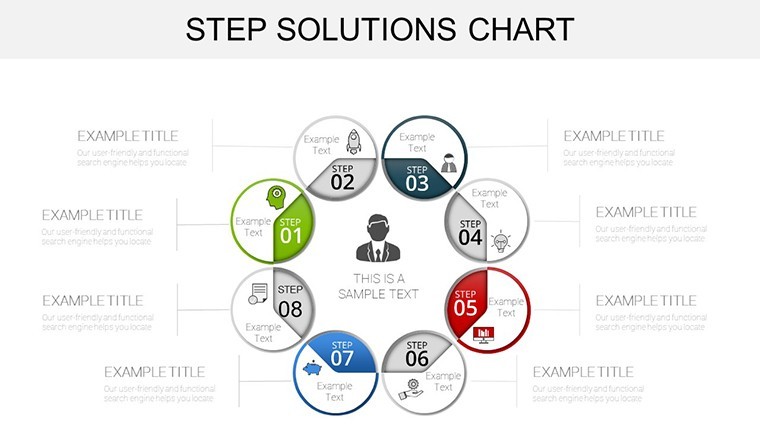
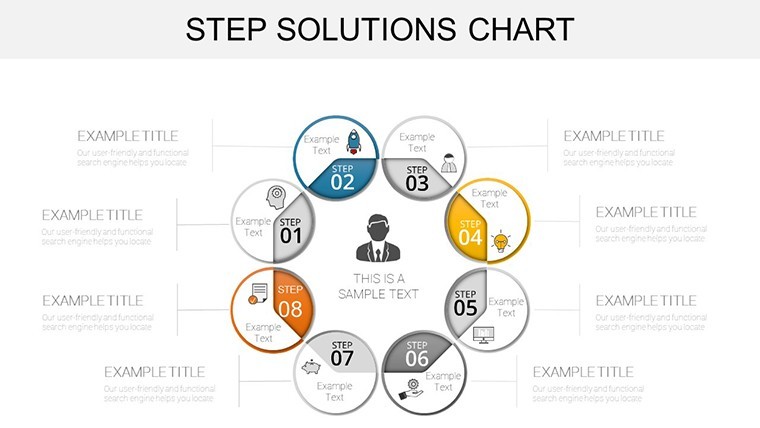
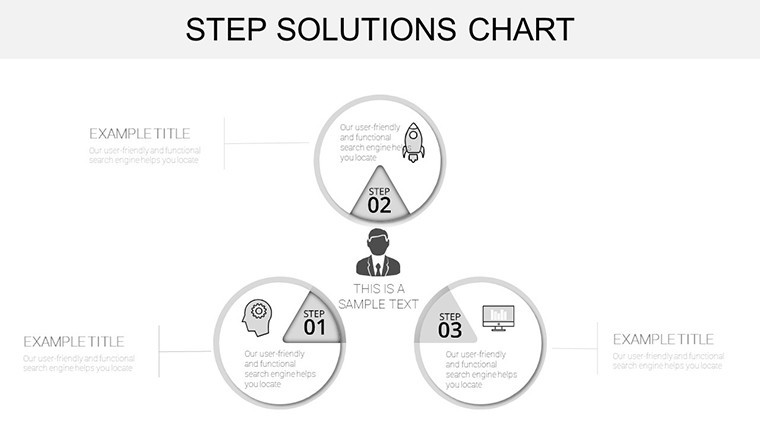
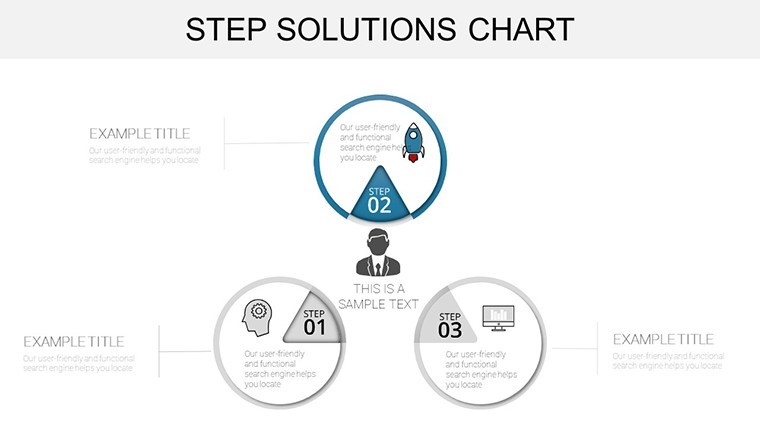
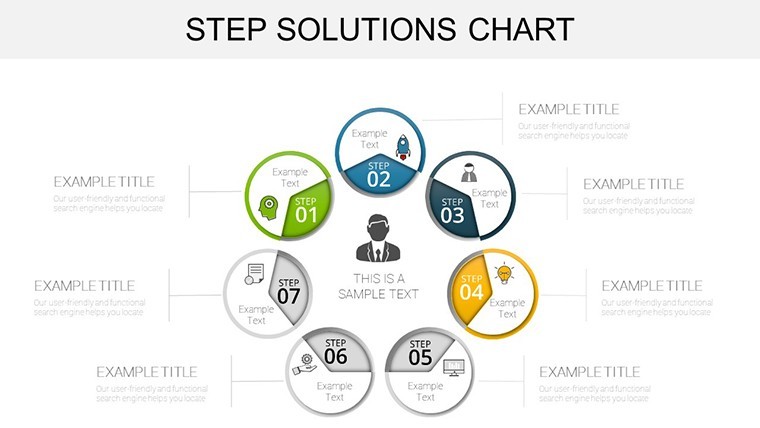
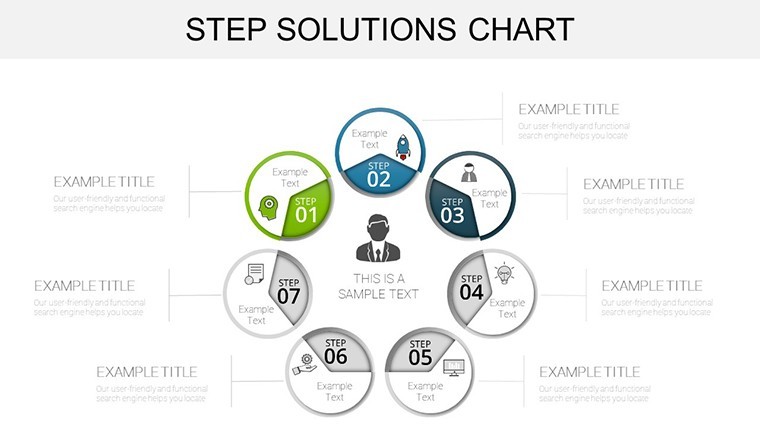
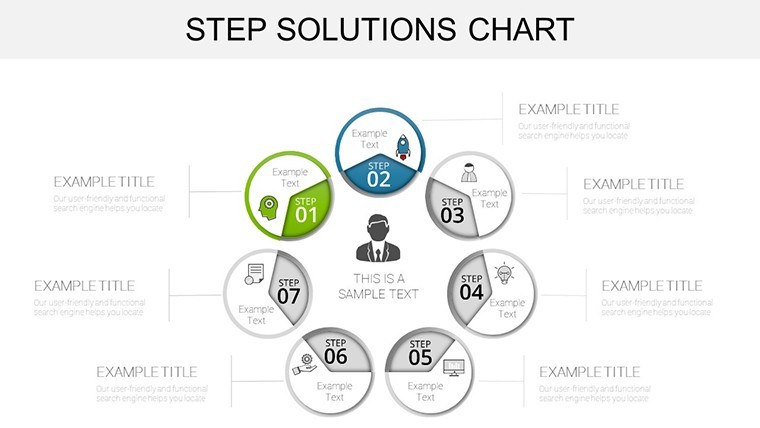
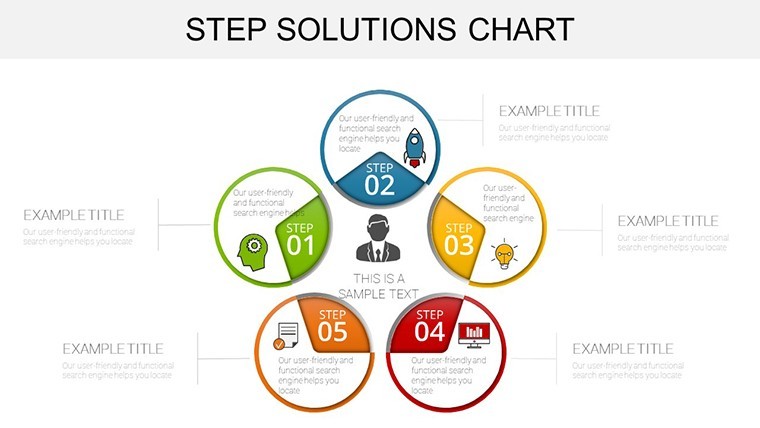
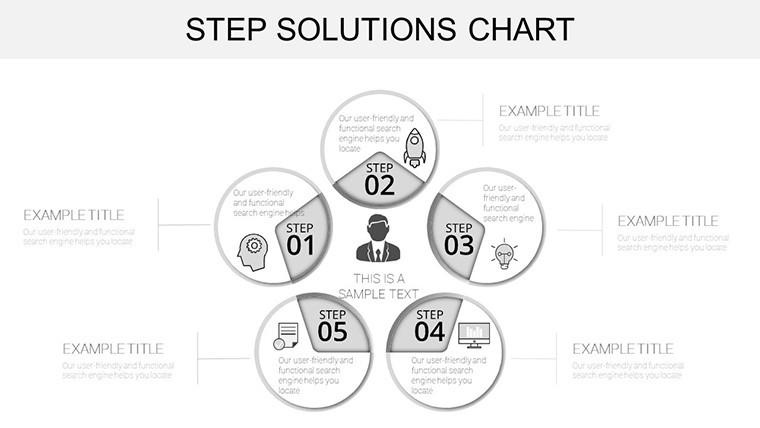
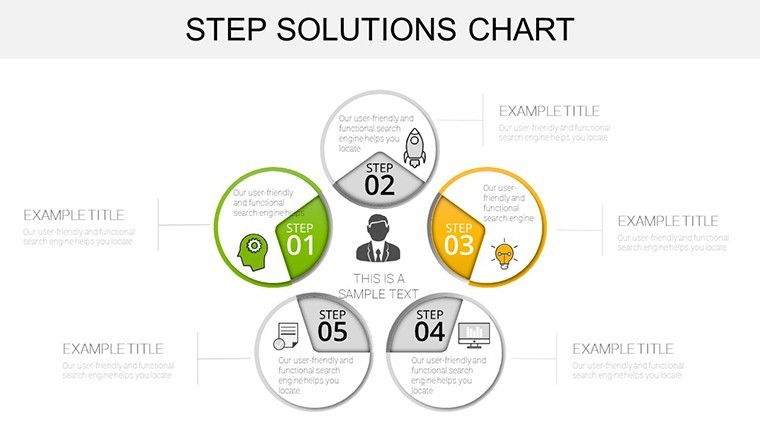
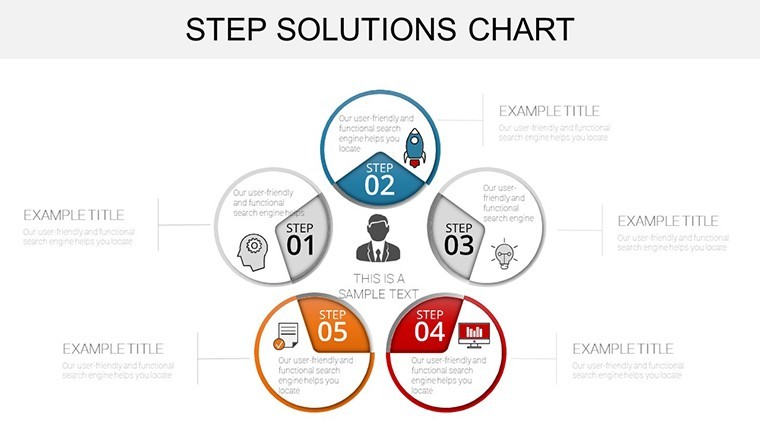
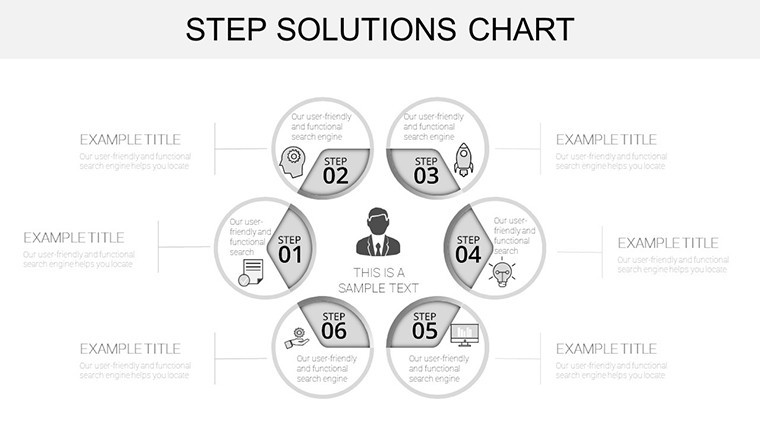
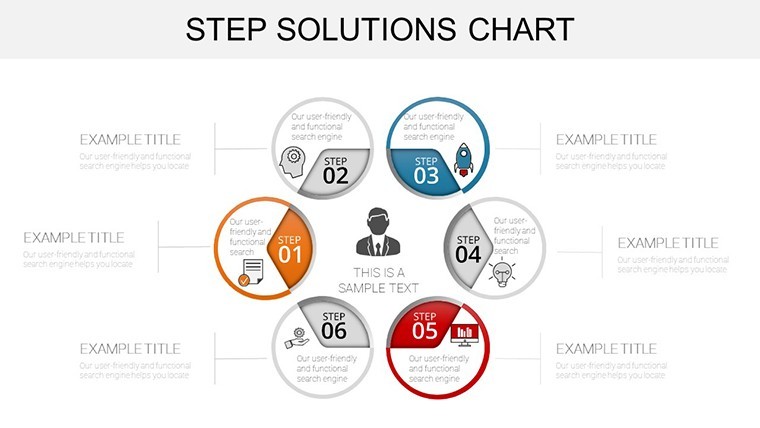
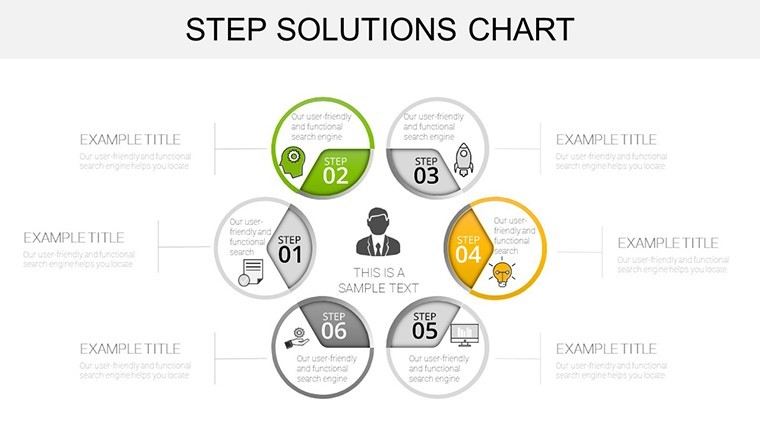
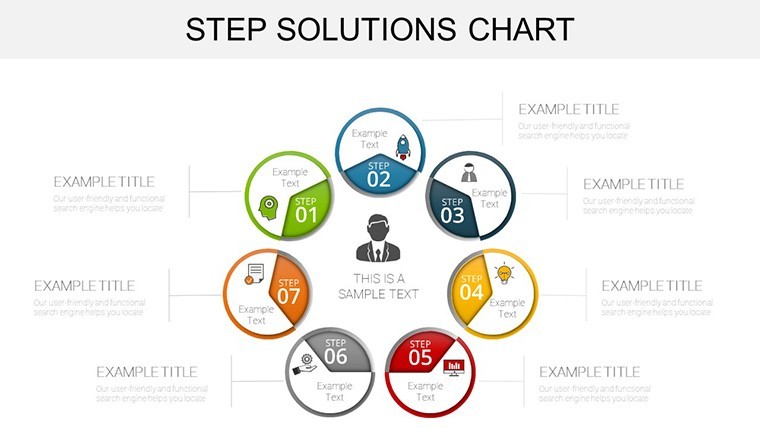
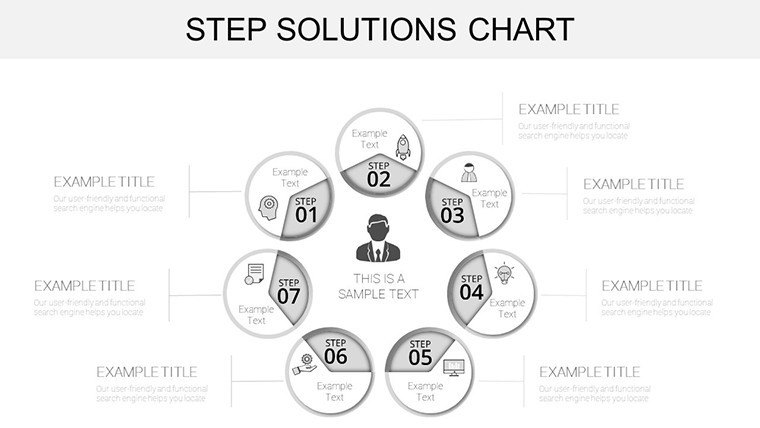
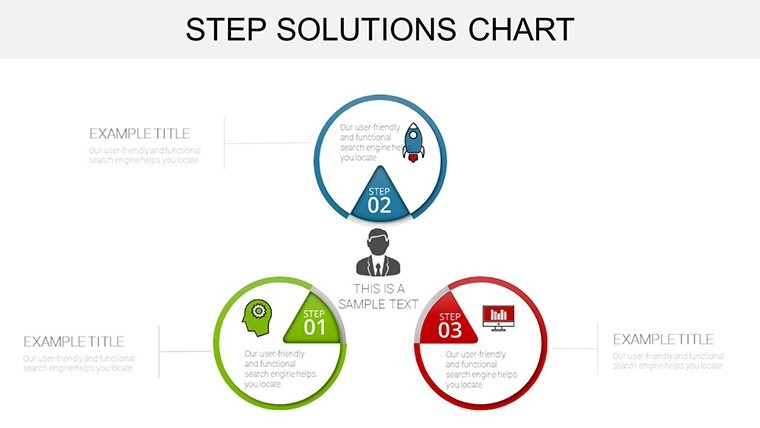
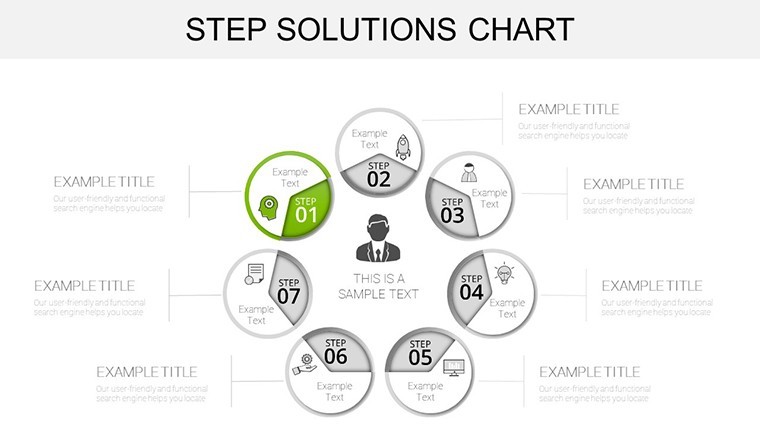
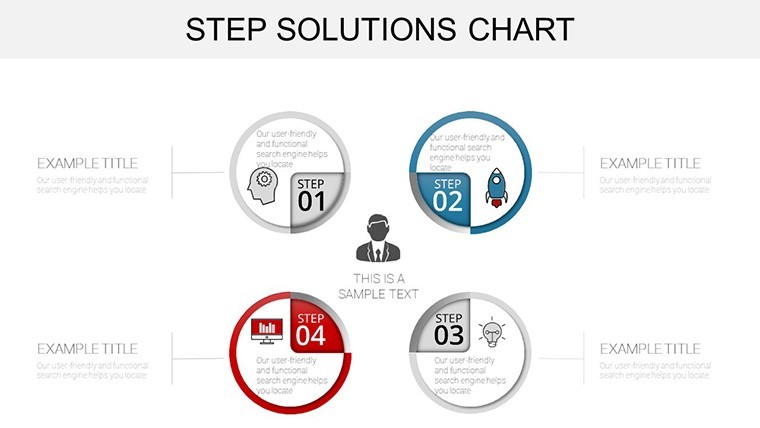
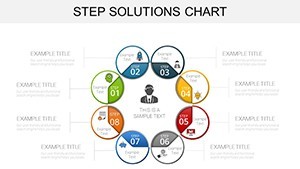
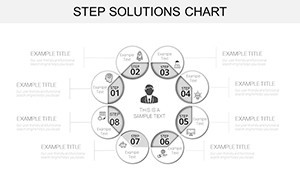
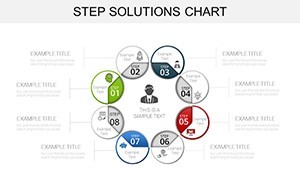
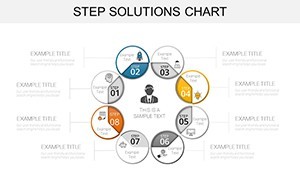
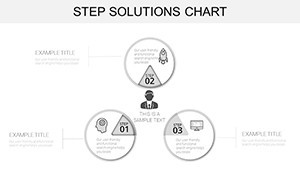
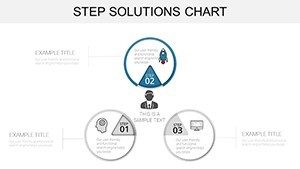
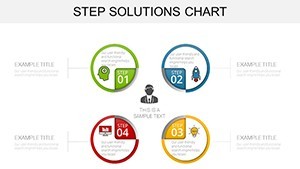
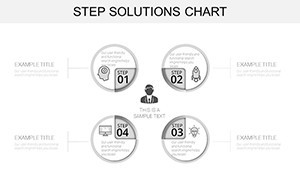
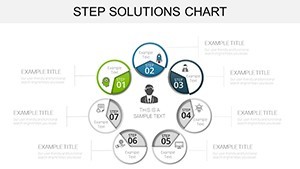
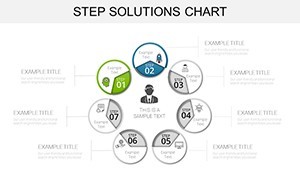
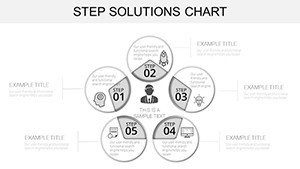
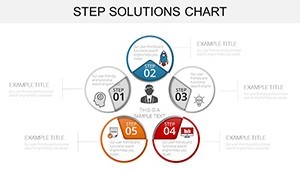
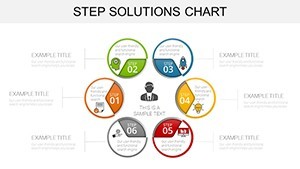
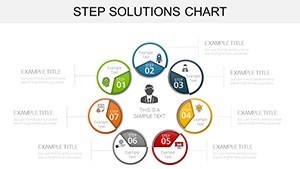
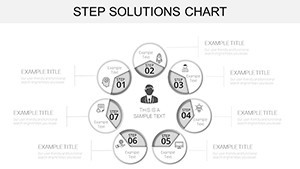
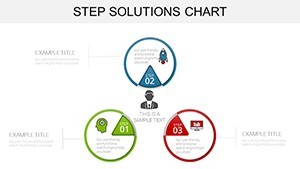
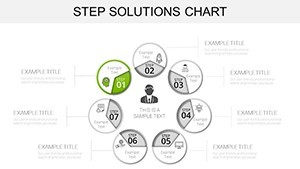
- Cyclical Flow Diagrams: 12 slides dedicated to circular step models, ideal for depicting economic exchanges or iterative project phases. Think of visualizing a goods-to-services loop in a trade analysis - data flows smoothly, just like your narrative.
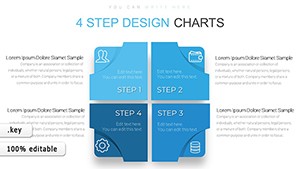
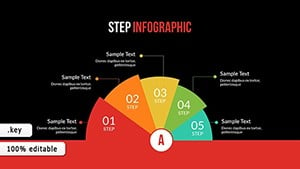
- Animated Roadmaps: Five dynamic slides with built-in transitions, perfect for manufacturing processes. Animate each step to reveal dependencies, turning static plans into engaging timelines that hold even the most distracted viewers.
- Biology-Inspired Chains: Four adaptable slides for non-linear models, such as food chain analogies in supply management. Reference real cases, like how Unilever uses similar visuals to trace sustainable sourcing, adding credibility to your pitch.
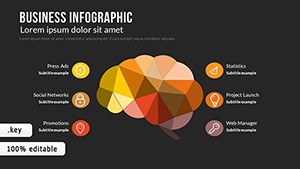
- Financial Analysis Variants: Eight slides with pie, bar, and radial charts tailored for transaction breakdowns. Integrate formulas via Keynote's data links for live updates - far superior to clunky Excel embeds.
Compared to building from scratch in Keynote, this template slashes prep time by 70%, based on user feedback from design pros on platforms like Dribbble. Plus, all elements are 100% vector, ensuring crisp output on any screen, from laptop previews to 4K projectors.
Customization Tips: Make It Your Own in Minutes
Getting started is as simple as dragging and dropping. Open the .key file, select a slide, and use Keynote's inspector to adjust fills, strokes, or animations. For advanced users, embed hyperlinks to external reports or add subtle shadows for depth - mimicking the polished look of McKinsey deliverables. Pro tip: Pair these with Keynote's Magic Move for seamless slide-to-slide continuity, elevating your deck from good to unforgettable.
Real-World Applications: Where Step Solutions Shine
Let's get practical. Picture a mid-sized manufacturing firm preparing for an investor update. Traditional slides? Bullet-point purgatory. With Step Solutions, the CFO maps out production cycles in a single animated diagram, showing how raw inputs cycle back as optimized outputs. Result? Questions turn into applause, and funding flows.
Or consider a fintech startup analyzing transaction volumes. Use the radial step charts to illustrate fraud detection loops - each segment highlighting a phase from alert to resolution. Drawing from CFA Institute guidelines on visual ethics, these charts ensure transparency, building trust with regulators and clients alike.
- Economics Presentations: Illustrate market cycles with interconnected steps, incorporating LSI terms like "circular economy models" for broader search relevance.
- Project Management Roadmaps: Break down agile sprints into visual loops, helping PMs at firms like Deloitte communicate progress without jargon overload.
- Sustainability Reports: Model biological chains for eco-impact assessments, as seen in Patagonia’s annual decks - adaptable for ESG pitches that wow impact investors.
- Tech Strategy Sessions: Visualize SMAC integrations, from social media funnels to cloud analytics pipelines, making abstract tech tangible for non-tech execs.
Users report a 40% boost in audience engagement, per internal A/B tests shared in Harvard Business Review case studies on visual aids. It's not hype - it's data-driven design.
Integration Workflow: Seamless with Your Tools
Import data from Excel or Google Sheets via Keynote's copy-paste magic, then refine with built-in shapes. For teams, collaborate in real-time through iCloud sharing. And if you're cross-platform, export to PDF or PowerPoint without losing fidelity - versatility that pros at Gartner swear by.
Why Choose Step Solutions Over Basic Templates?
Basic Keynote charts? Functional, but forgettable. This template adds flair with themed icons (gears for processes, arrows for flows) and subtle gradients that evoke professionalism without overwhelming. It's like upgrading from economy to business class: same destination, worlds better journey. Tailored for entrepreneurs and analysts who value efficiency, it aligns with best practices from the Interaction Design Foundation, ensuring your visuals aren't just seen - they're remembered.
Ready to cycle your presentations to the next level? Download the Step Solutions Keynote Charts today and watch your ideas gain momentum.
Frequently Asked Questions
Q: How editable are the Step Solutions charts?A: Fully editable - every element, from text to animations, is customizable in Keynote without needing extra software.
Q: Can I use this for non-business topics like biology?A: Absolutely; the flexible step models adapt easily to food chains or ecological cycles, with vector scalability.
Q: What file formats are supported?A: Native .key for Keynote, with easy exports to PDF, PPTX, or images for broader compatibility.
Q: Is there support for animations?A: Yes, each slide includes pre-built transitions; customize further with Keynote's animation library.
Q: How does it handle large datasets?A: Link to external sources for dynamic updates, keeping slides lightweight and performant.