Business Report Keynote Charts Template: Craft Professional Insights


Type: Keynote Charts template
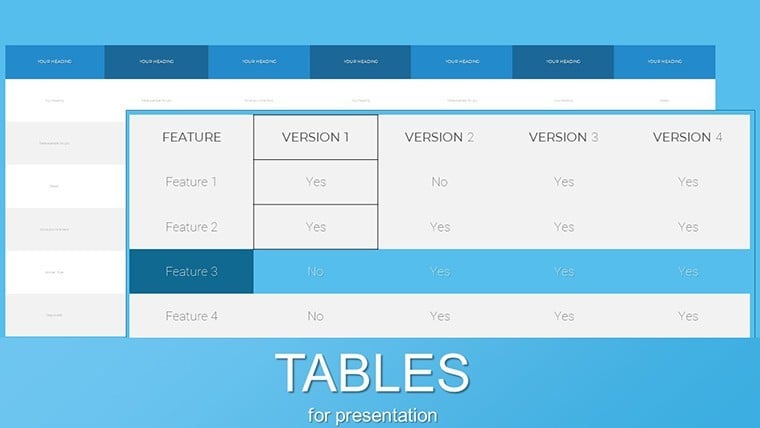
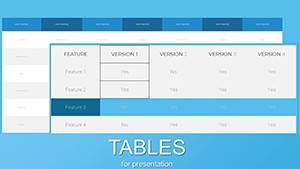
Category: Tables
Sources Available: .key
Product ID: KC00887
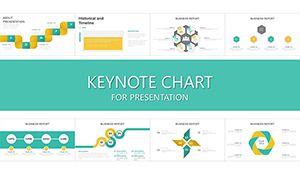
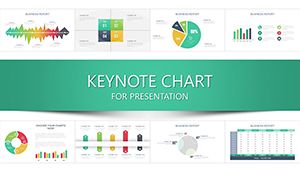
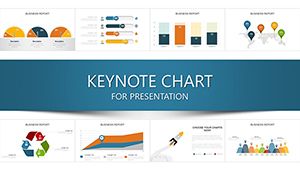
Template incl.: 19 editable slides
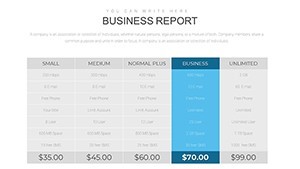
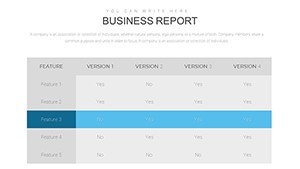
In the realm of business analytics, clear communication is key to driving decisions. Our Business Report Keynote Charts Template offers 19 editable slides, perfect for tables category users like managers and executives. Tailored for showcasing sales figures, market trends, or project timelines, it provides a user-friendly platform to turn raw data into compelling narratives. Aligned with standards from bodies like the Project Management Institute, this template ensures your reports are not only visually appealing but also strategically sound. Whether pitching to investors or reviewing quarterly performance, customize effortlessly in Keynote to match your corporate style, saving time and enhancing clarity for better outcomes.
Core Features for Business Excellence
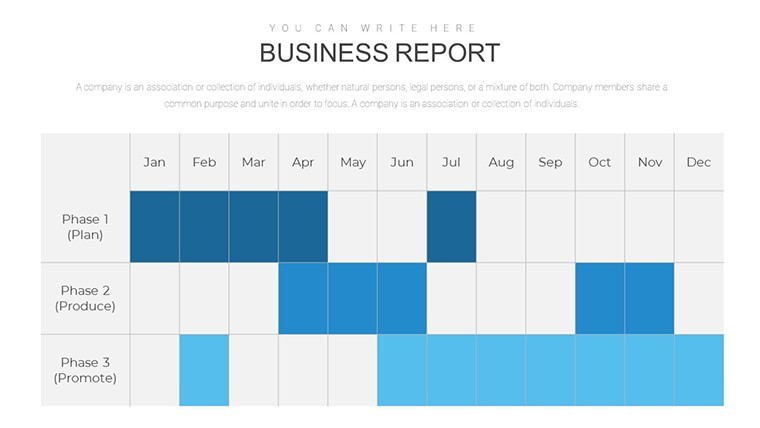
This template stands out with its array of chart types, from column graphs for revenue comparisons to Gantt charts for timelines, all designed for quick comprehension. Optimized with terms like 'financial reporting visuals,' it flows naturally for both users and search engines.
Highlighting the Advantages
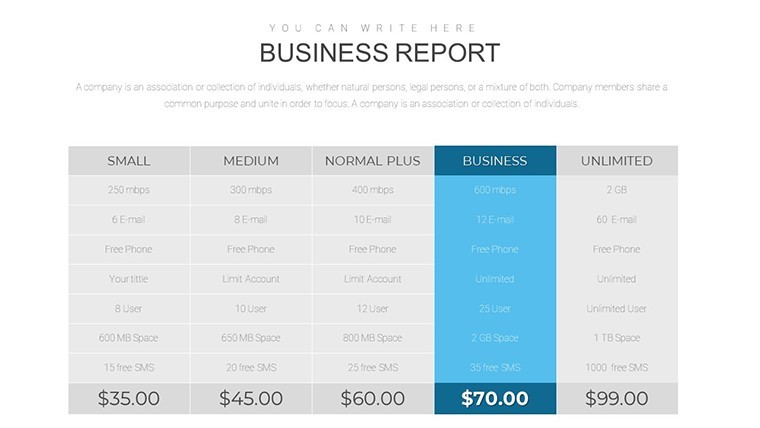
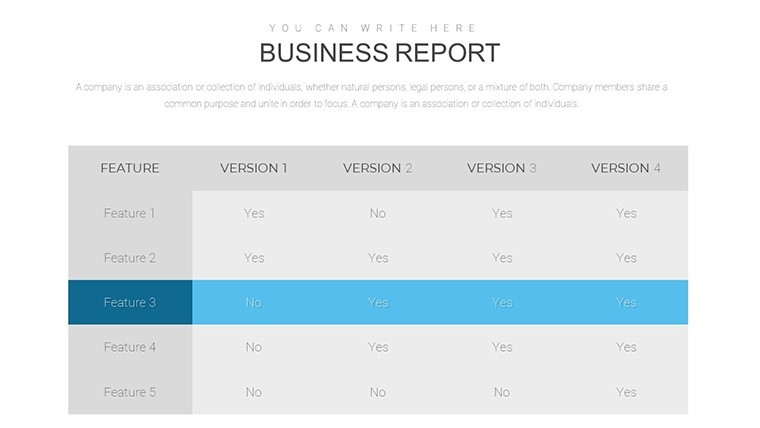
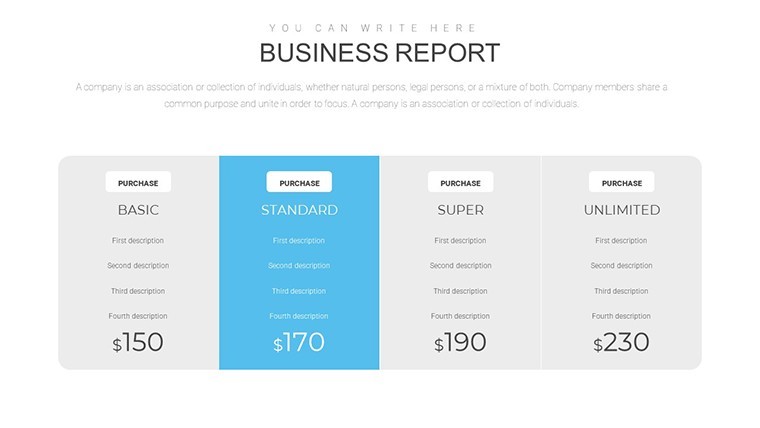
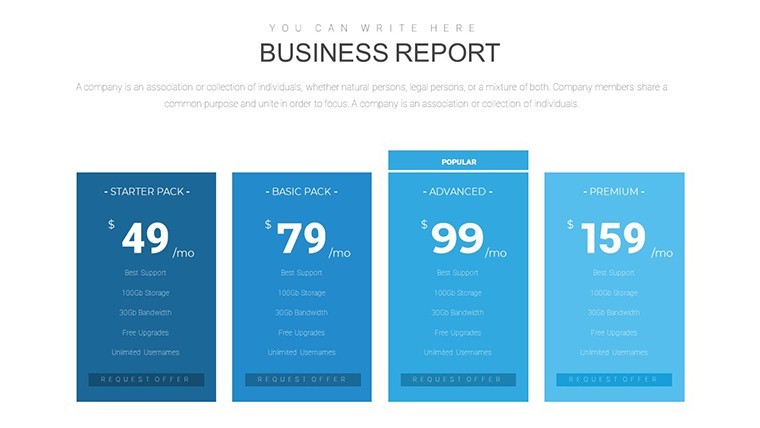
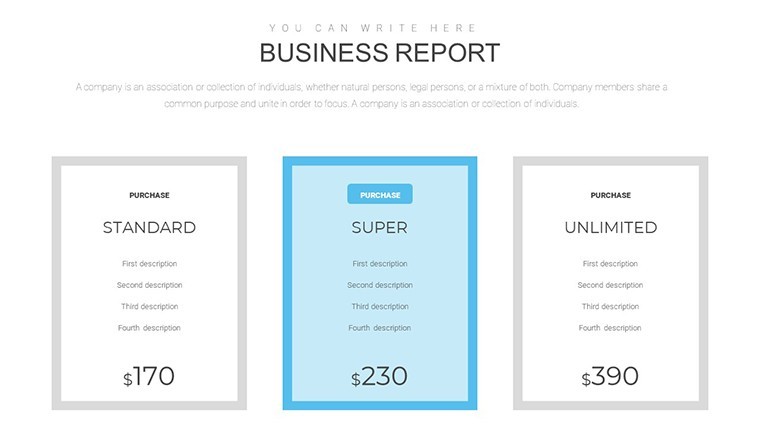
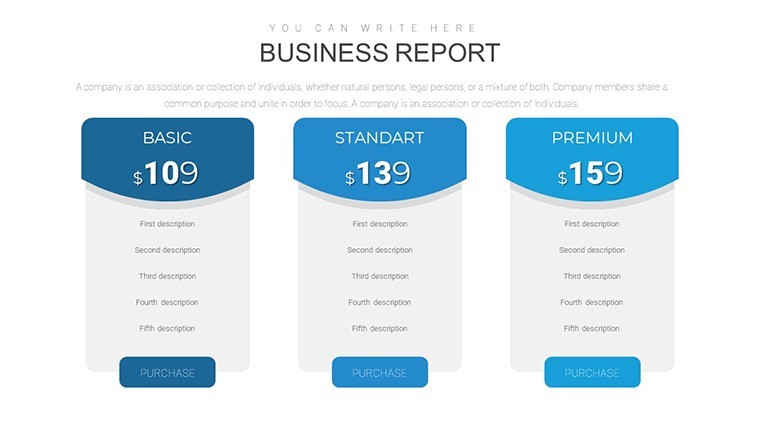
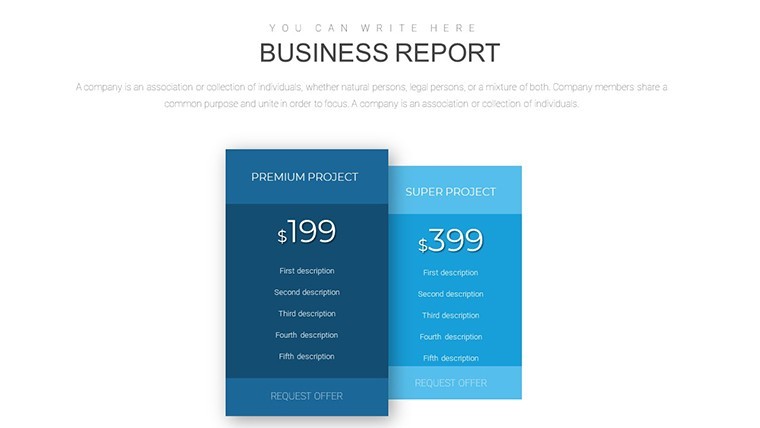
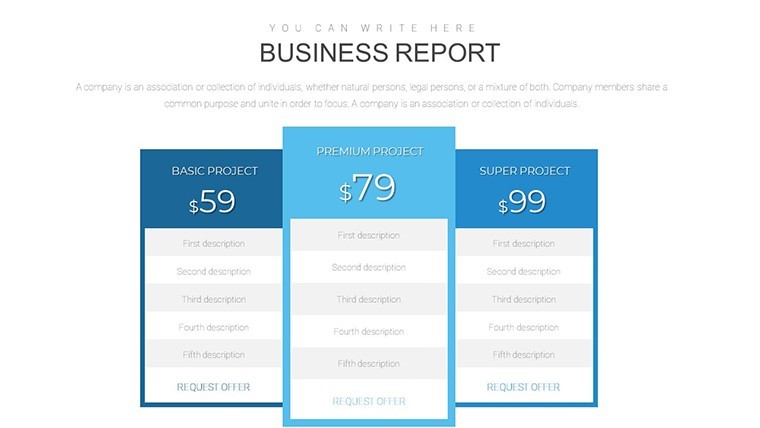
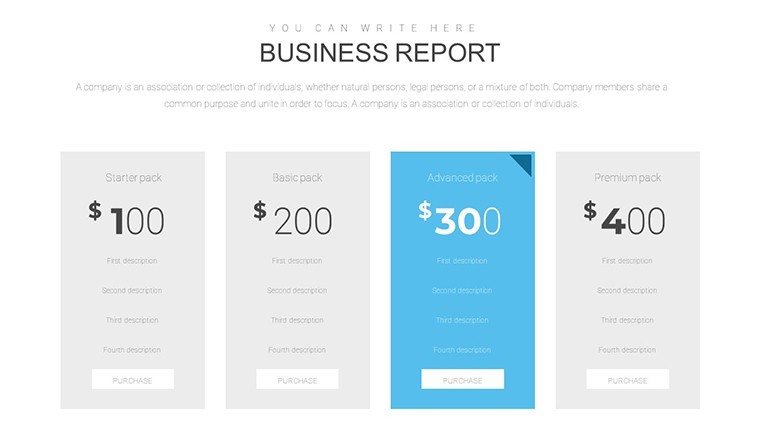
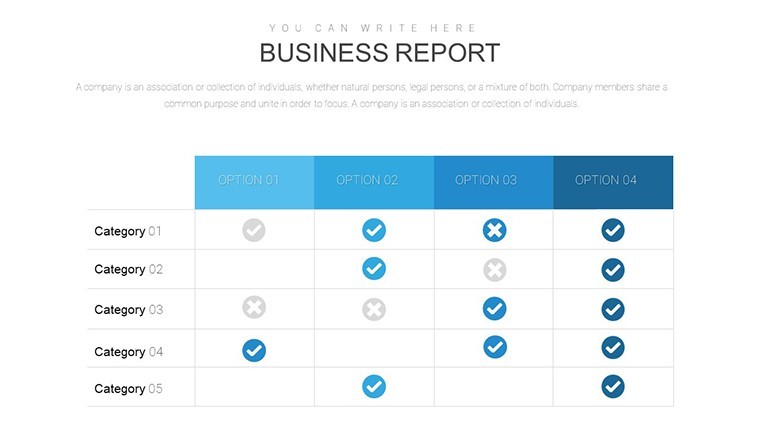
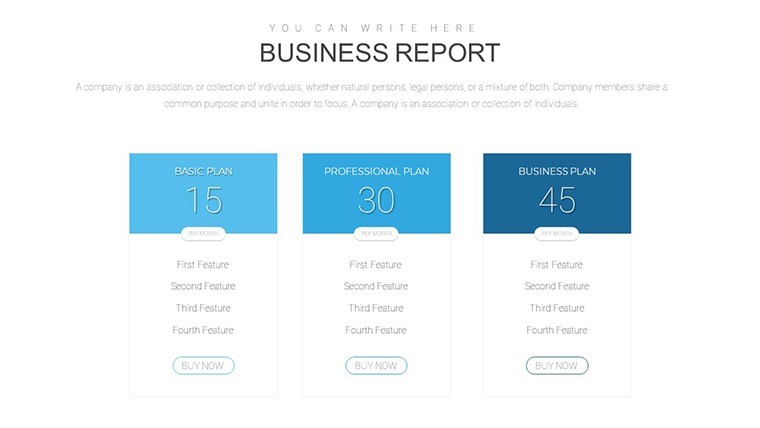
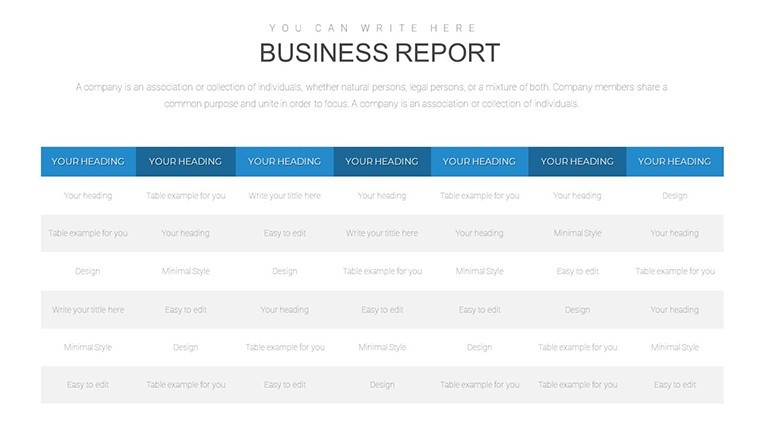
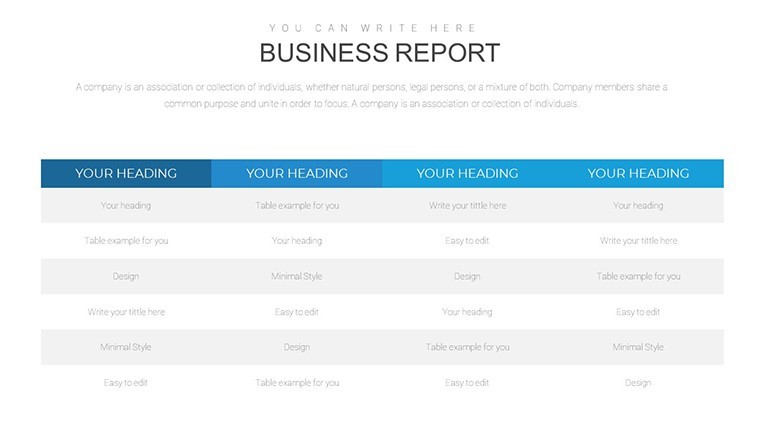
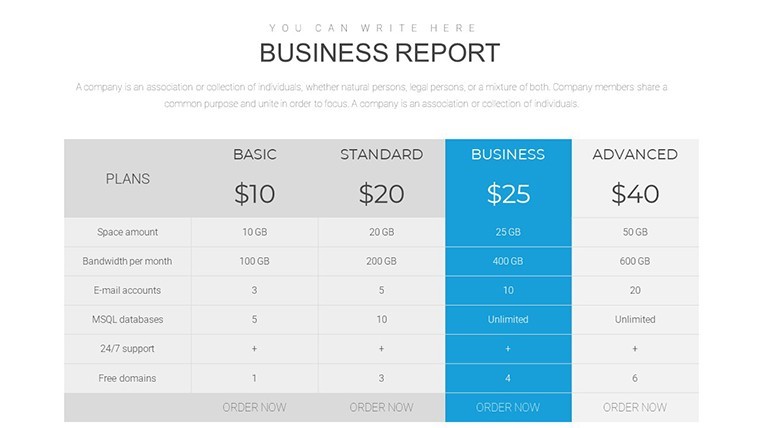
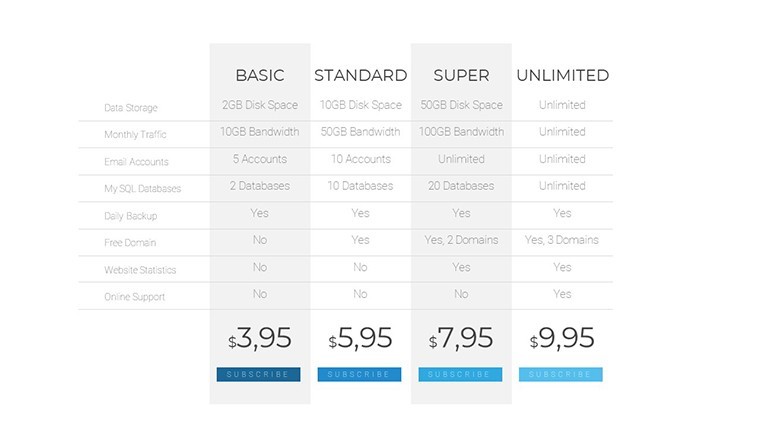
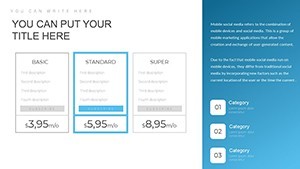
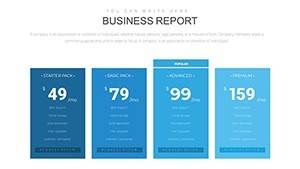
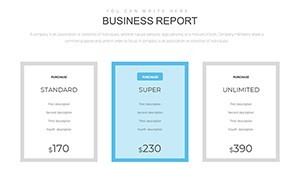
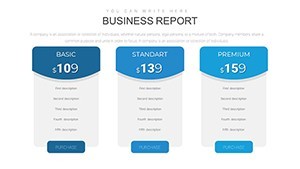
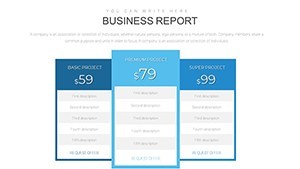
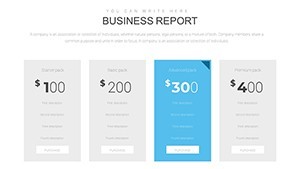
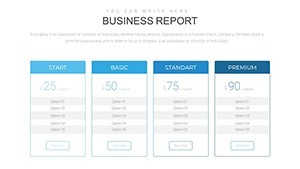
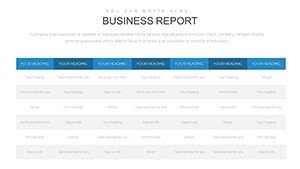
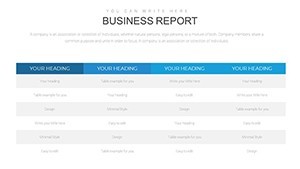
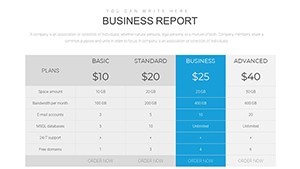
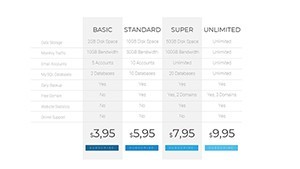
- Varied Chart Options: Includes tables, bars, and lines for diverse data representation.
- Full Customization: Alter colors and fonts to align with brand guidelines seamlessly.
- User-Friendly Design: No design expertise needed; intuitive for all levels.
- Instant Download: Access immediately to meet tight deadlines.
- Professional Polish: Elevates reports beyond basic spreadsheets.
These elements address common challenges, like making complex trends accessible, far surpassing default Keynote capabilities.
Applications in Corporate Settings
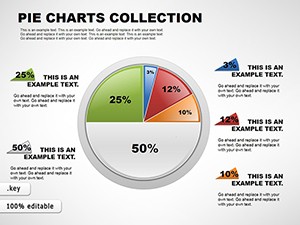
Envision a finance team using these slides to present annual budgets, with pie charts allocating resources - resulting in faster approvals. For project managers, timeline visuals track milestones, inspired by real cases from Forbes business reports.
Step-by-Step Utilization
- Download File: Get the .key and open in Keynote.
- Input Data: Populate charts with your metrics, e.g., sales growth lines.
- Personalize: Add logos or adjust layouts for emphasis.
- Present: Use transitions for smooth storytelling.
- Share Insights: Export for team collaboration.
Its edge? Integrated tables for data summaries, streamlining reports.
Insights from a Business Analyst
Weave stories around data - use area charts to depict market share evolution, citing McKinsey insights. Maintain trust with accurate sourcing; keep designs clean for mobile viewing. Add subtle wit, like noting 'trend lines that don't lie,' to engage.
A startup exec customized for investor decks, boosting funding success. Value: Professionalism that positions you as an authority.
Upgrade Your Reporting Arsenal
Ready for impactful reports? Download this template to deliver data-driven excellence confidently.
Frequently Asked Questions
How many slides are included?
19 fully editable slides for comprehensive reporting.
Compatible with iPad Keynote?
Yes, optimized for iOS and Mac.
Suitable for financial analysis?
Perfect, with charts for trends and figures.
File format details?
.key, ready for Keynote editing.
Can I resell the template?
No, for personal/business use only.