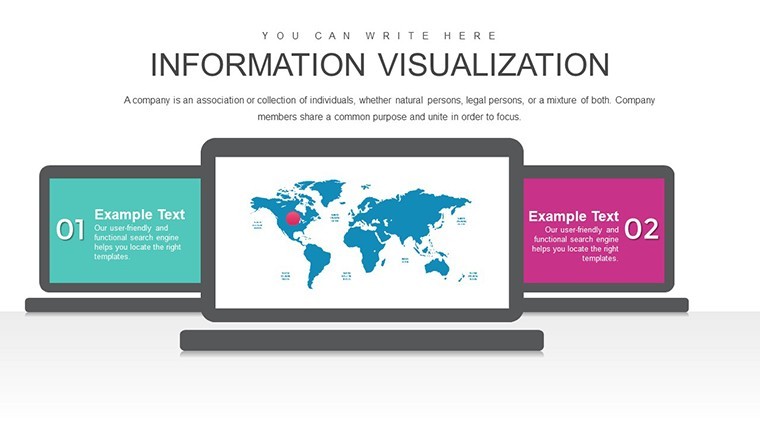
Information Visualization Keynote Charts for Marketing Mastery


Type: Keynote Charts template
Category: Analysis
Sources Available: .key
Product ID: KC00876
Template incl.: 32 editable slides
In the fast-paced world of marketing, where data drives decisions, the Information Visualization Keynote Charts Template emerges as a game-changer. With 32 meticulously crafted editable slides, this template is engineered to help you dissect and display market behaviors, consumer trends, and research findings with unparalleled clarity. Gone are the days of dense spreadsheets overwhelming your audience; instead, embrace a systematic approach that turns raw information into actionable insights. Targeted at marketing researchers, analysts, and strategists, it addresses the core need for visual simplicity in complex studies. Whether you're exploring customer journeys, segmenting audiences, or forecasting trends, these slides provide the tools to visualize relationships and patterns effectively. Drawing from principles in data visualization championed by experts like Edward Tufte, this template minimizes clutter and maximizes impact, ensuring your presentations not only inform but also persuade. Its benefits extend to saving hours on design, fostering better team collaborations, and ultimately driving data-informed strategies that boost ROI. Perfect for agency pitches, internal reports, or academic seminars, it integrates seamlessly into your workflow, making sophisticated analysis accessible and engaging.
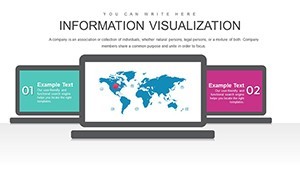
The Power of Systematic Visualization in Marketing
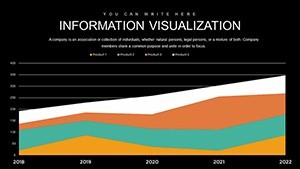
Marketing research thrives on understanding behaviors, and visualization is key to that. This template employs tables and charts that allow for layered data representation, such as cross-tabulations for demographic insights or heat maps for engagement patterns. Unlike generic tools, it focuses on marketing-specific needs, incorporating elements like funnel diagrams for conversion tracking or bubble charts for competitive positioning. The neutral yet professional color schemes - subtle blues and grays - ensure focus remains on the data, adhering to best practices from the International Institute for Information Design (IIID). For example, in a consumer behavior study, you might use a slide to map purchase influences, revealing correlations that text alone couldn't convey. This methodical design promotes deeper analysis, helping uncover hidden opportunities or risks in market dynamics.
Essential Features for Data-Driven Presentations
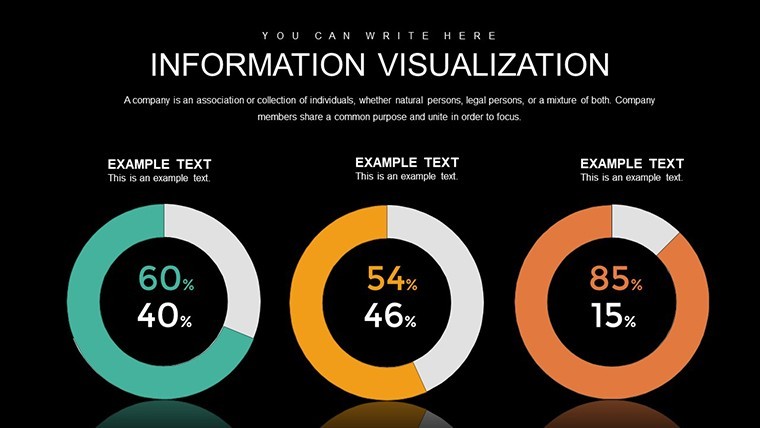
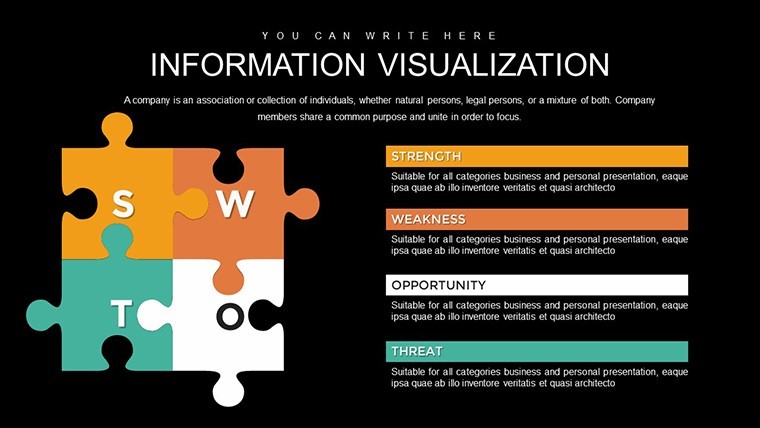
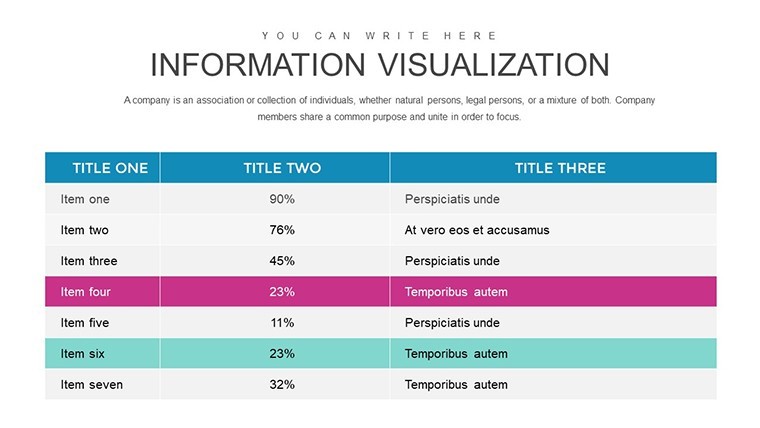
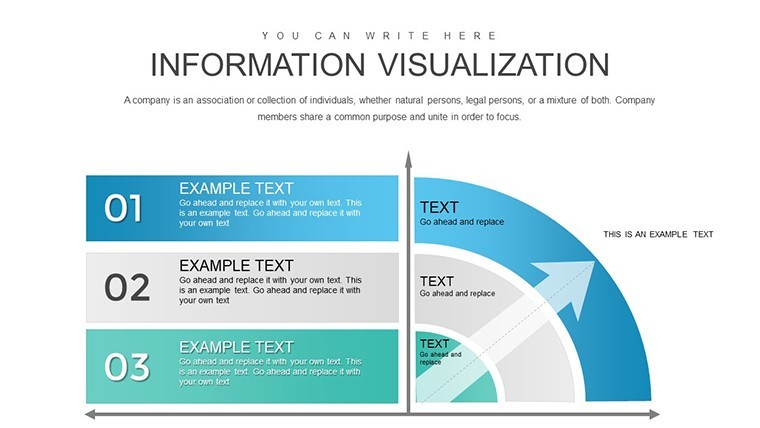
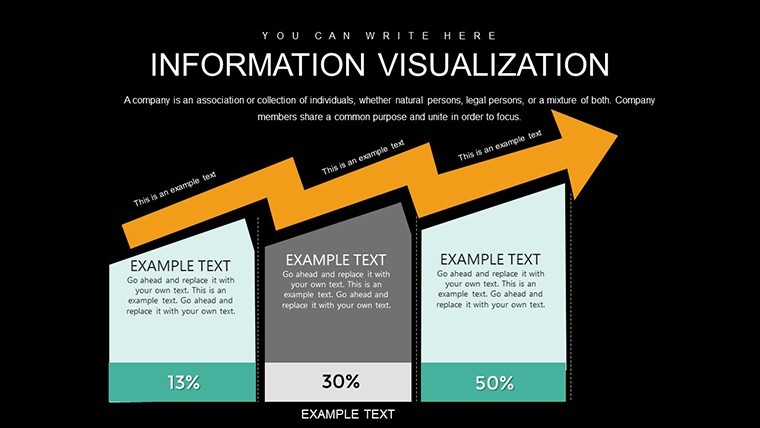
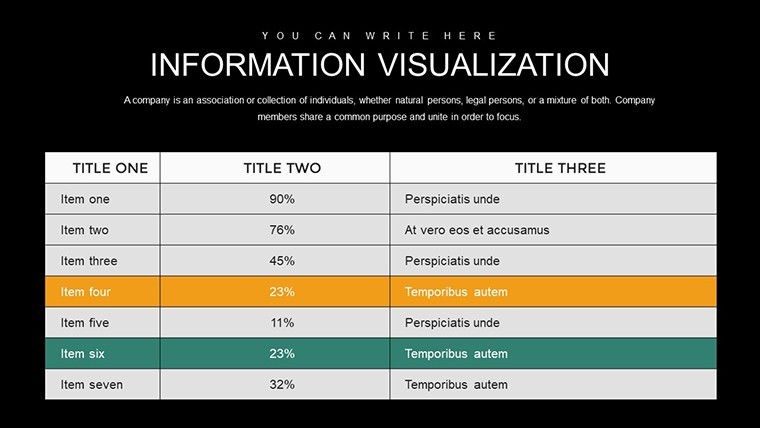
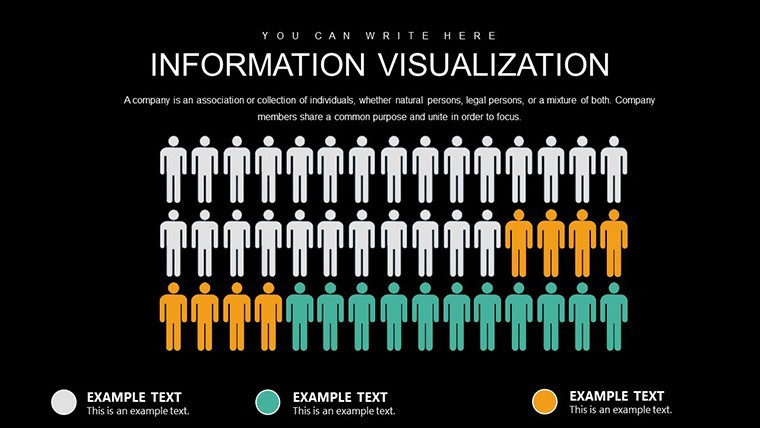
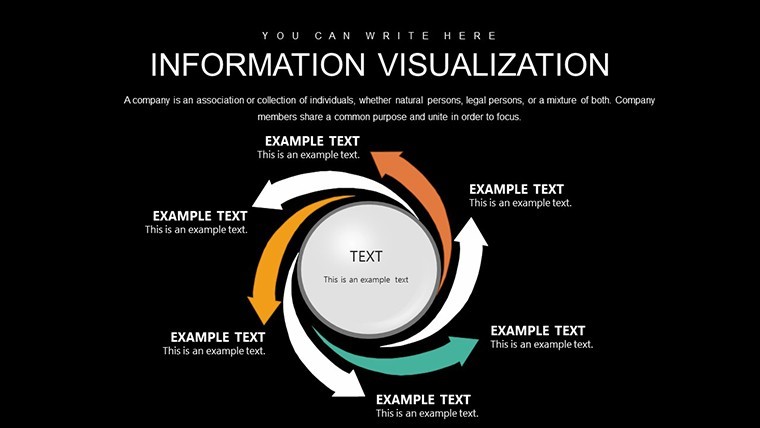
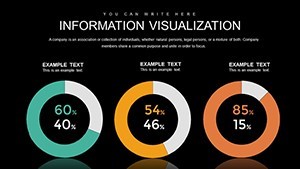
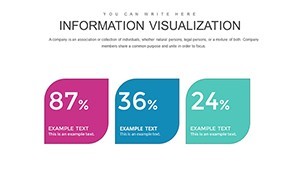
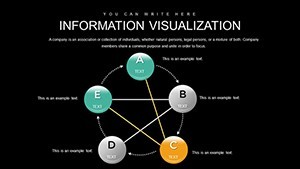
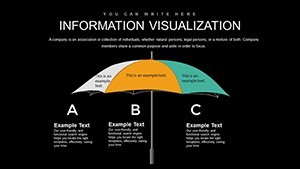
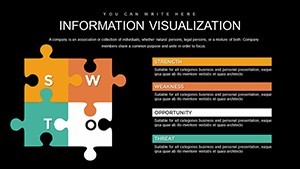
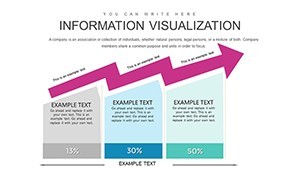
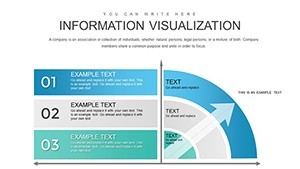
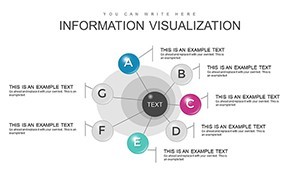
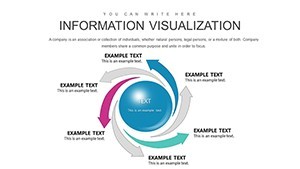
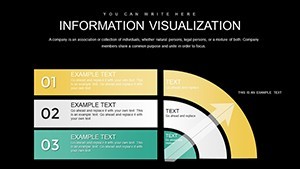
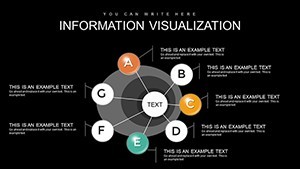
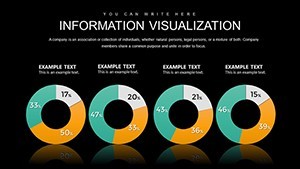
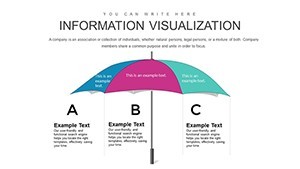
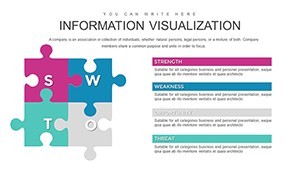
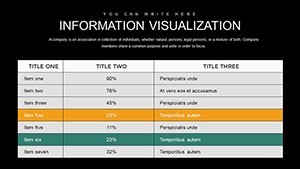
Built for versatility, the 32 slides cover a spectrum of visualization needs. Key features include fully customizable tables with sortable columns, dynamic graphs that update with data inputs, and modular layouts for easy rearrangement. High-fidelity elements ensure scalability without loss of quality, ideal for print or digital sharing. The template supports integration with data sources like Excel, allowing live updates during presentations. Standout components: matrix charts for SWOT analyses, tree maps for hierarchical data like product categories, and radar charts for multi-variable comparisons such as brand perceptions.
In-Depth Slide Overviews
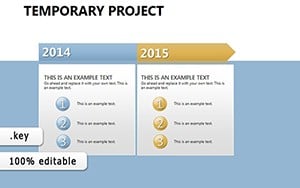
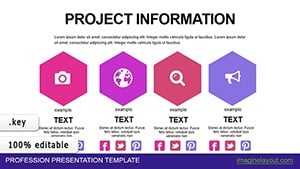
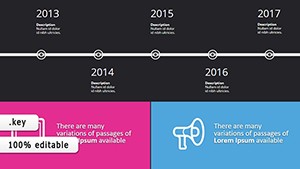
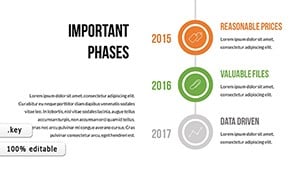
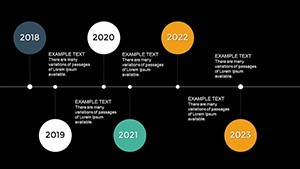
- Foundation Slides (1-8): Introductory overviews, methodology explanations, and basic tables for raw data entry.
- Core Analysis Slides (9-20): Advanced charts for trend spotting, correlations, and segmentation visuals.
- Comparative Slides (21-28): Side-by-side tables and graphs for A/B testing or competitor benchmarks.
- Summary Slides (29-32): Executive summaries, key takeaways, and recommendation charts.
Each category builds on the last, creating a narrative arc in your presentations.
Practical Use Cases with Proven Outcomes
Real-world applications abound. A digital marketing agency used similar visualization tools to present campaign performance, resulting in a 30% client retention increase, as noted in case studies from HubSpot. Researchers in academia leverage these for publishing findings, where clear visuals enhance peer review acceptance. For businesses, it's invaluable in quarterly reviews, spotlighting sales funnels or customer satisfaction metrics. Step-by-step: Start by importing data, select a chart type, customize axes and legends, then rehearse transitions. Tips include using annotations for emphasis and avoiding overcharting to prevent cognitive overload, per cognitive load theory.
Workflow Integration Tips
- Import datasets from CSV or Excel into Keynote.
- Choose visualization based on data type - e.g., lines for trends.
- Apply filters for interactive elements if presenting digitally.
- Export to PDF for handouts or share via iCloud.
- Iterate based on feedback for refined versions.
These practices ensure your marketing insights land with precision.
Technical Compatibility and Optimization Strategies
Compatible with recent Keynote versions, this template excels in cross-device use, from MacBooks to iPads. It surpasses basic Apple templates with specialized marketing foci, like built-in legends for quick interpretations. Optimize by adhering to data ink ratio principles - remove non-essential elements for cleaner visuals. For trustworthiness, cite sources within slides, enhancing in professional contexts.
Transform Your Data into Decisions Now
Step up your marketing game with the Information Visualization Keynote Charts Template. It's more than slides - it's a catalyst for insightful, influential presentations. Download today and turn data chaos into strategic clarity.
Frequently Asked Questions
What types of data visualizations are included?
Tables, graphs, funnels, and matrices tailored for marketing analysis.
Is the template fully customizable?
Yes, edit data, colors, and layouts effortlessly in Keynote.
Who is this template best for?
Marketing researchers, analysts, and professionals handling data reports.
Does it support data imports?
Absolutely, compatible with Excel and CSV for seamless integration.
Are there any animation features?
Basic transitions are included, with options to add more.