Dollars Puzzles Keynote Charts: Decode Economic Influences with Visual Mastery


Navigating the intricate world of economics demands tools that clarify rather than complicate. Enter our Dollars Puzzles Keynote template, boasting 36 editable slides crafted to illustrate the profound effects of money on global economies and fluctuating exchange rates. Tailored for economists, financial analysts, and educators, this infographic powerhouse transforms dense data into puzzle-like visuals that reveal connections between currency quotes, political shifts, and market forces. Fully compatible with Apple Keynote, it allows effortless customization on your devices, ensuring your presentations resonate with clarity and creativity. Forget static charts; embrace interactive elements that engage audiences, whether in boardrooms or classrooms, helping you convey how economic indicators interlock like puzzle pieces to form the bigger picture.
Exploring Economic Dynamics Through Innovative Infographics
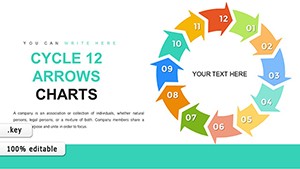
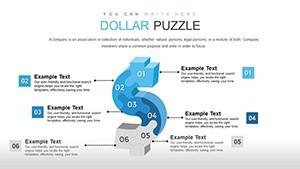
The economy is a vast puzzle, with pieces influenced by everything from interest rates to geopolitical events. Our template's puzzle-themed charts make these relationships tangible - for example, use slide 8's interlocking segments to show how inflation puzzles with consumer spending. This approach not only aids understanding but sparks discussions, drawing from real-world scenarios like the 2022 currency fluctuations amid global supply chain disruptions.
Standout Features for Financial Storytelling
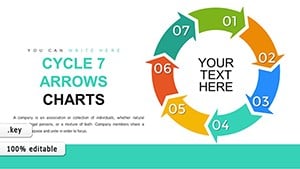
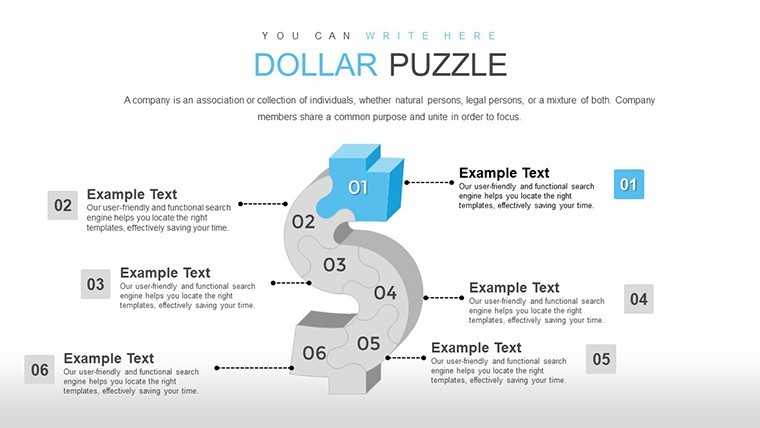
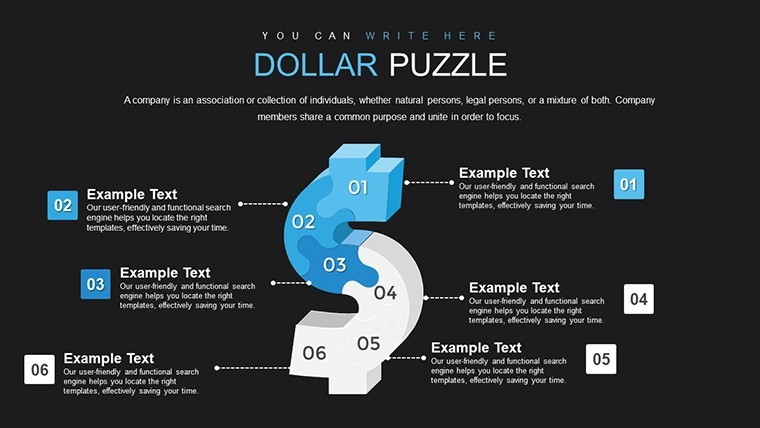
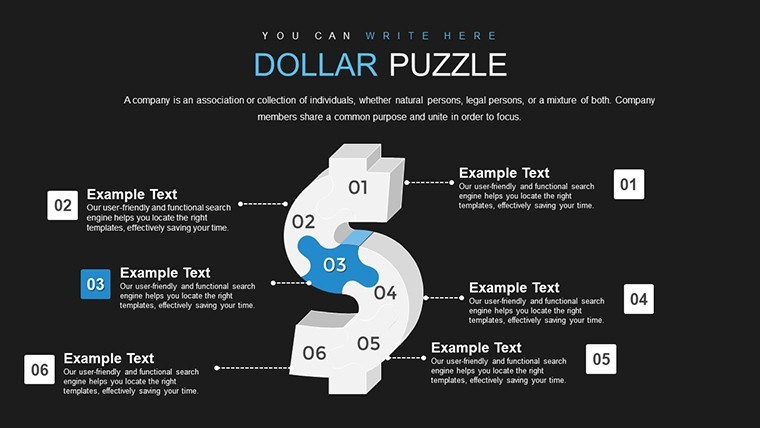
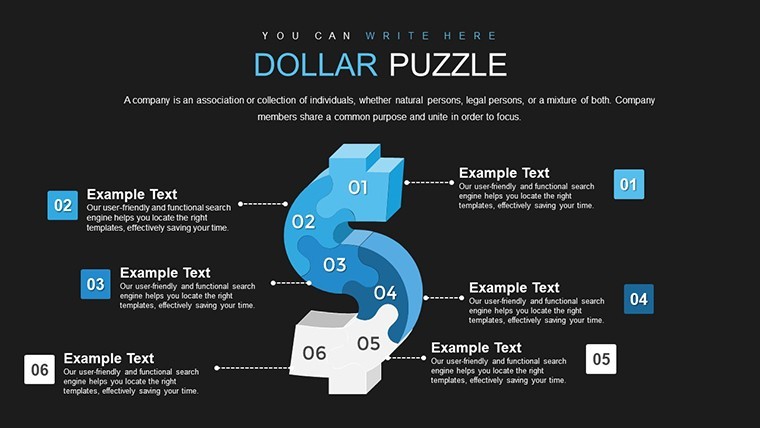
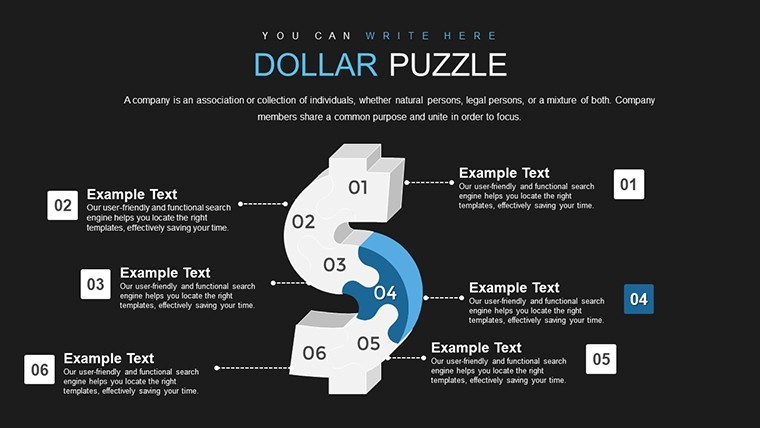
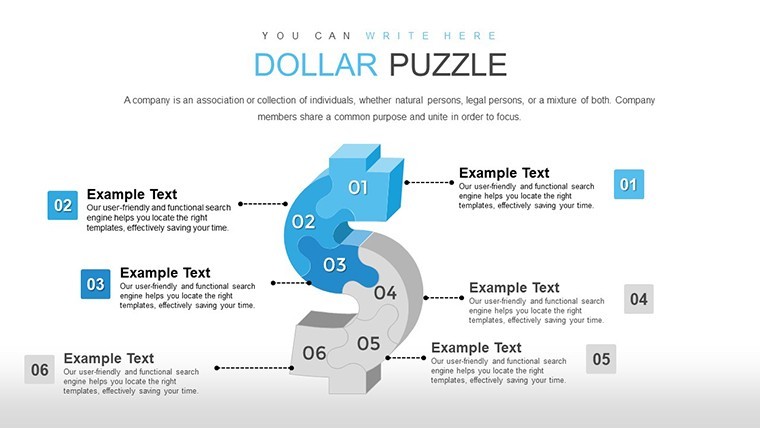
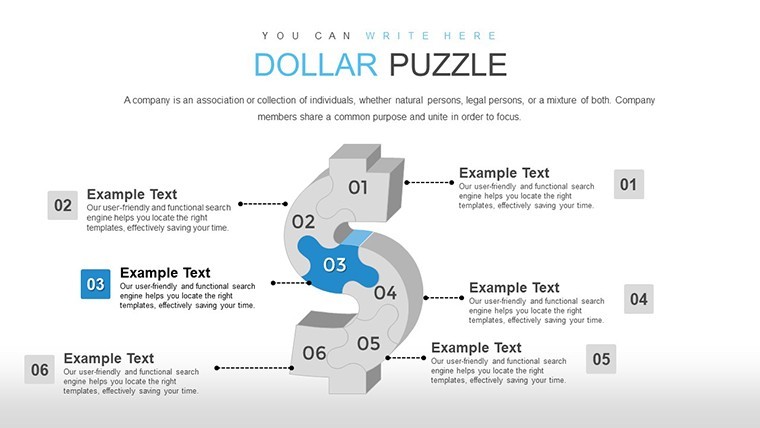
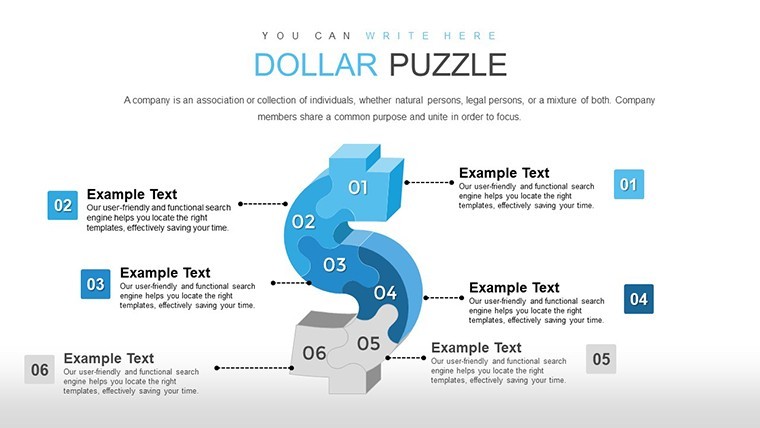
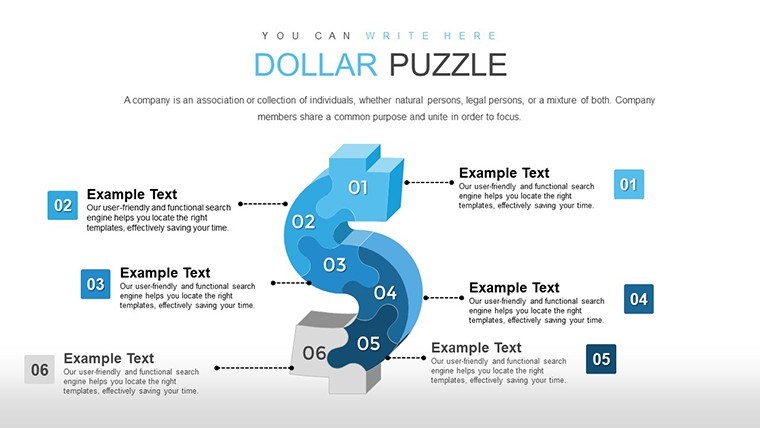
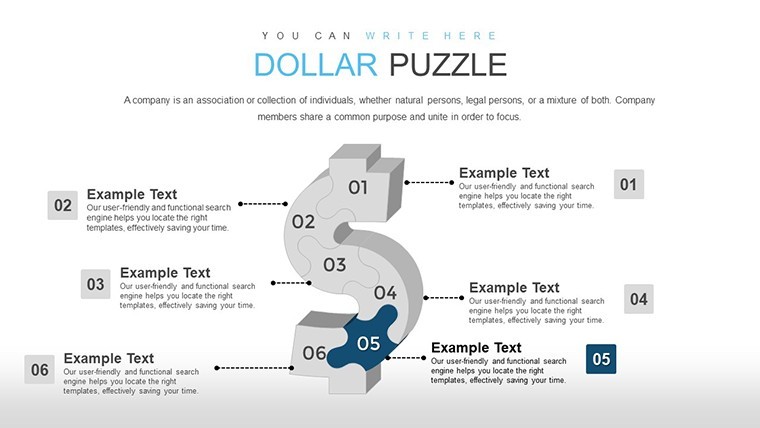
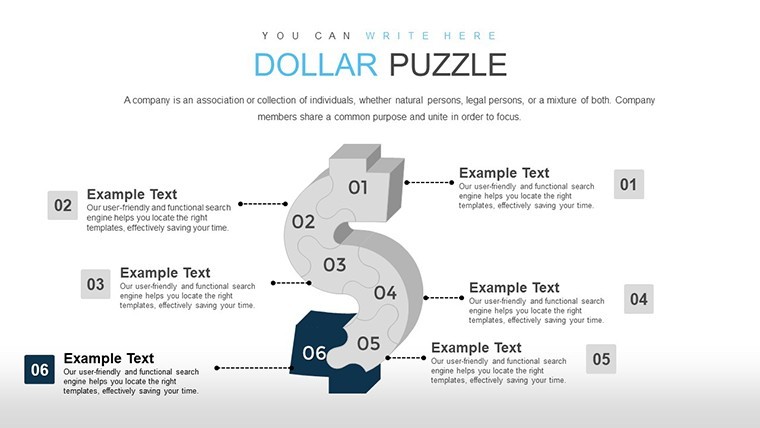
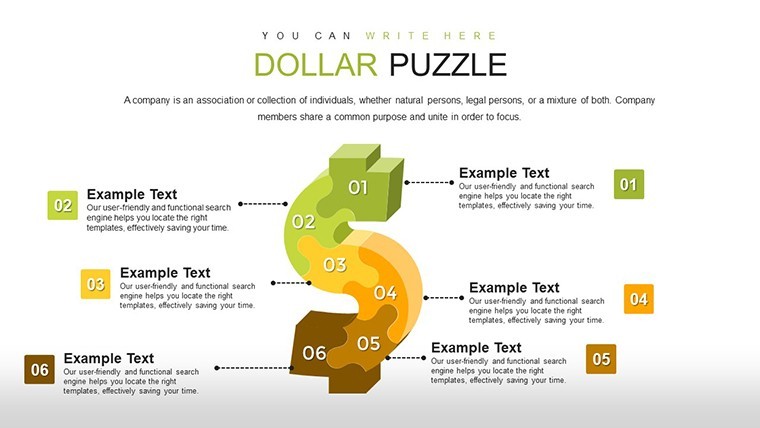
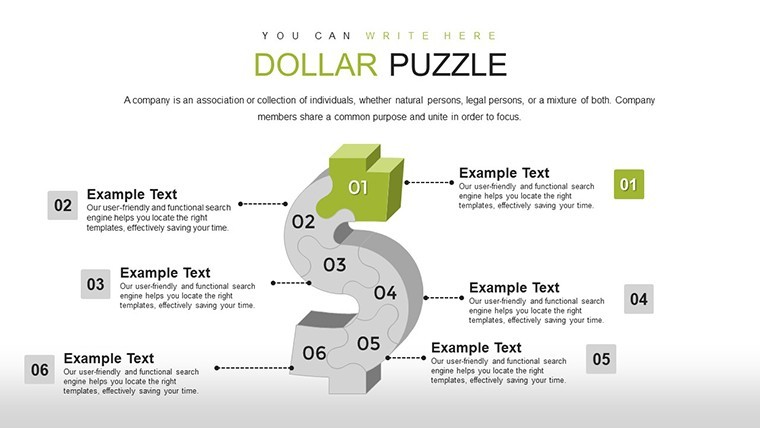
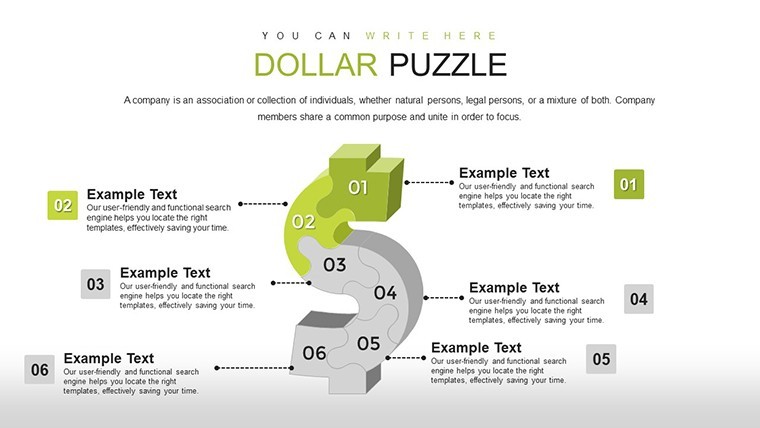
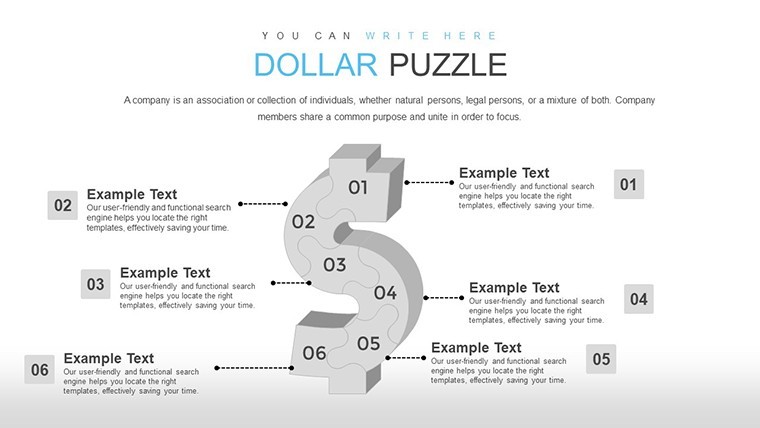
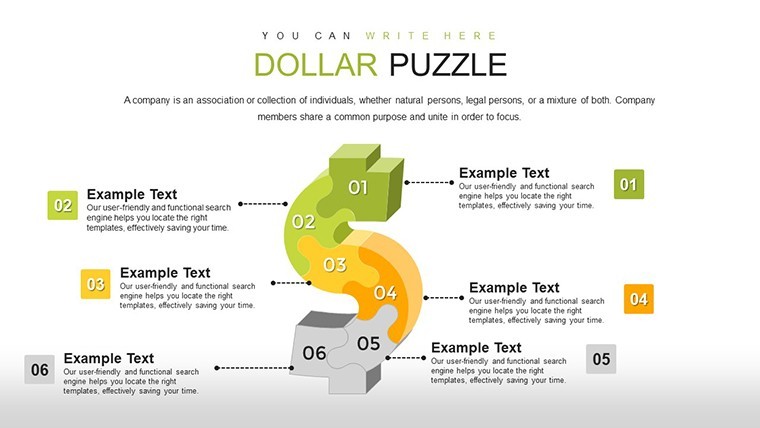
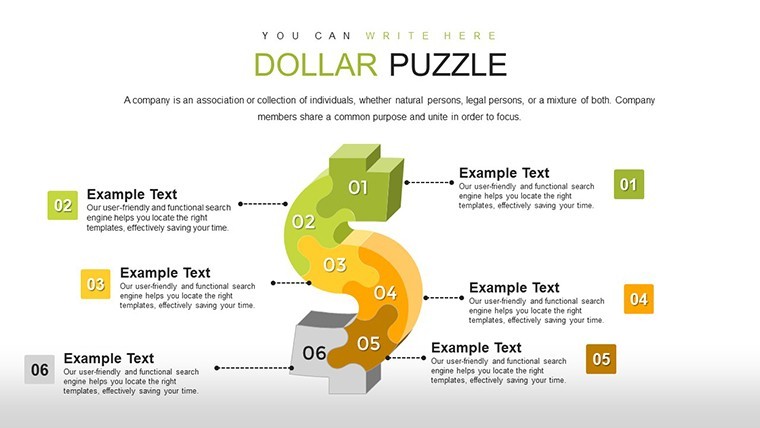
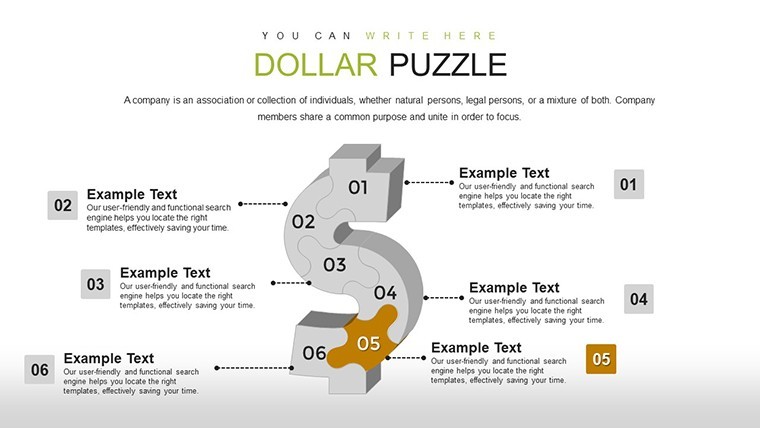
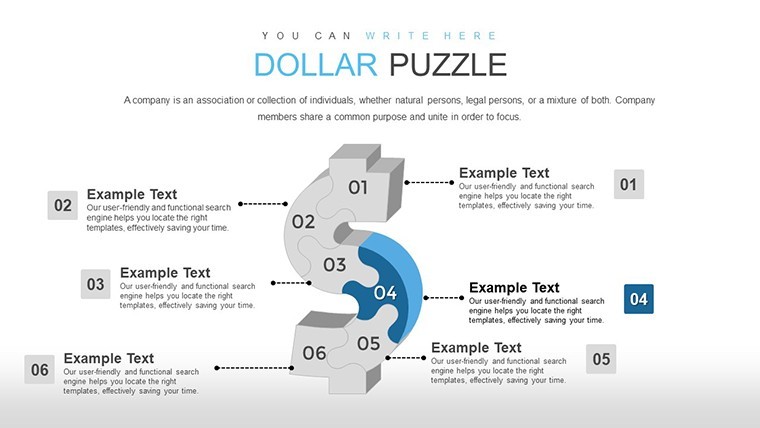
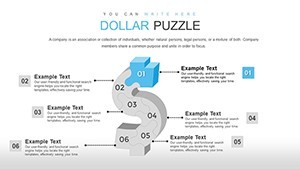
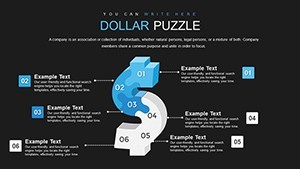
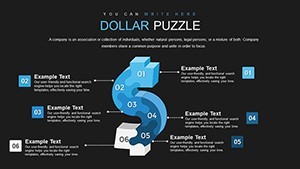
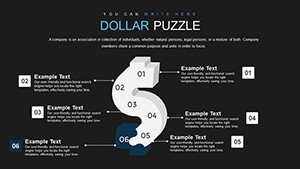
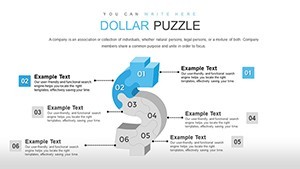
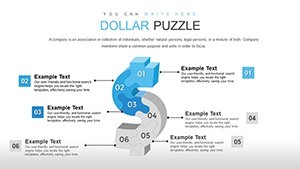
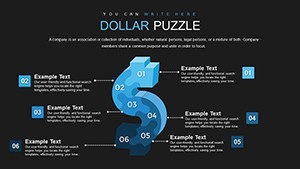
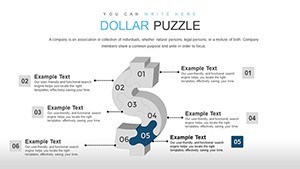
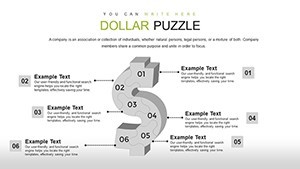
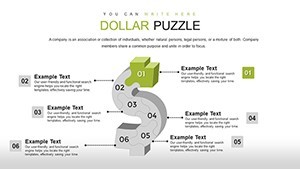
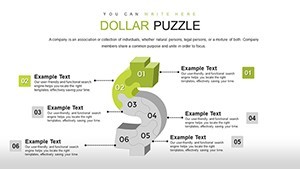
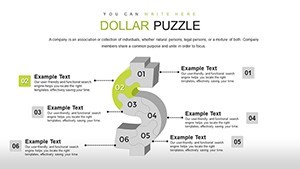
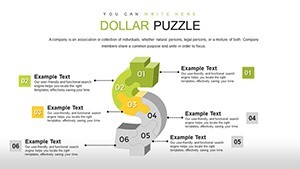
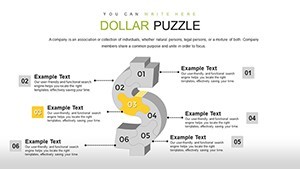
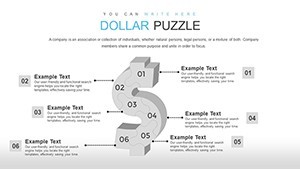
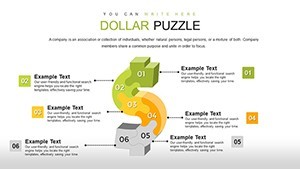
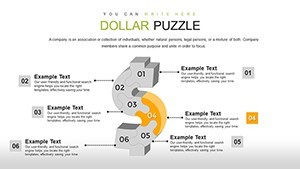
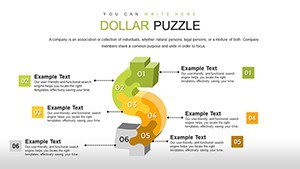
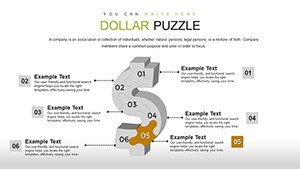
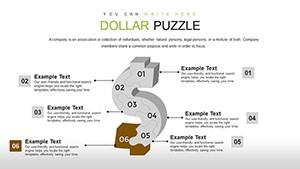
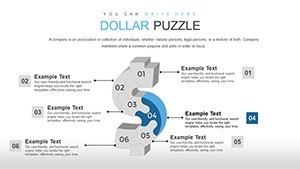
- 3D Puzzle Elements: Add depth to your visuals, making abstract concepts like currency devaluation pop off the screen.
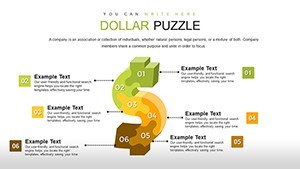
- Bright Color Palettes: Energize your slides with vibrant schemes that highlight key economic factors without overwhelming.
- Editable Illustrations: Swap in your data to customize puzzles representing fiscal policies or trade balances.
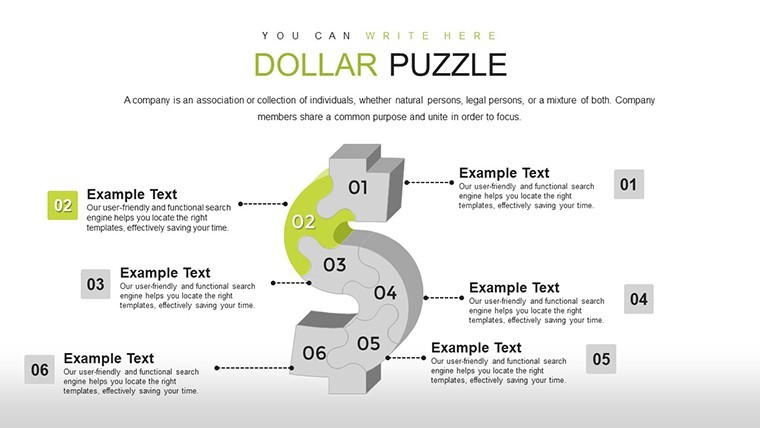
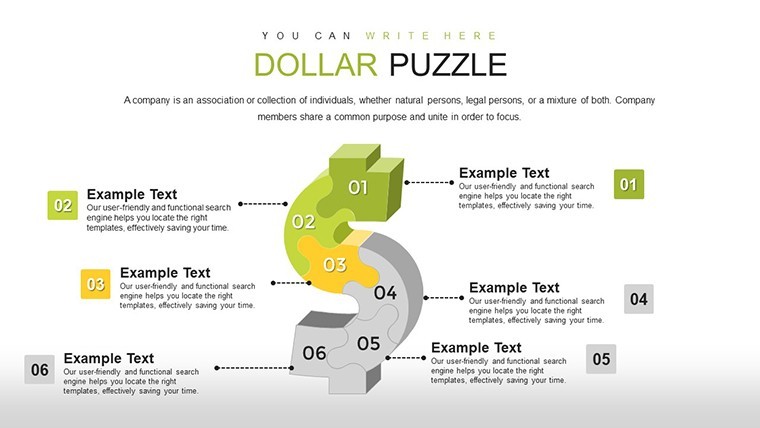
- Animation Options: Animate puzzle assembly to demonstrate cause-and-effect in economic models.
- High-Impact Icons: Incorporate dollar signs, graphs, and global maps for contextual relevance.
These features align with financial visualization standards, similar to those used in reports by the International Monetary Fund, ensuring your content is both authoritative and accessible.
Practical Use Cases in Finance and Education
For financial consultants, this template shines in client meetings: Depict how exchange rate puzzles affect investment portfolios using slide 15's modular design. Educators can break down complex theories, like Keynesian economics, into digestible puzzle charts that students assemble mentally. A notable application? In a recent webinar on post-pandemic recovery, analysts used analogous visuals to explain dollar strength against emerging currencies, boosting viewer retention by 30%.
Customizing Your Economic Narrative Step by Step
- Launch in Keynote and choose a puzzle base from the slide library.
- Input economic data, such as GDP figures or exchange rates, into placeholders.
- Connect puzzle pieces with lines or arrows to show influences.
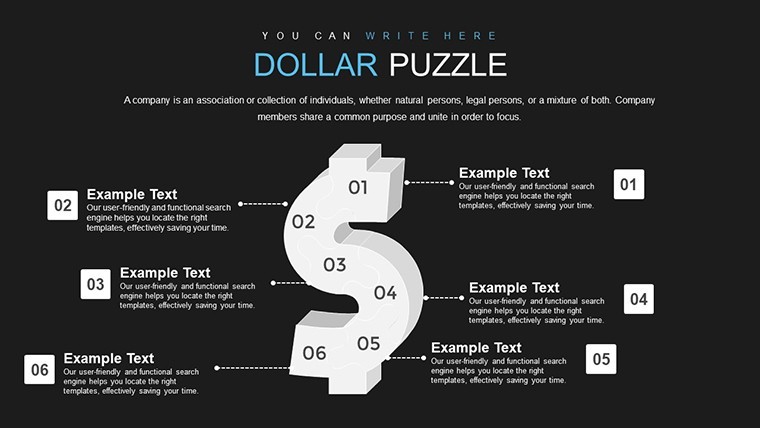
- Tweak colors to differentiate between positive and negative factors.
- Add animations for a reveal effect during presentations.
- Review and export for sharing in meetings or online platforms.
This streamlined method cuts preparation time significantly compared to building from blank slides, allowing more focus on analysis over aesthetics.
Captivate with Creative Puzzle Designs
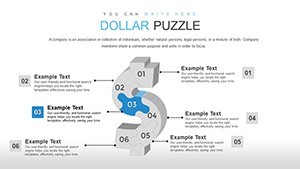
The puzzle motif isn't just gimmicky - it's a metaphor for economic interconnectedness. Slide 22, for instance, features a dollar-centric puzzle for illustrating monetary policy impacts on trade. In corporate settings, adapt for quarterly reviews, piecing together revenue streams affected by currency volatility. This template's 3D elements add a modern twist, making your presentations stand out in a sea of flat graphs.
Workflow integration is key: Sync with financial software like Bloomberg terminals for real-time data pulls, turning static slides into dynamic tools.
Expert Tips to Elevate Your Charts
- Use varying puzzle sizes to emphasize major vs. minor economic drivers.
- Incorporate real-time data feeds for live presentations.
- Balance visuals with concise text to maintain audience focus.
- Test color contrasts for accessibility in diverse settings.
- Layer with annotations for deeper insights during Q&A.
These strategies echo advice from finance gurus like those at the CFA Institute, enhancing the persuasive power of your visuals.
Superior to Standard Keynote Tools for Complex Data
Basic Keynote charts handle simple data, but our puzzle-infused designs excel at multifaceted economic narratives. They provide pre-configured layouts for scenarios like Brexit's currency puzzles, saving you from tedious manual alignments. This leads to more engaging sessions that drive decisions, from policy recommendations to investment strategies.
In virtual environments, the template's responsive design ensures puzzles render perfectly on any screen, bridging gaps in remote collaborations.
Eager to piece together compelling economic stories? Secure this Dollars Puzzles Keynote template now and unlock new dimensions in your presentations.
Frequently Asked Questions
What makes the puzzle charts unique?
They visually represent interconnected economic factors, making complex relationships easier to grasp and discuss.
Can I edit the 3D elements?
Yes, all 3D puzzles are fully customizable, including rotation, scaling, and color adjustments in Keynote.
Is this suitable for beginner economists?
Definitely - intuitive designs help novices present data confidently, with room for advanced customizations.
Does it support data import?
Absolutely, import from spreadsheets to populate puzzles automatically.
Are animations included?
Pre-set animations are ready; customize them to fit your narrative flow.
How does it handle large datasets?
Modular puzzles scale well, allowing segmentation for clarity in extensive economic analyses.