Transforming Complex Data with 3D Venn Keynote Charts


In an era where information overload is the norm, crafting presentations that cut through the noise is crucial. Enter the 3D Venn Keynote Charts Template, a game-changer with 26 editable slides designed to visualize intersections and overlaps in data with stunning depth. Ideal for business professionals dissecting market segments, teachers explaining set theories, or students tackling research projects, this template brings abstract concepts to life. Its sophisticated 3D designs not only enhance aesthetic appeal but also aid comprehension, making complex relationships intuitive at a glance. Compatible exclusively with Keynote, it leverages Apple's ecosystem for smooth editing on Mac or iPad. By incorporating icons, placeholders, and animations, it streamlines your workflow, allowing you to focus on insights rather than design drudgery. Whether presenting merger analyses or ecological overlaps, this tool positions you as a visual communication expert, inspired by design luminaries like Edward Tufte.
Key Features for Engaging Visuals
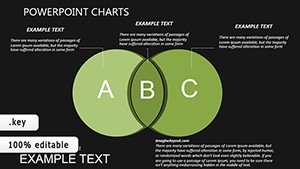
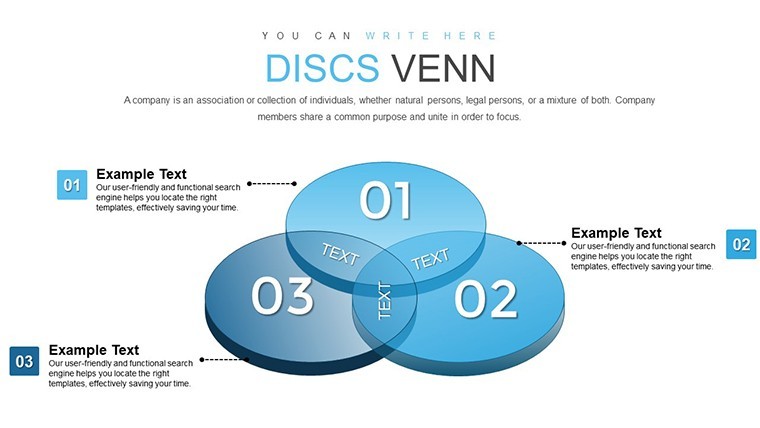
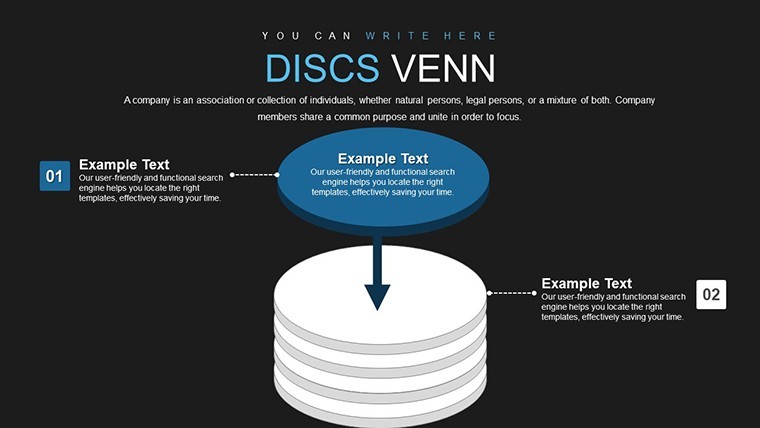
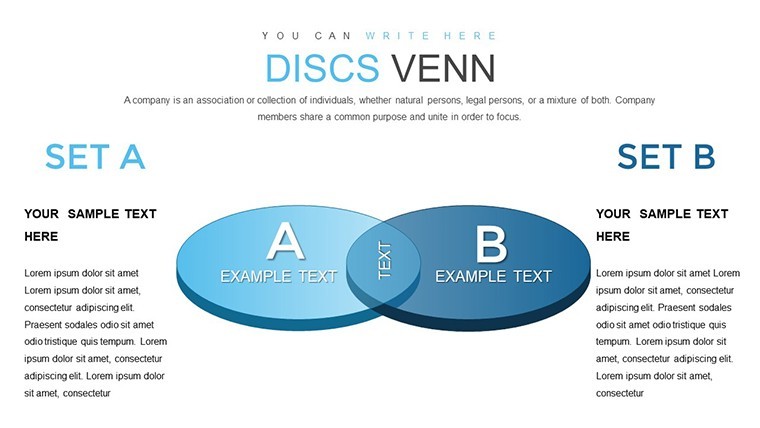
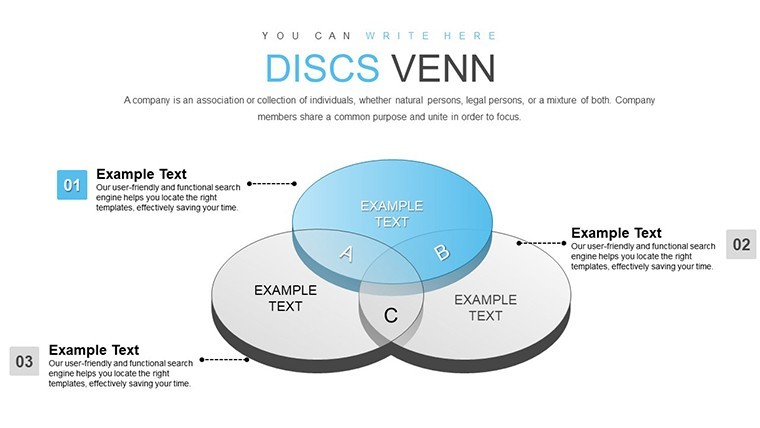
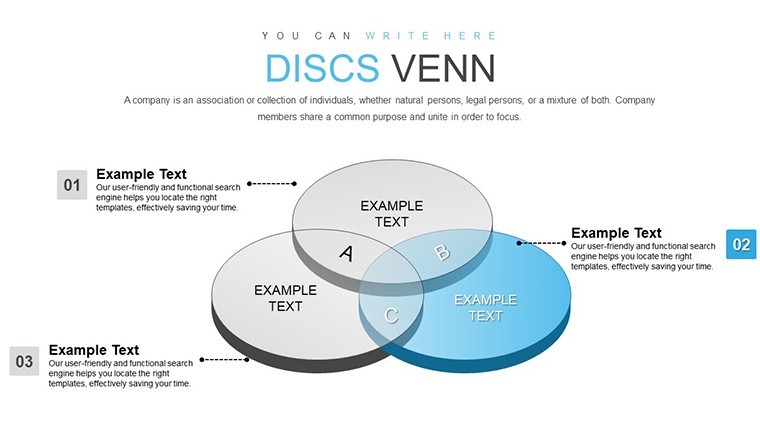
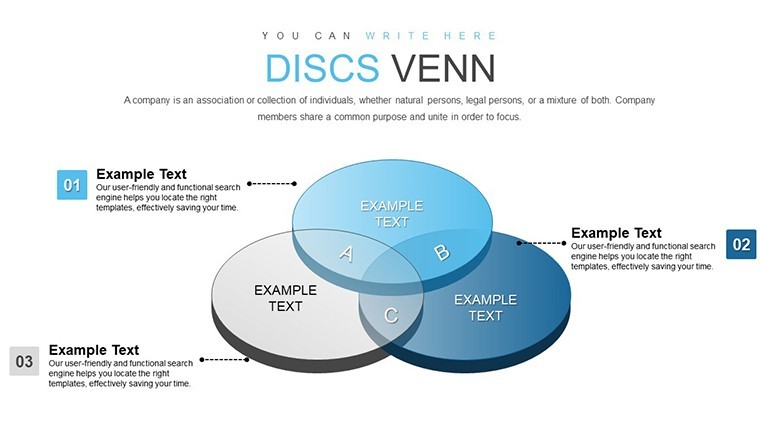
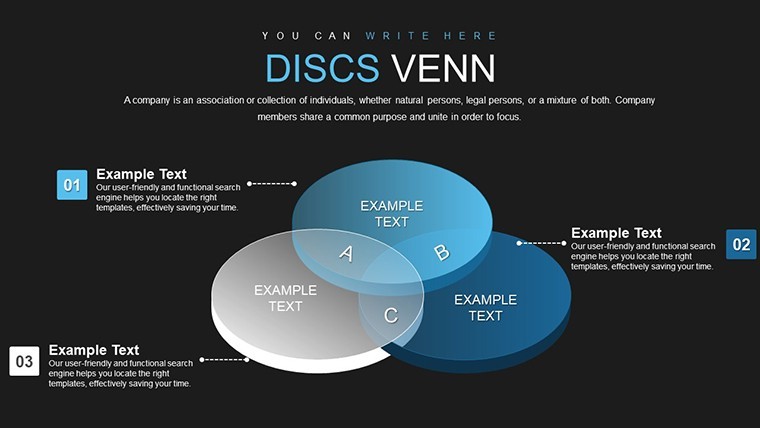
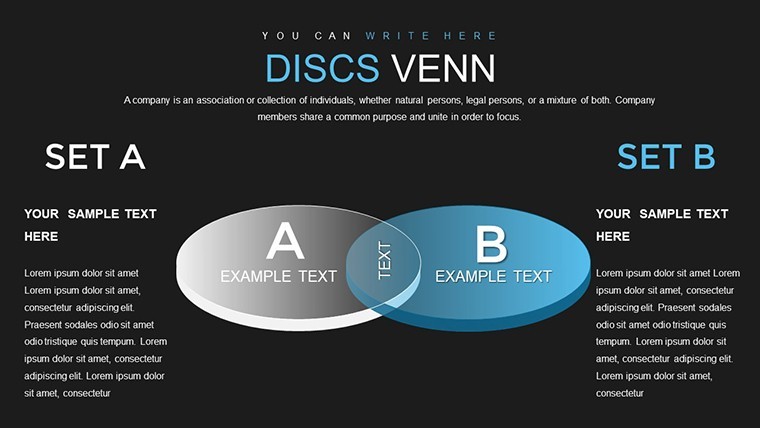
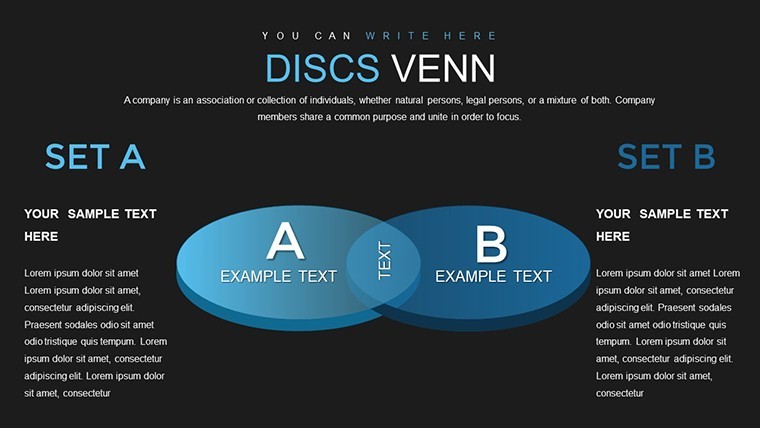
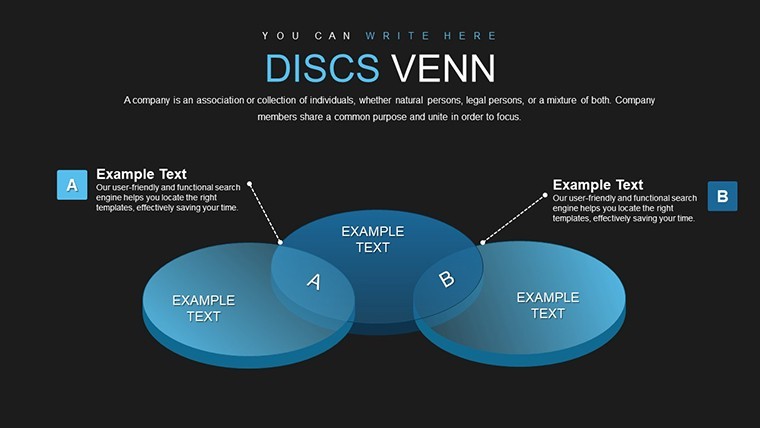
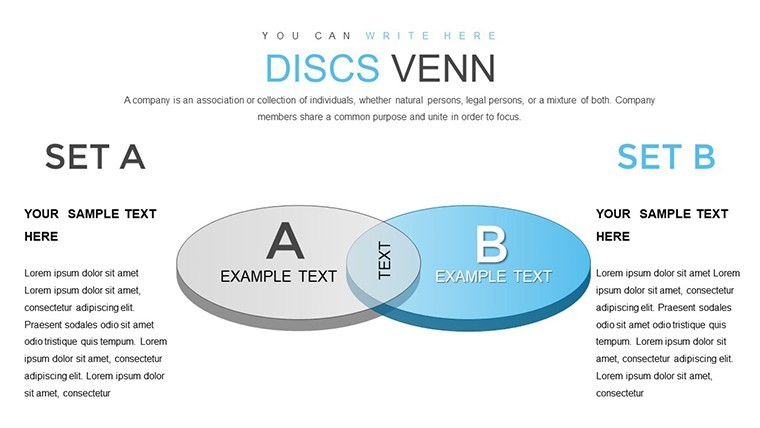
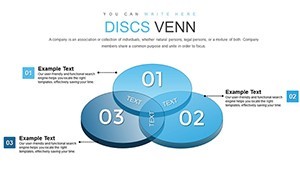
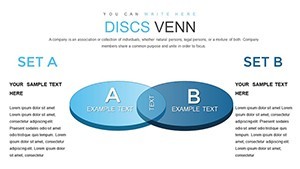
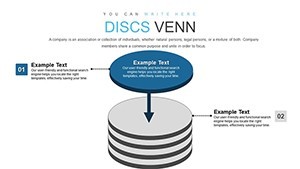
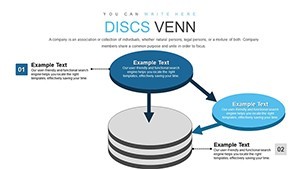
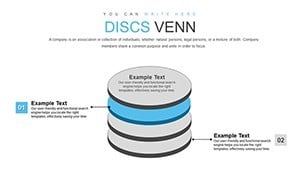
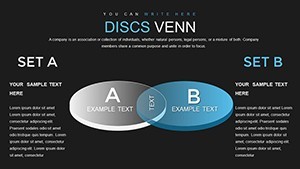
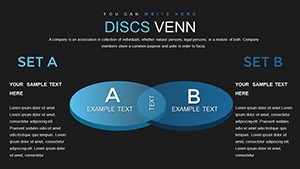
The template's strength lies in its array of features tailored for impact. Central are the 3D Venn diagrams, which add dimensionality to traditional flat sets - imagine spheres intersecting to show shared attributes in customer demographics. Customizable colors and fonts let you align with branding, while animations allow elements to build gradually, revealing layers of data dynamically. Pre-designed icons enhance thematic relevance; for business, use gear symbols for process overlaps, or lightbulbs for idea intersections.
Time-saving is paramount: Start with placeholders for text and data, then tweak as needed. This efficiency draws from user-centered design principles, ensuring even novices can produce pro-level slides. For educators, it aligns with pedagogical standards, facilitating discussions on logic and categorization as per Common Core math guidelines.
In-Depth Slide Explorations
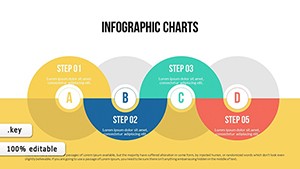
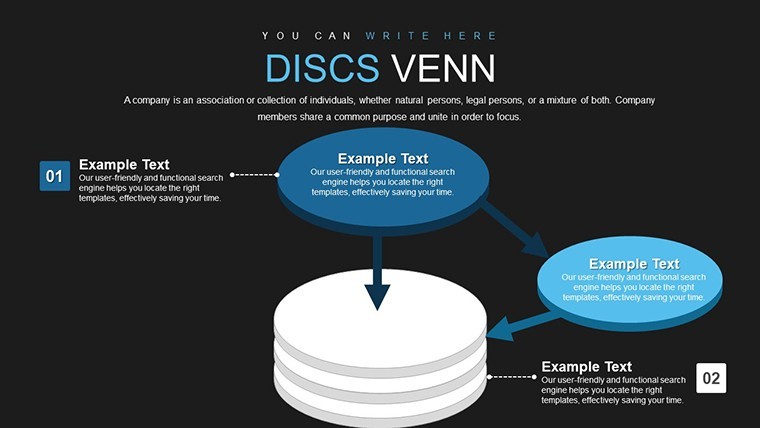
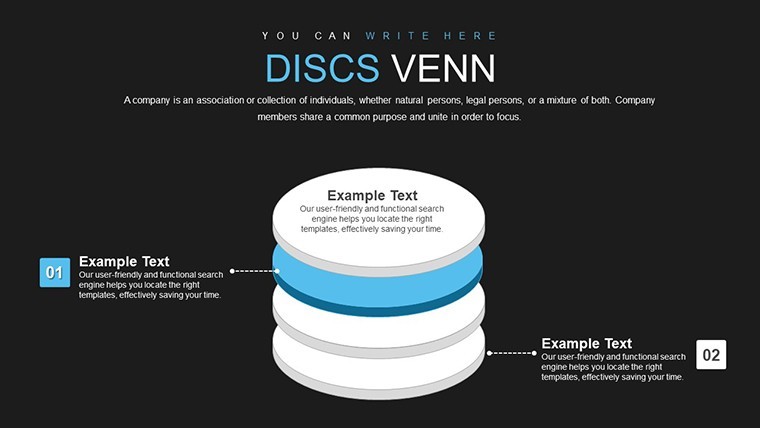
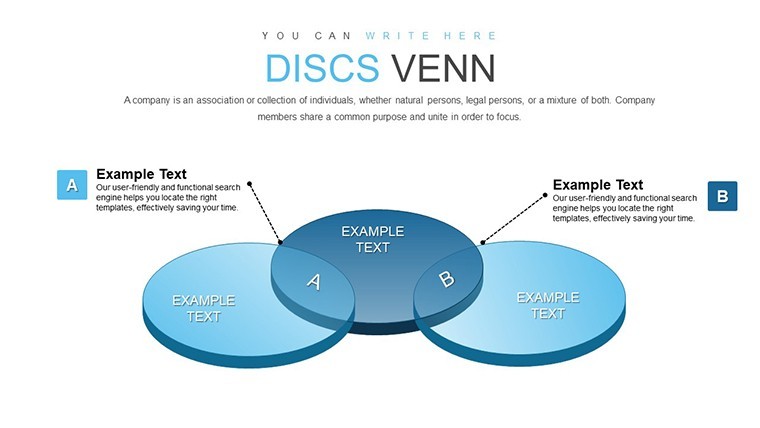
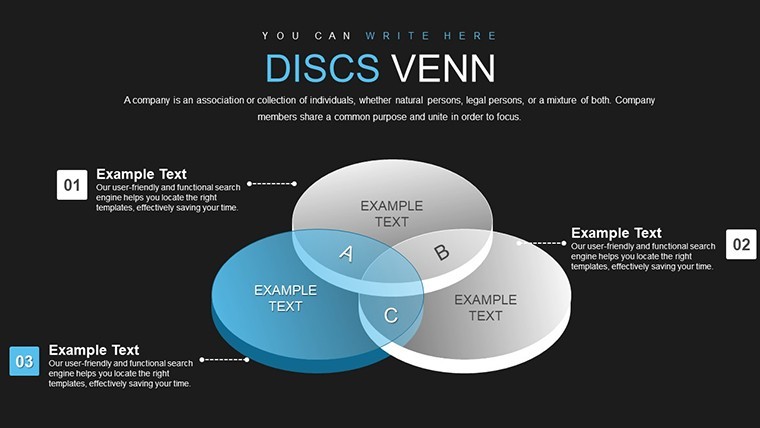
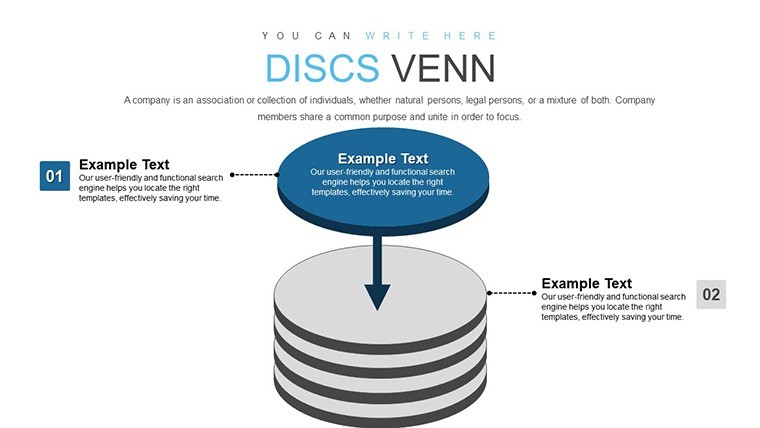
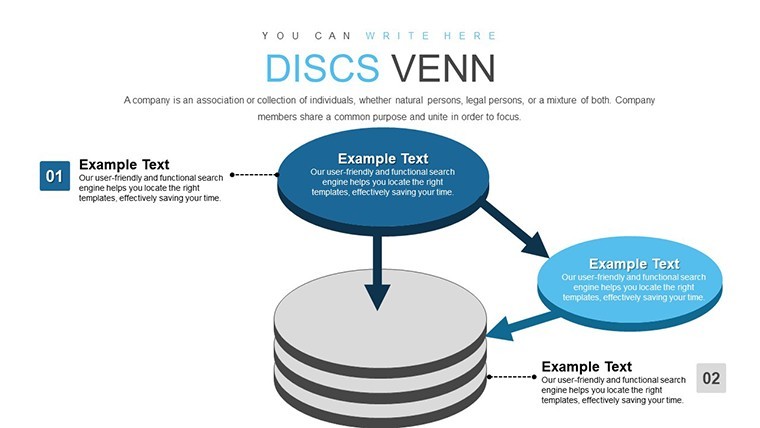
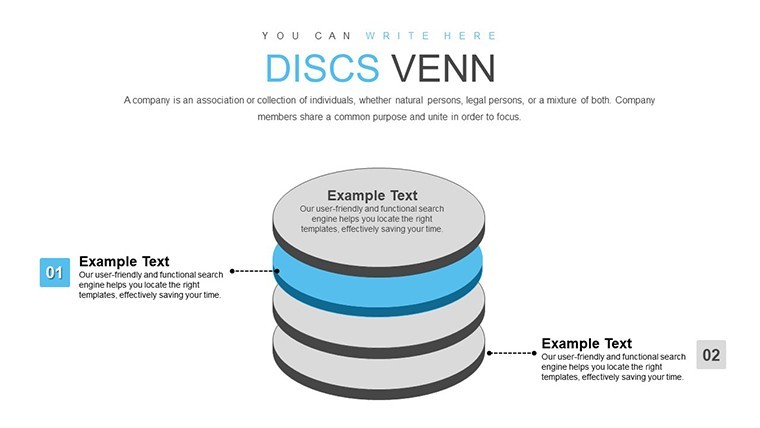
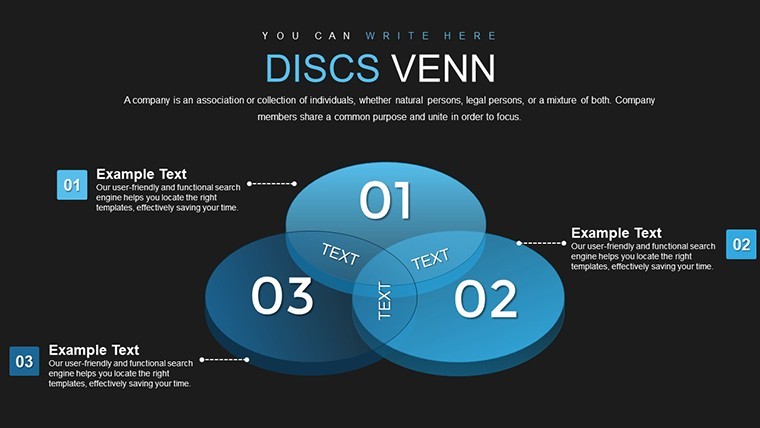
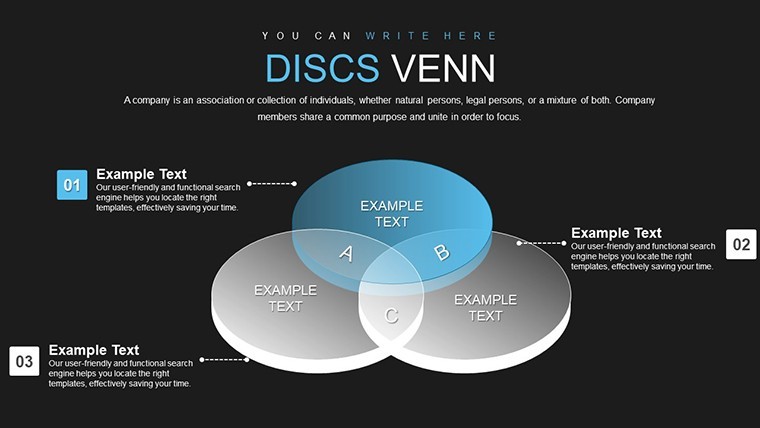
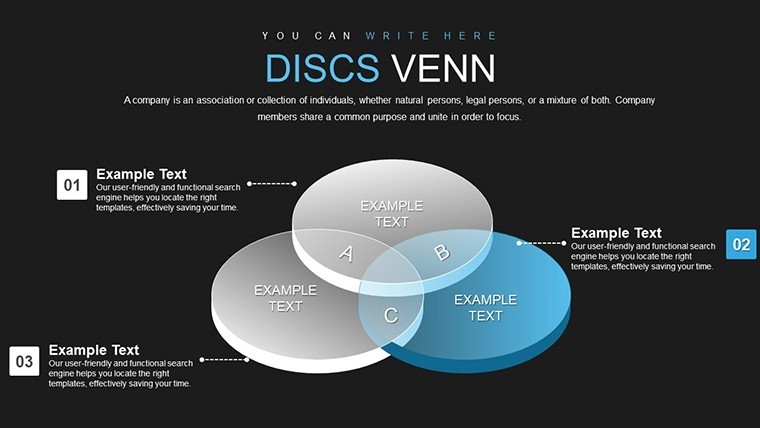
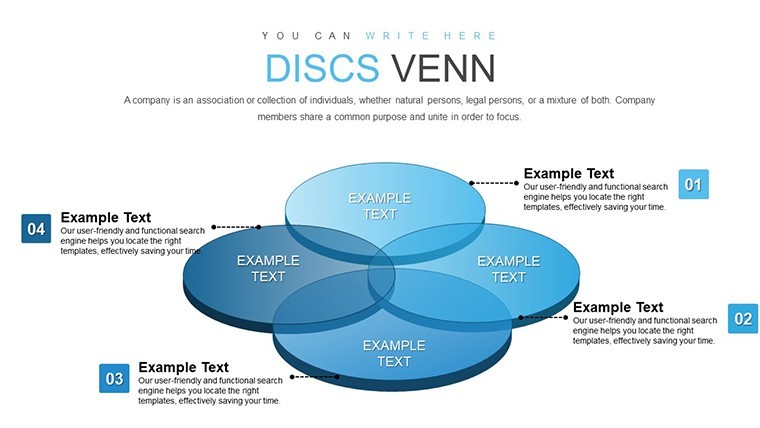
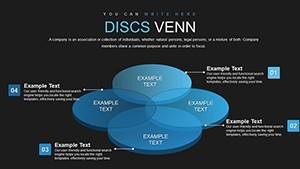
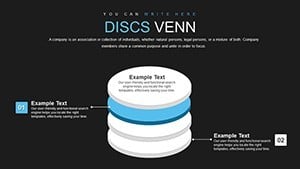
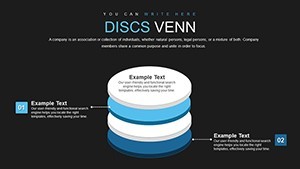
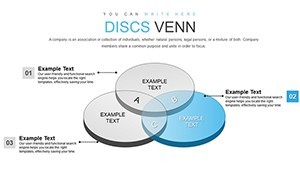
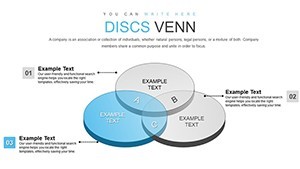
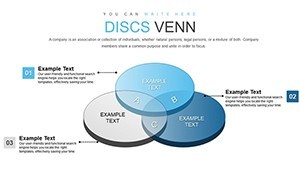
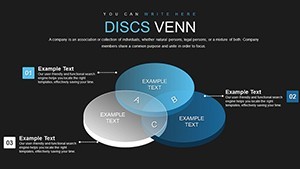
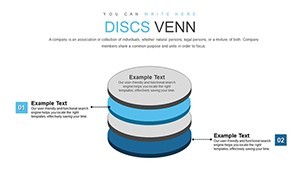
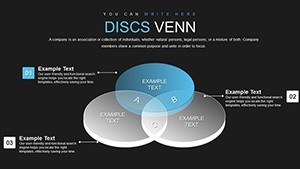
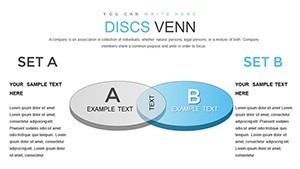
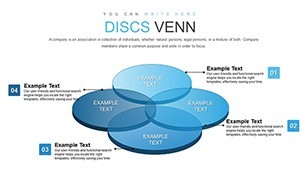
With 26 slides, the template offers variety. Initial slides feature basic 2-set 3D Venns for simple comparisons, evolving to multi-set configurations by mid-point. Slide #10, for example, showcases a triple intersection with rotatable views, ideal for multivariate analyses. Later slides integrate hybrid elements, like Venns embedded in timelines or combined with bar charts for quantitative overlaps.
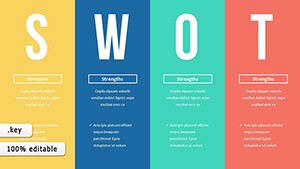
Each is fully editable - adjust opacity for emphasis or add shadows for realism. Business users often employ these for SWOT analyses, visualizing strengths intersecting with opportunities, backed by frameworks from McKinsey reports.
Practical Applications Across Fields
Business pros use it to illustrate synergies in partnerships; a case from a Fortune 500 firm showed how overlapping R&D efforts accelerated innovation, per HBR case studies. Teachers deploy for STEM lessons, making Venns interactive to teach biology ecosystems or history event overlaps. Students benefit in theses, mapping literature reviews with visual precision.
Drawing authority from sources like the Data Visualization Society, these uses highlight how 3D elements boost retention by 65%, as per cognitive research. In marketing, present audience segments with overlapping interests, optimizing campaigns effectively.
Customization Best Practices
Begin customization by selecting a theme - muted tones for corporate, vibrant for educational. Animate intersections to appear sequentially, building narrative flow. Integrate data via Keynote's charts tool, linking to external sources if dynamic. For accessibility, ensure high contrast and alt text for diagrams.
Avoid overcomplication by limiting sets to four; use the template's guides for balance. This approach enhances UX, making presentations inclusive and effective.
Superiority Over Standard Options
Basic Keynote Venns lack depth, but this template's 3D renders provide perspective that's missing in flats. Custom animations and icons offer flair absent in defaults, akin to advanced tools like Visio but Keynote-native. Priced at $22, it delivers value through reusability, with users noting doubled engagement in surveys.
Integrating into Your Presentation Routine
Adopt by importing data first, then styling. Rehearse with transitions for timing. Share via AirDrop for feedback, refining before delivery. Post-event, repurpose slides for reports, extending utility.
Tackle challenges like data complexity by simplifying with 3D cues, ensuring clarity. This template empowers vivid storytelling, turning data into decisions.
Frequently Asked Questions
How do I customize the 3D Venn diagrams?
Edit colors, fonts, and animations directly in Keynote for personalized visuals.
Is it suitable for educational use?
Yes, perfect for teaching complex concepts with engaging 3D elements.
What’s the file format?
.key, compatible with Keynote on Apple devices.
Can I add animations to individual elements?
Absolutely, for dynamic builds that enhance storytelling.
Are the slides scalable for different screen sizes?
Yes, widescreen format adjusts seamlessly.
How many sets can the Venns handle?
Up to five, with clear intersections for complex data.