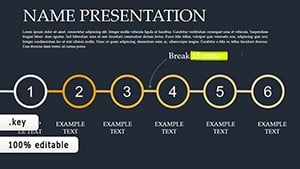
Infographic Mastery: Venn Unions and Intersections in Keynote


Type: Keynote Charts template
Category: Venn
Sources Available: .key
Product ID: KC00810
Template incl.: 22 editable slides
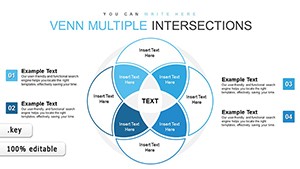
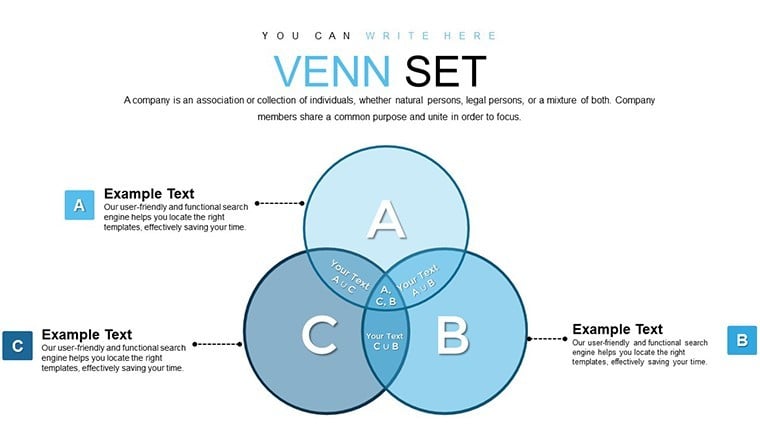
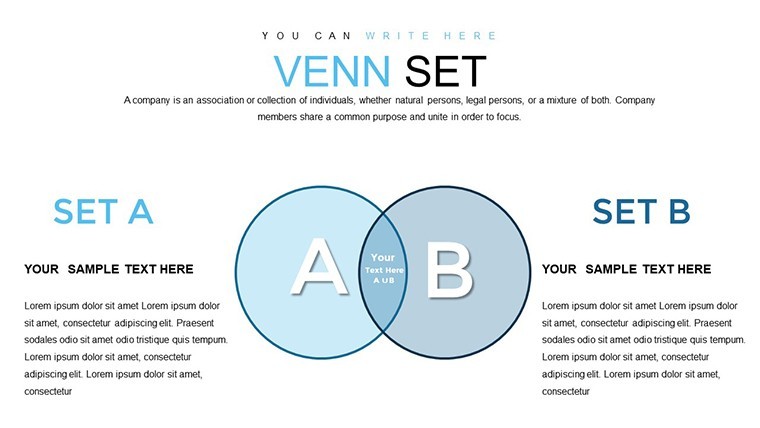
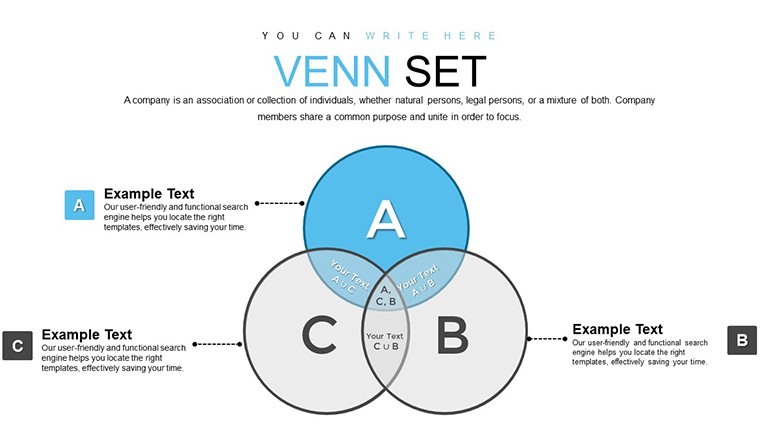
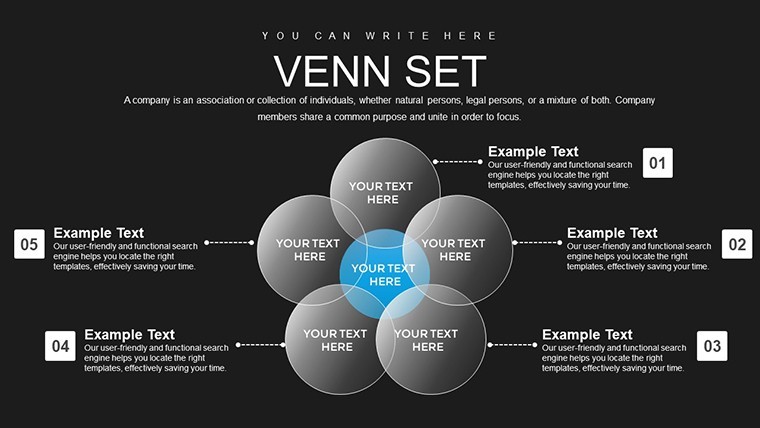
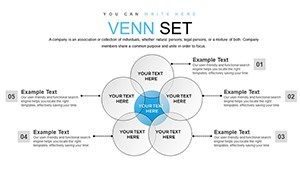
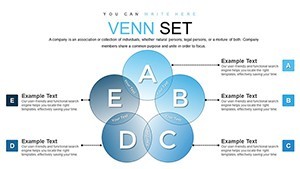
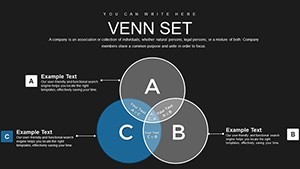
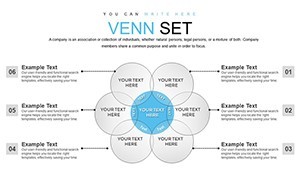
Visualizing relationships between ideas has never been more vibrant than with the Infographic Venn Unions and Intersections Keynote template. Boasting 22 editable slides, this tool uses closed curves - often circles but flexibly shaped - to represent sets and their overlaps, turning dense data into digestible infographics. Perfect for marketers crafting campaign strategies, educators simplifying theories, or analysts reporting insights, it employs bright, exciting elements to capture attention instantly. Whether illustrating holiday themes or business intersections, the template makes complex information accessible, fostering better understanding and retention. Keynote-exclusive, it integrates seamlessly with Apple's suite, allowing quick edits on the go. By leveraging creative visuals, it not only saves design time but also amplifies your message, drawing from infographic best practices endorsed by experts like Randy Krum in "Cool Infographics."
Essential Features for Visual Storytelling
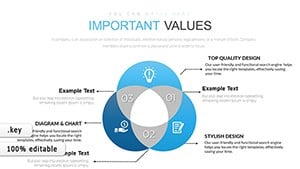
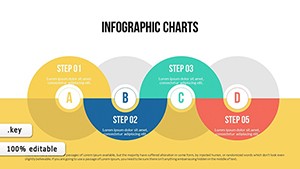
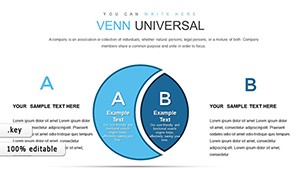
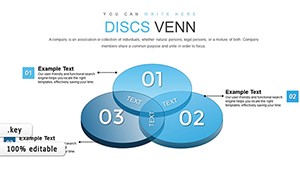
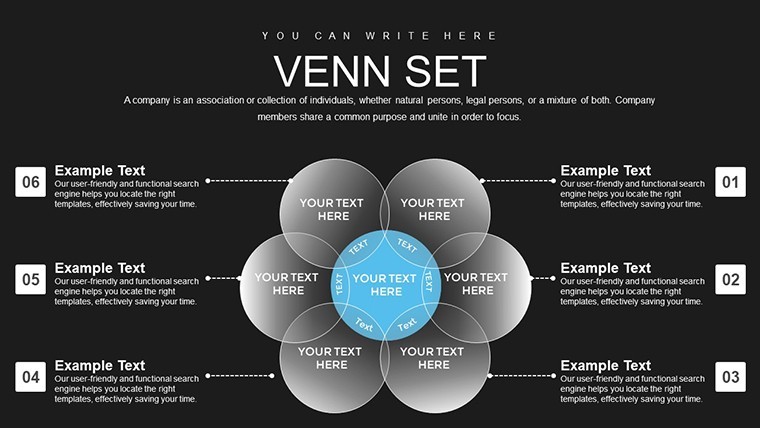
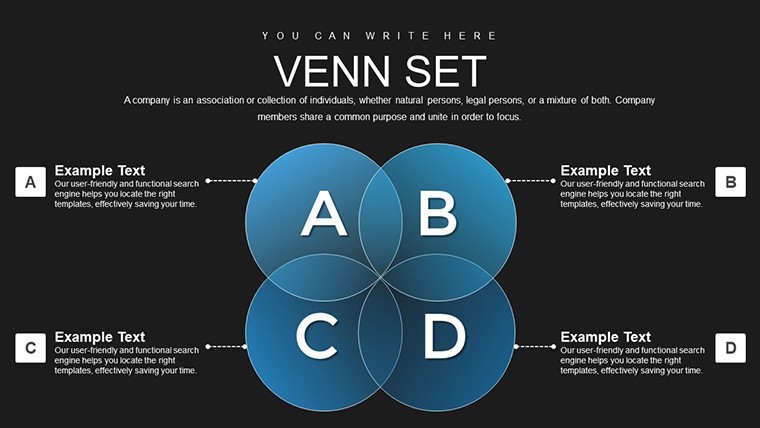
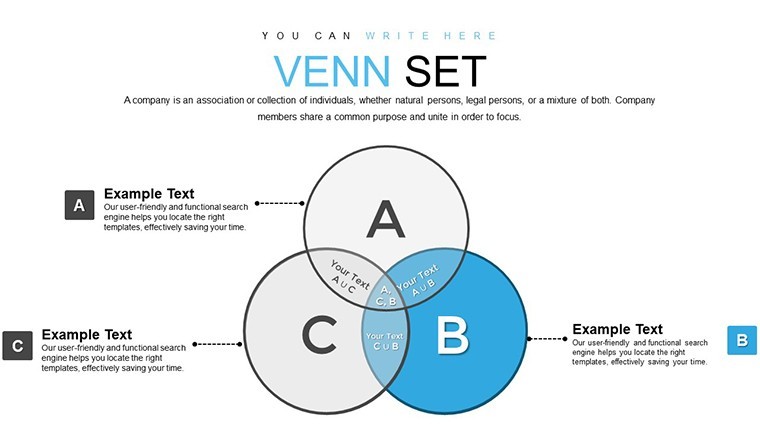
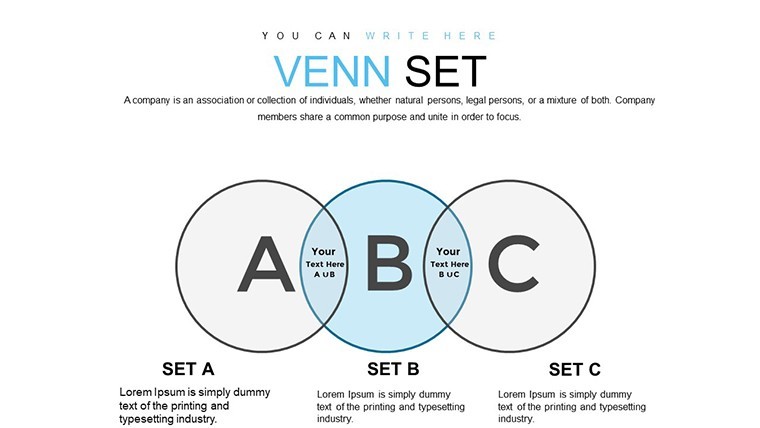
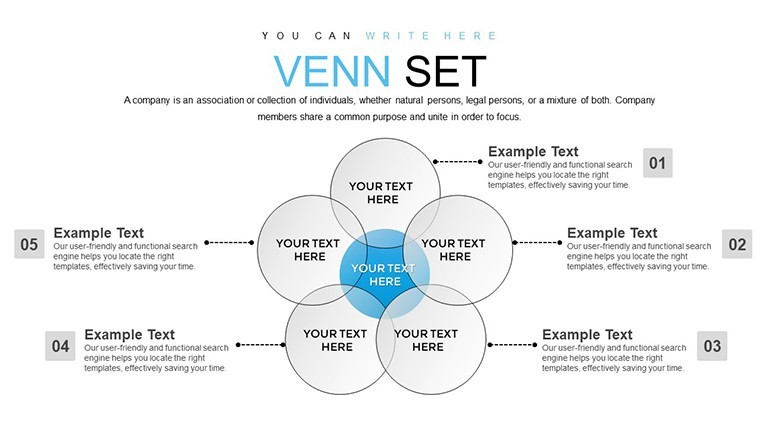
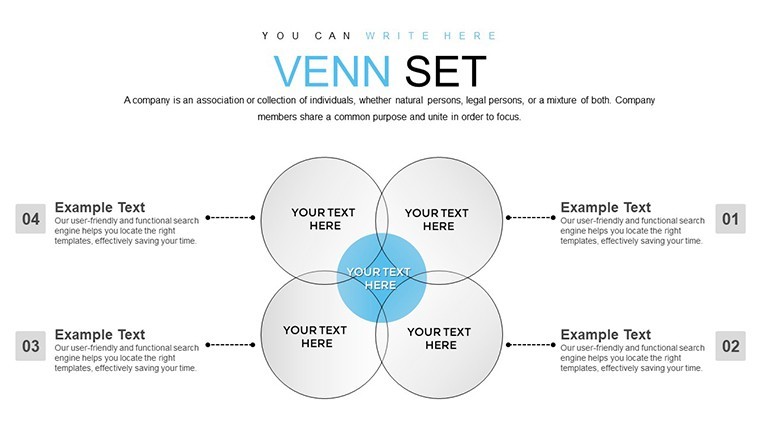
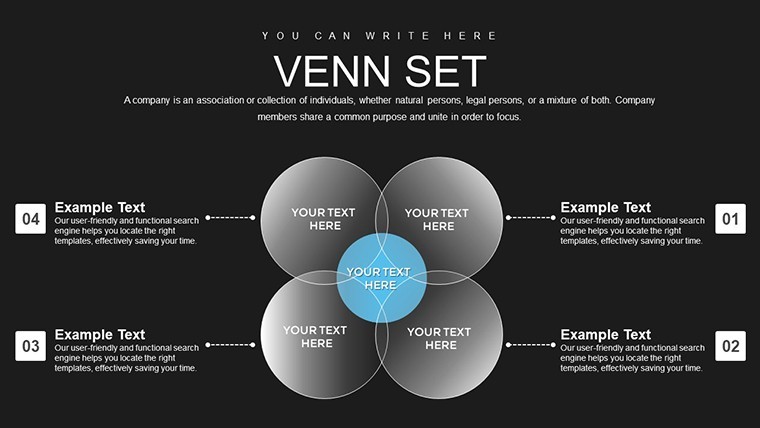
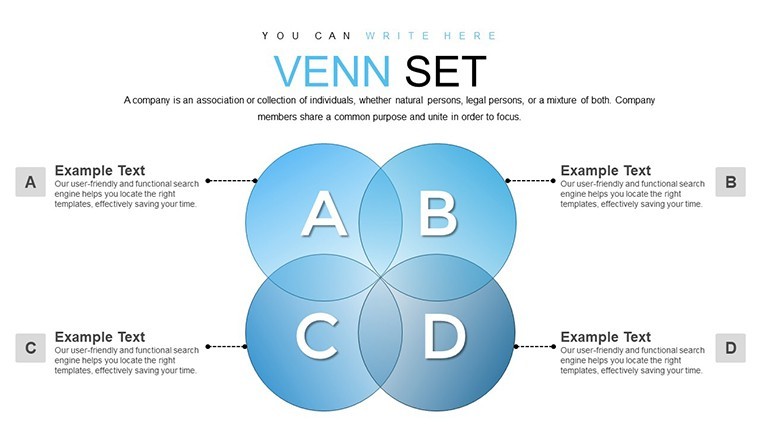
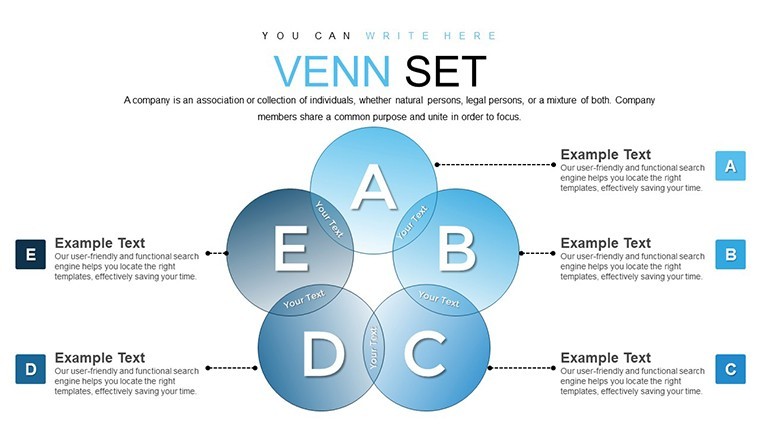
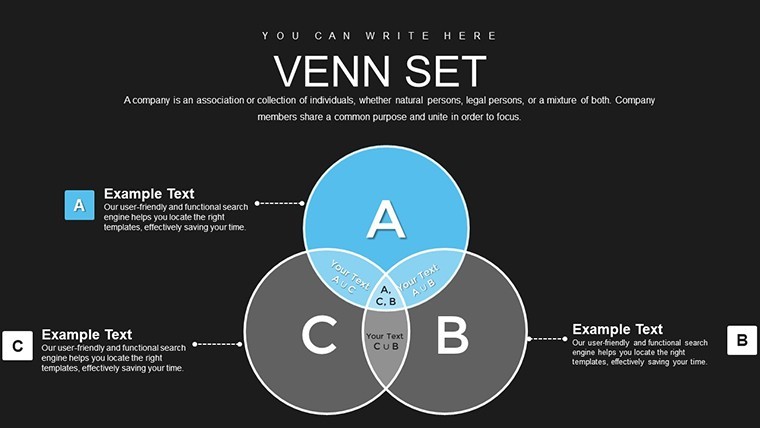
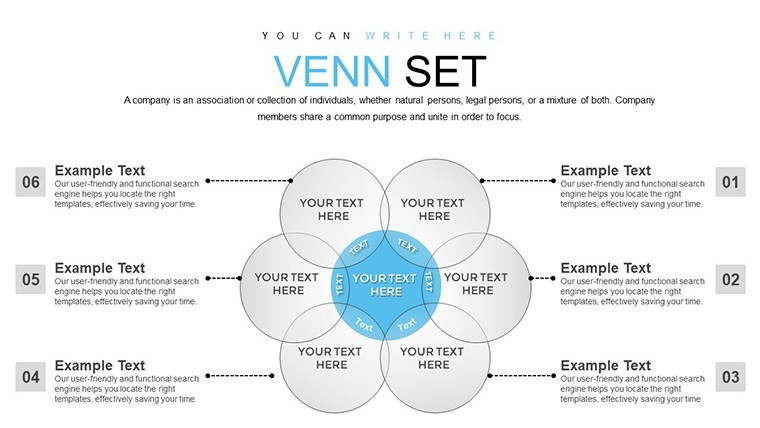
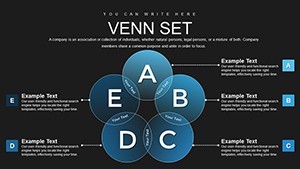
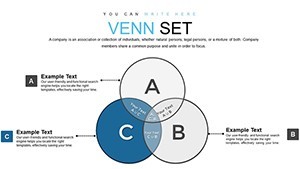
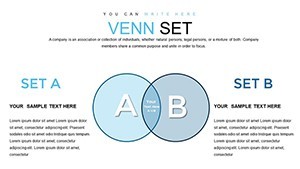
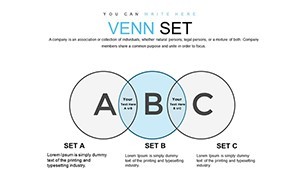
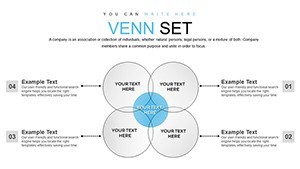
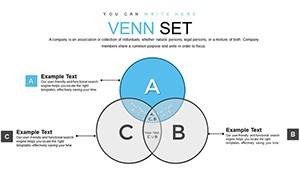
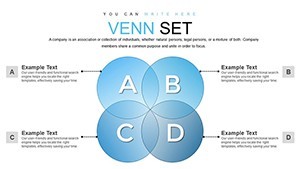
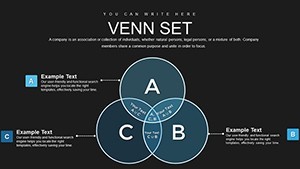
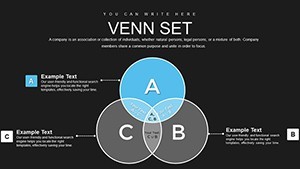
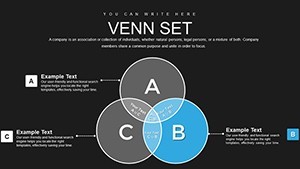
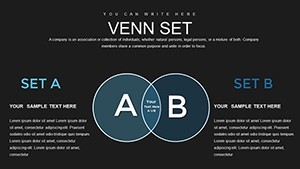
Key to this template are its dynamic features: Arbitrary shaped curves for Venns, enabling non-traditional representations beyond circles. Bright colors and patterns attract eyes, while editable text and icons allow tailoring to any narrative. For instance, use overlapping areas to highlight shared holiday traditions in a cultural presentation, or union zones for combined market shares in business reviews.
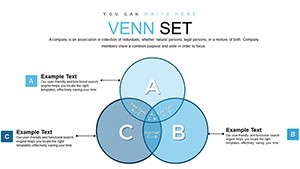
The infographic style ensures clarity - points inside curves denote set elements, making abstract sets concrete. This aligns with mathematical foundations from John Venn himself, updated for modern digital use. Add media like images or clips to enrich, transforming slides into multimedia experiences.
Slide-by-Slide Insights
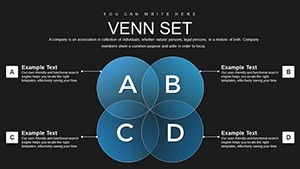
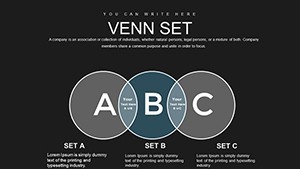
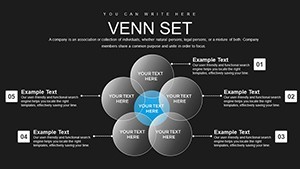
The 22 slides build progressively: Early ones feature basic unions for simple merges, advancing to intricate intersections. Slide #8, for example, uses colorful overlaps to depict ecosystem interactions, with labels for each segment. Later slides incorporate infographic extras like arrows for flows or icons for emphasis, all editable for precision.
Each slide supports quick modifications - resize curves, change fills, or add gradients without quality loss, thanks to vector graphics.
Diverse Applications for Real Impact
In educational settings, teachers use it to explain set theory, with visuals aiding memory as per dual-coding theory from Allan Paivio. A holiday infographic case: Mapping overlapping festivities across cultures, enhancing cross-cultural awareness. For professionals, analysts visualize data merges in reports, like intersecting customer behaviors for targeted marketing, backed by Nielsen insights.
Marketers craft compelling stories, showing product feature unions to highlight value. Drawing from authoritative sources like Infographic Design Team, these uses prove the template's efficacy in making info stick.
Tailoring Tips for Optimal Results
Customize by choosing palettes that evoke emotions - festive reds for holidays, cool blues for corporate. Add transitions for reveal effects, building suspense in intersections. Integrate with other Keynote features like shapes for hybrid infographics.
Ensure balance by limiting overlaps to avoid clutter, following design rules from "The Visual Display of Quantitative Information."
Edges Over Conventional Venn Tools
Standard Venns are static; this template's infographics add vibrancy and flexibility, superior for engagement. At $18, it's cost-effective, with users citing easier digestion of complex data.
Workflow Integration and Challenges Solved
Start by populating sets, then style. Collaborate via shared links, refine collectively. Address info overload by focusing on key intersections, ensuring clarity.
This template turns presentations into visual feasts, inspiring action through understanding.
Frequently Asked Questions
What shapes can the Venn curves take?
Arbitrary forms, often circles, but customizable to fit your theme.
Is it easy to edit the infographics?
Yes, with vector elements for lossless modifications.
File format provided?
.key for Keynote compatibility.
Suitable for holiday themes?
Perfect, with bright visuals for engaging content.
Can I add media?
Absolutely, enhance with photos or videos.