 Click to zoom
Investment Workflow Charts Keynote Template | Fully Editable Financial Flow Diagrams - Instant Download
| Format | .pptx |
| Slides | 22 unique layouts |
| Aspect ratio | 16:9 |
| Compatibility | PowerPoint |
| Animated | No |
| Language | English |
| License | Commercial |
| File size | — |
| Version | v1.0 |
| Last updated | February 2026 |
What's inside
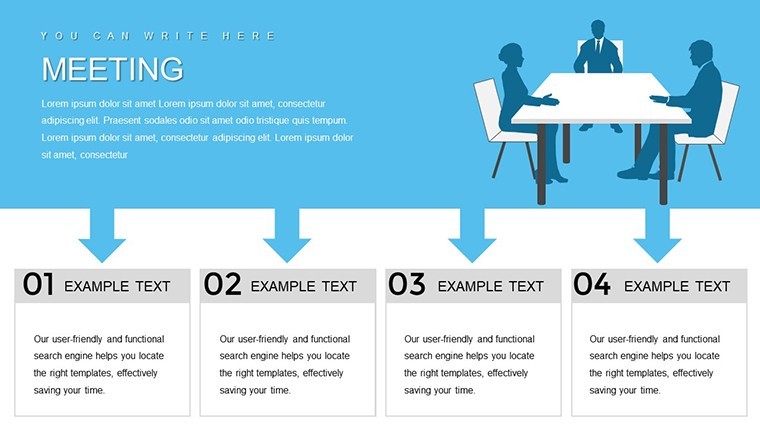
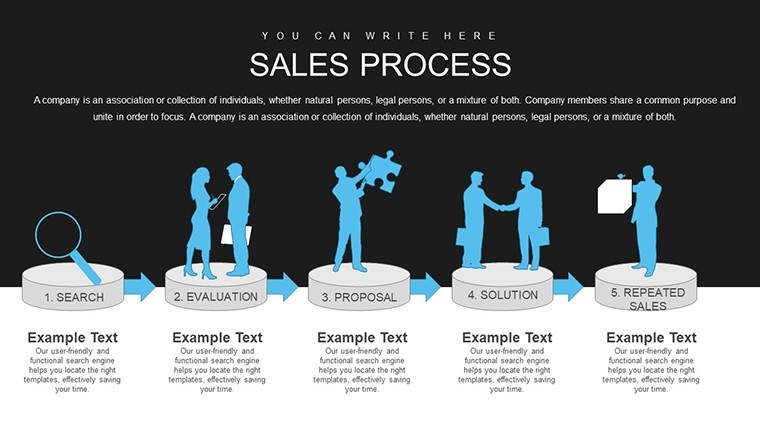
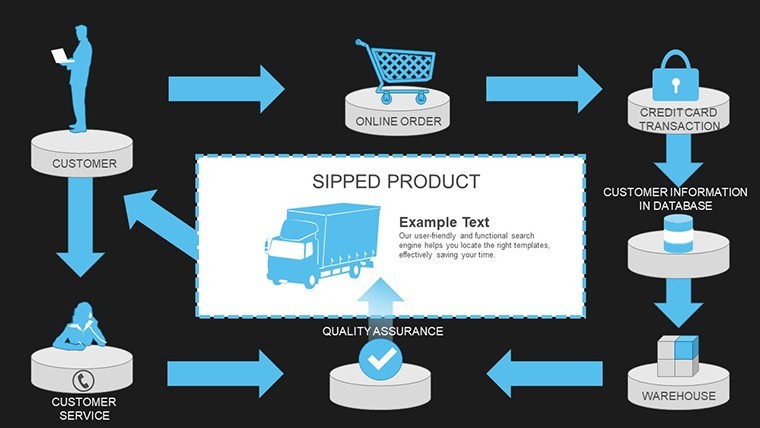
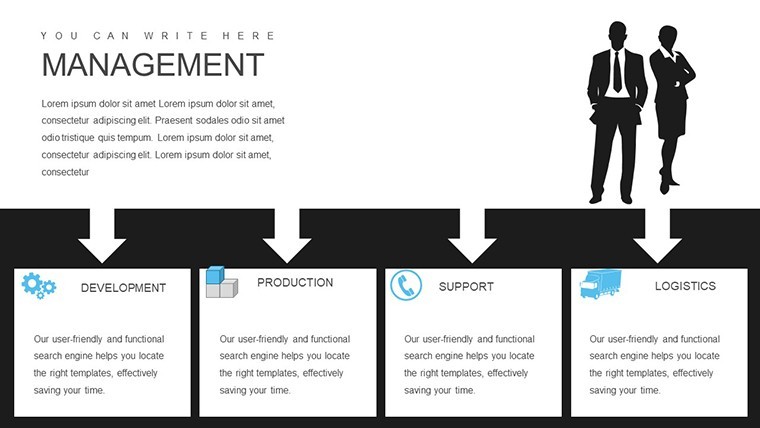
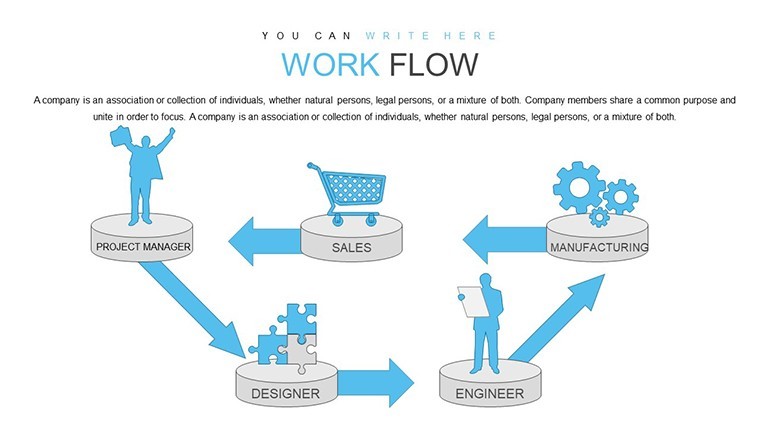
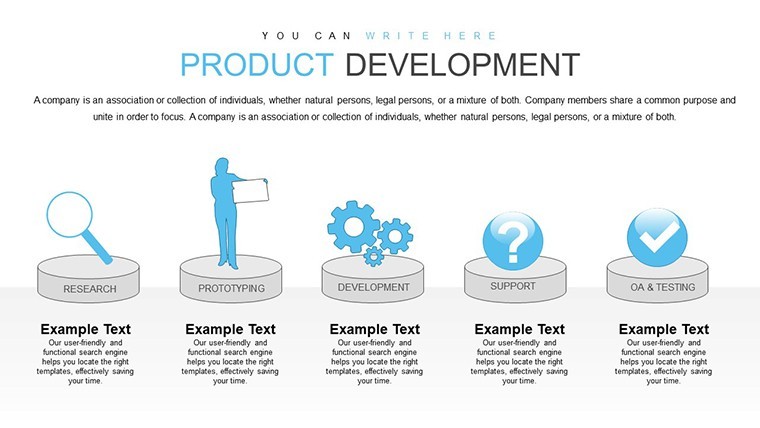
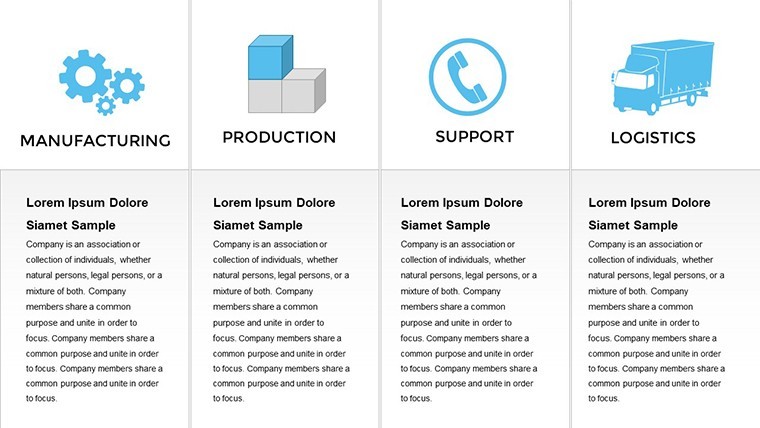
Transform Your Investment Presentations with Professional Workflow Charts
Investment analysis and strategy presentations require more than raw numbers - they demand clear visual narratives that reveal flows, relationships, and insights. Our Keynote workflow charts template provides 22 specialized, fully editable slides designed specifically for finance and investment professionals to map cash movements, resource allocations, and operational workflows.
Whether you're preparing a venture capital pitch, board update, or consulting report, these diagrams help stakeholders quickly understand complex processes and make informed decisions.
Key Features
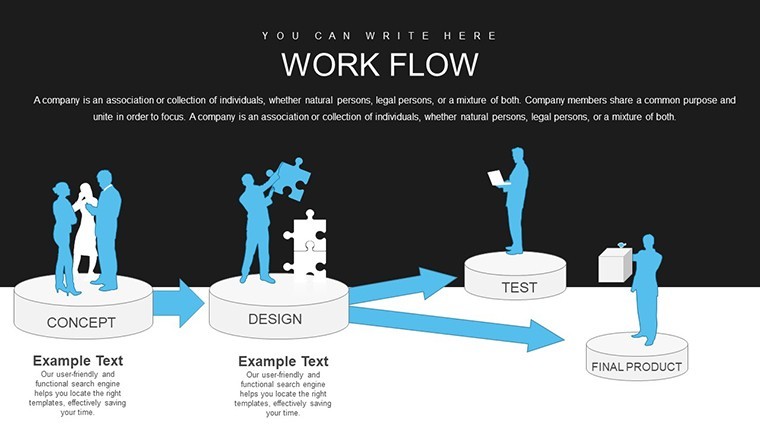
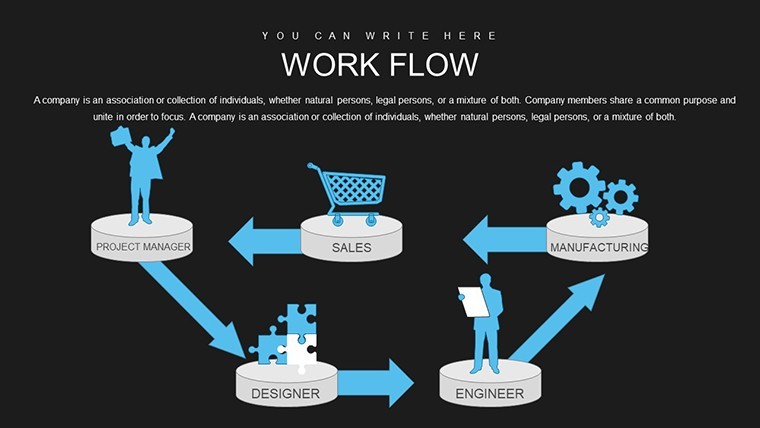
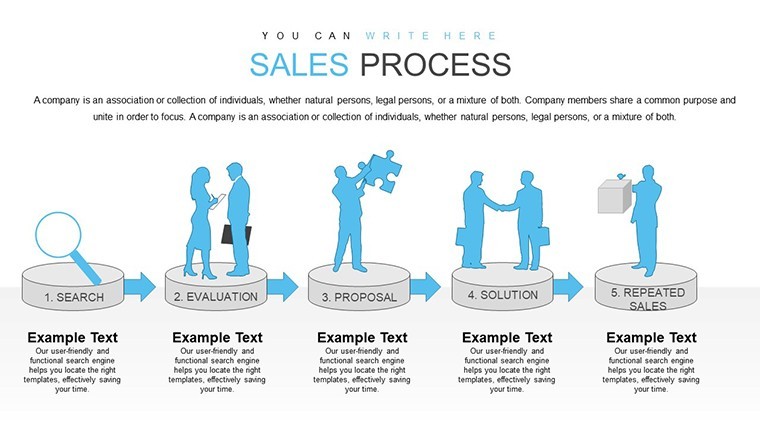
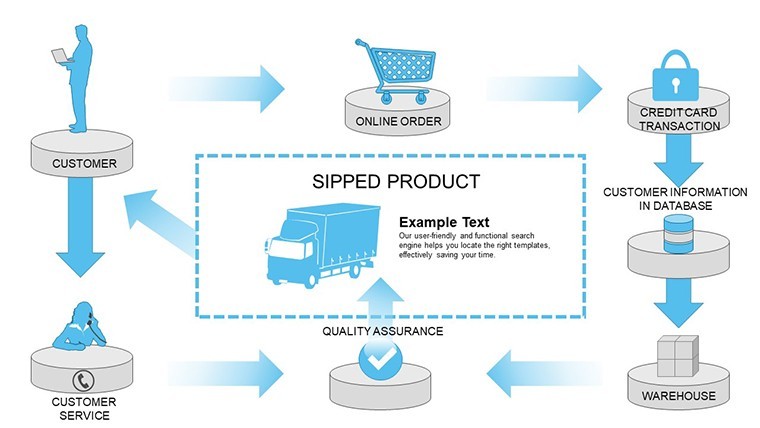
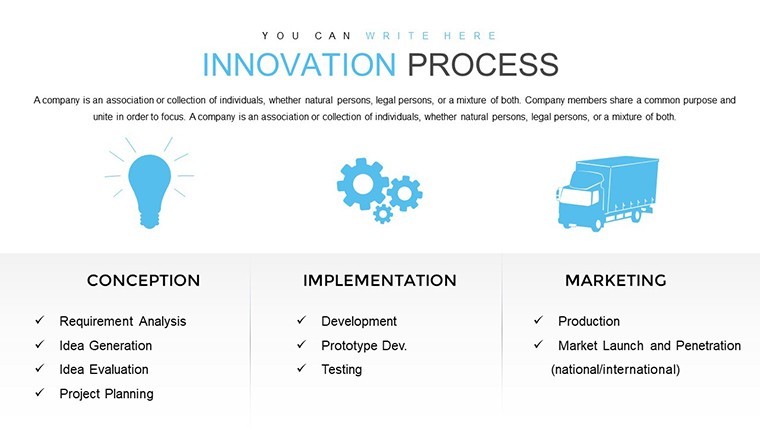
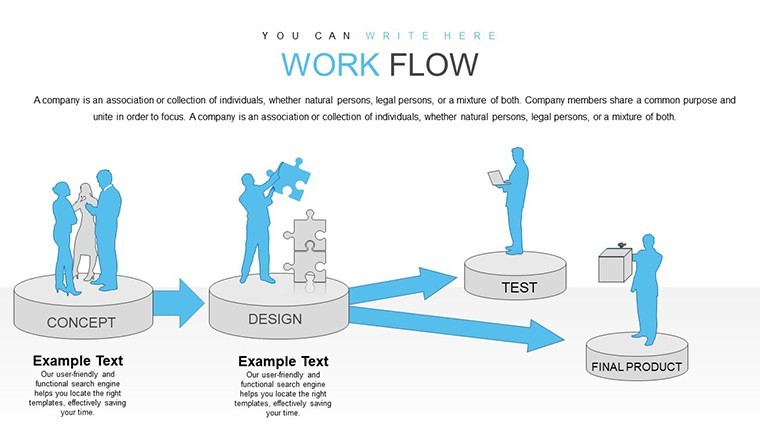
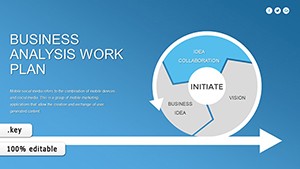
- 22 editable Keynote slides with interconnected flow charts
- Visualizations for cash, material, and labor movement tracking
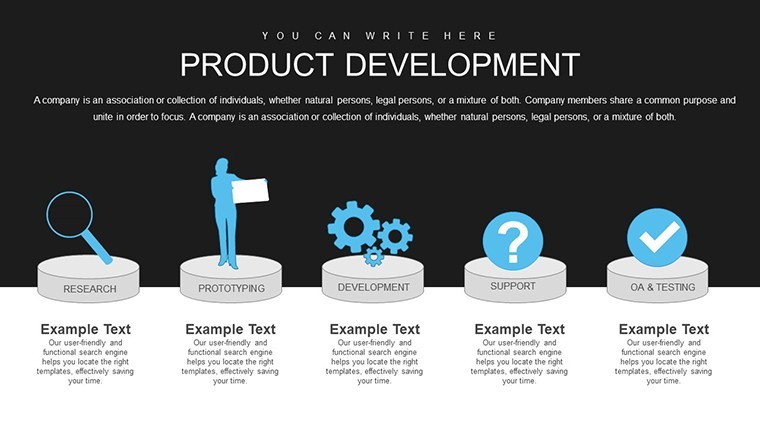
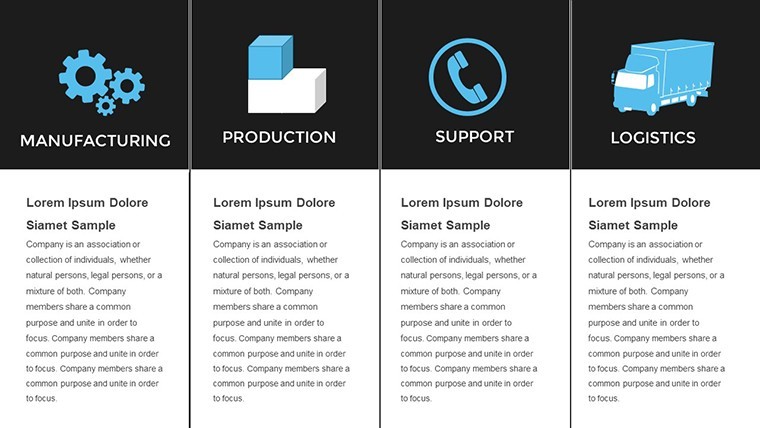
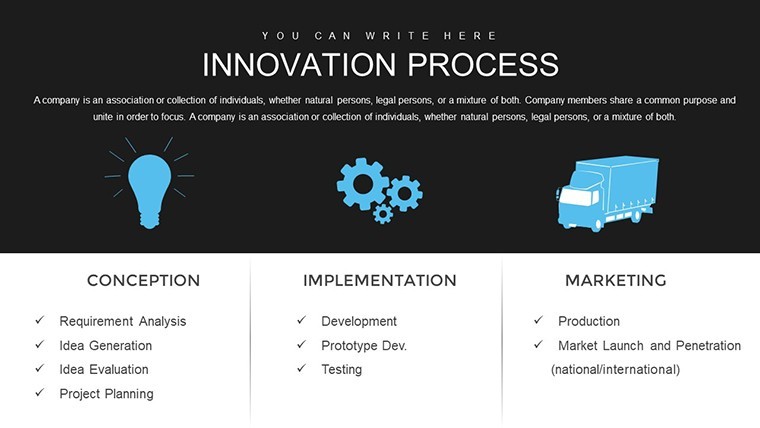
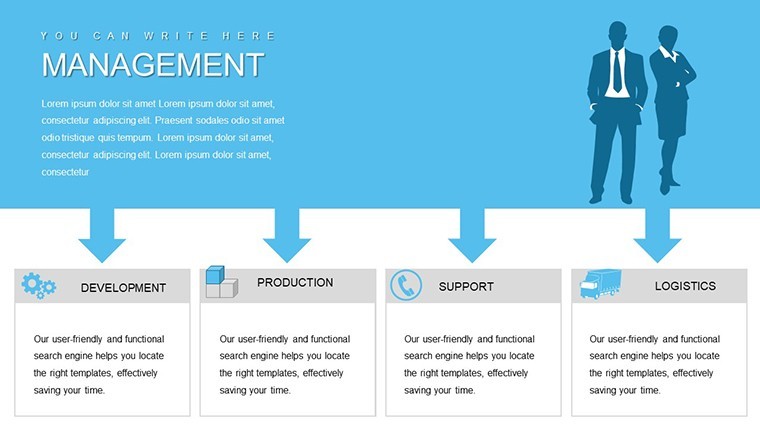
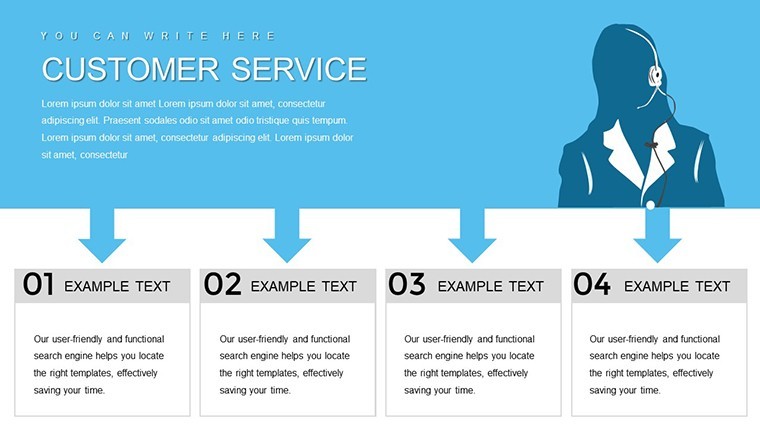
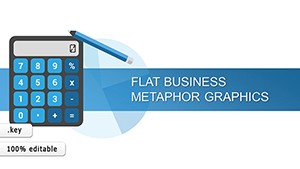
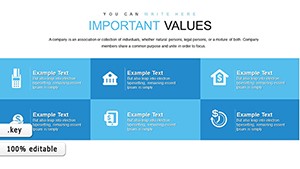
- Fully customizable shapes, colors, text, and data integration
- Pre-built for investment scenarios like venture funding, real estate, and M&A
- Professional design to enhance engagement and clarity in presentations
How to Use the Investment Workflow Charts Template
1. Instantly download the .key file after purchase.
2. Open in Apple Keynote.
3. Choose the slide layout that fits your story.
4. Edit text, update flow connections, and adjust colors to match your branding.
5. Incorporate your specific financial metrics and present with confidence.
The intuitive design makes customization quick, allowing you to focus on content rather than design.
Real-World Applications
Use in VC pitches to show capital deployment workflows, in corporate finance for expenditure tracking, or in consulting to map client resource efficiencies. Perfect for illustrating post-acquisition integrations or portfolio management processes.
Frequently Asked Questions
What does the template include?22 fully editable Keynote slides featuring professional workflow and flow charts optimized for investment and financial analysis visualizations.
Are the charts fully editable?Yes, every element - including shapes, lines, colors, and text - is fully customizable using Keynote's native editing tools.
Which versions of Keynote is it compatible with?Compatible with the latest versions of Apple Keynote on Mac and iPad.
Can I use it for commercial presentations?Yes, the template is licensed for both personal and commercial use in your professional presentations and reports.
How do I adapt it for different investment types?Simply update the labels, modify flow paths, and change visual elements to represent your specific scenario, whether venture capital, real estate development, or corporate investment planning.
Good for
- Project roadmaps and sprint plans
- Product launch timelines
- Quarterly or annual review decks
- Company history and milestone summaries
Licence
reviews
The process slides were surprisingly helpful for training.
Some fonts felt too plain but I changed them.
I liked the balance between charts and empty space.
Easy enough for quick edits during meetings.
Not bad if you need clean business slides.
FAQ
Will it work in Google Slides?
Are fonts embedded?
Can I use this for client work?
What's the refund policy?
Do you update the template after purchase?
Similar templates
See all Keynote Charts →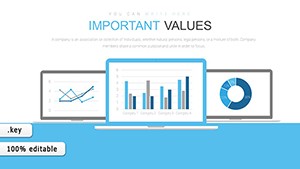
All 22 slides