Promo code "00LAYOUTS"
Innovation Process Steps Keynote Template: Fuel Your Business Growth
Type: Keynote Charts template
Category: Relationship, Business Models
Sources Available: .key
Product ID: KC00798
Template incl.: 24 editable slides
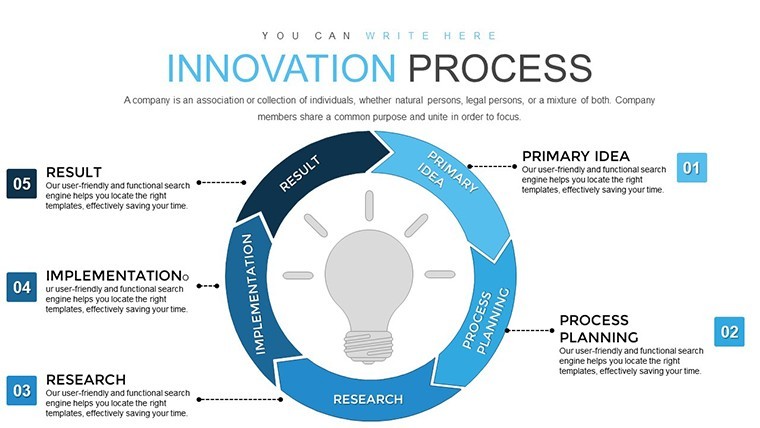
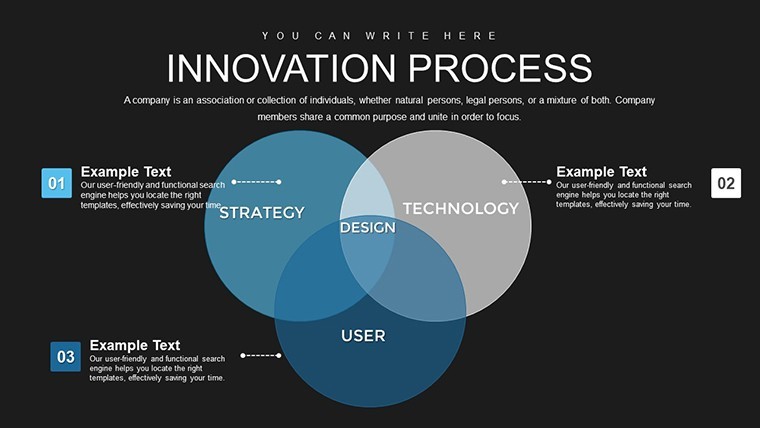
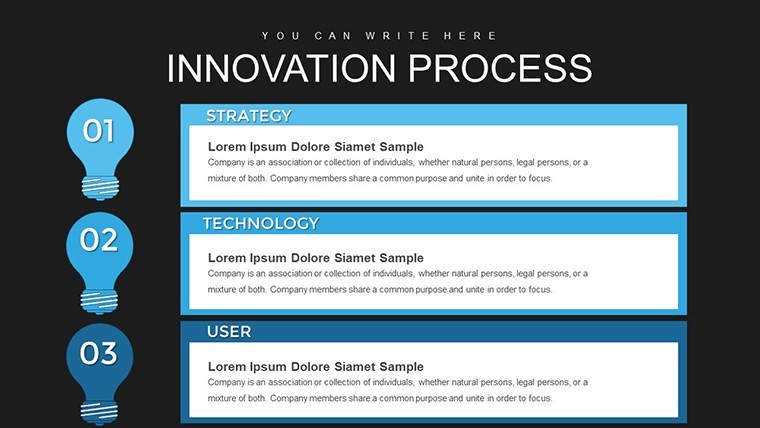
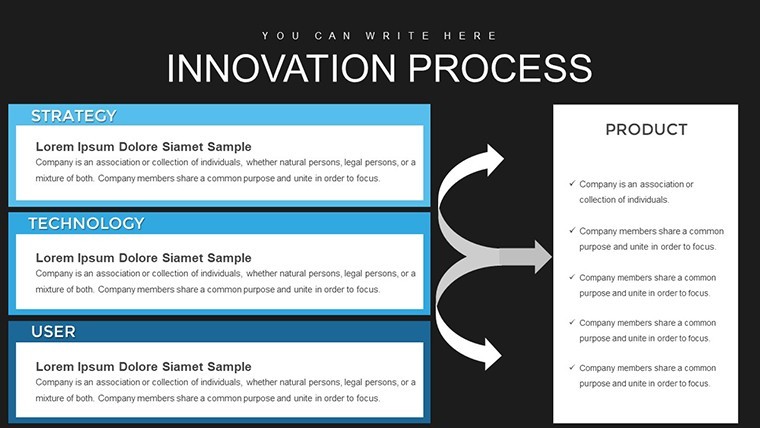
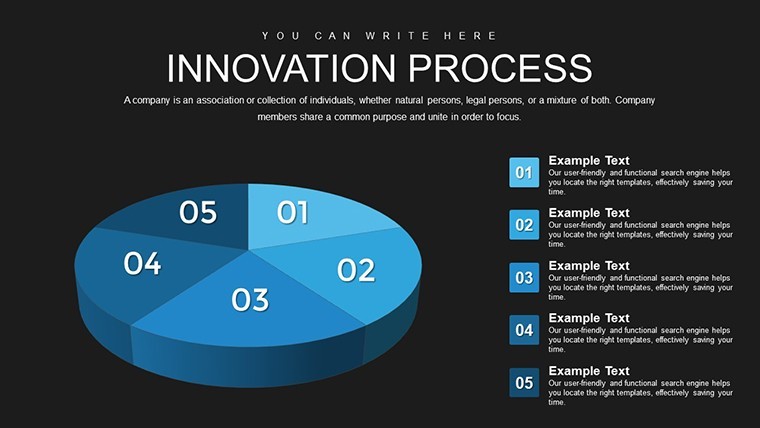
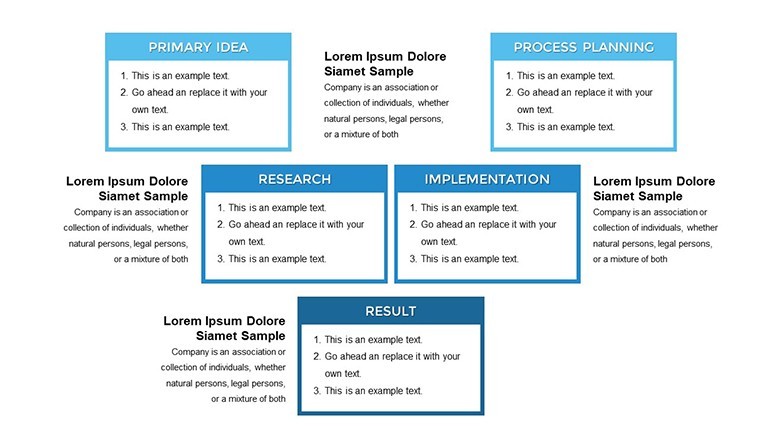
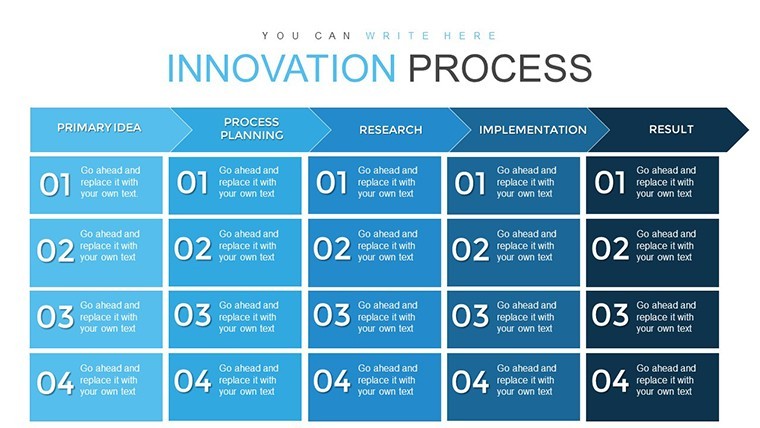
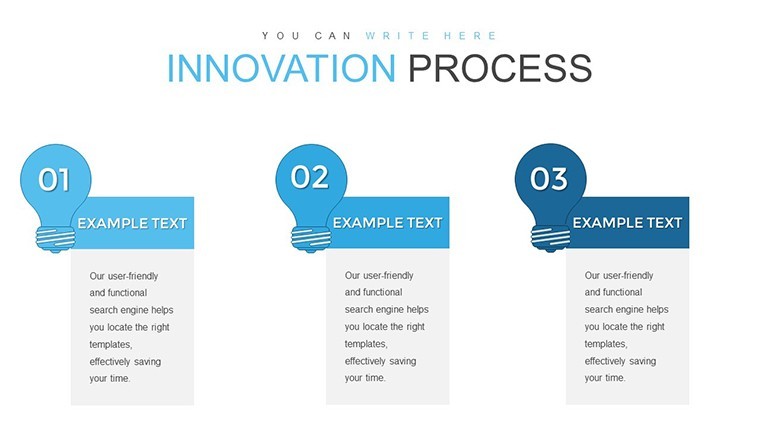
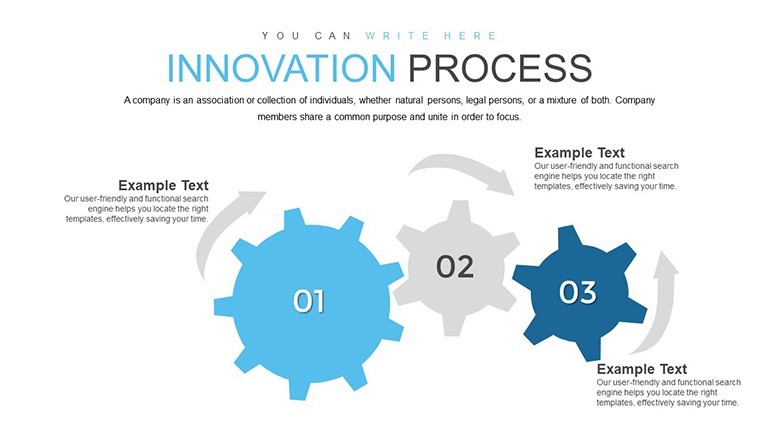
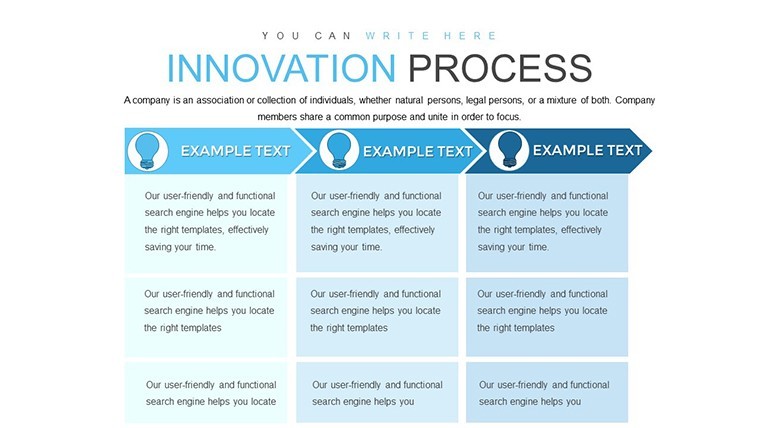
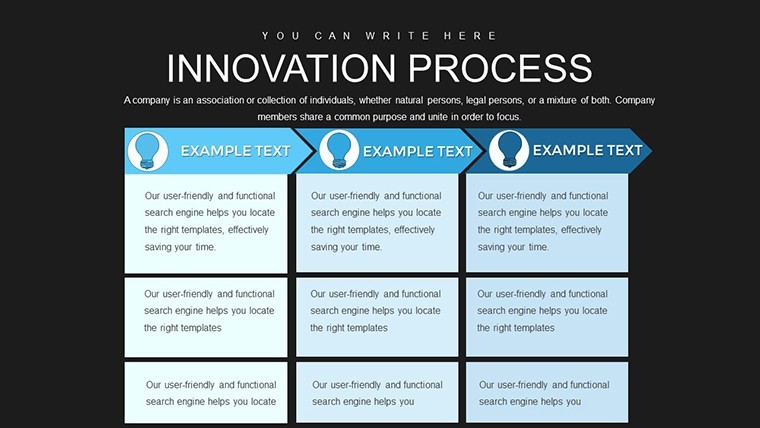
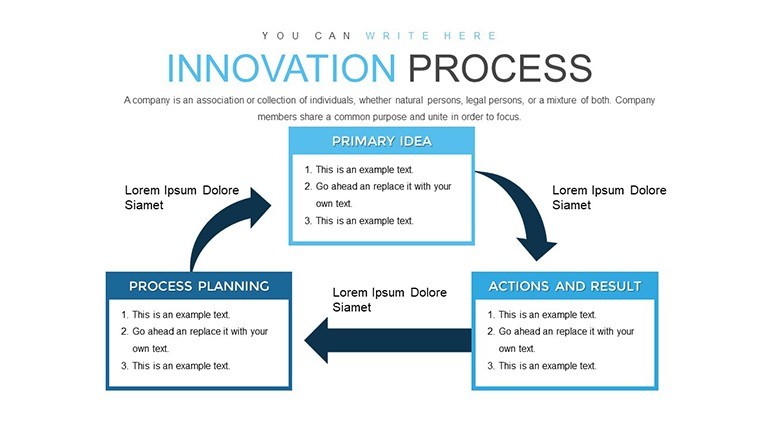
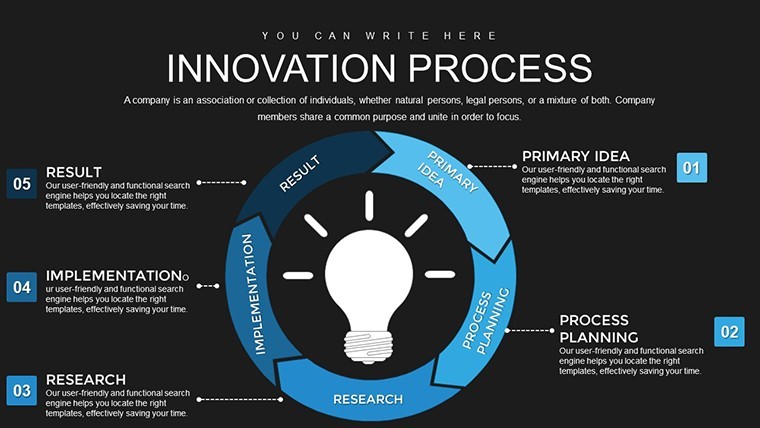
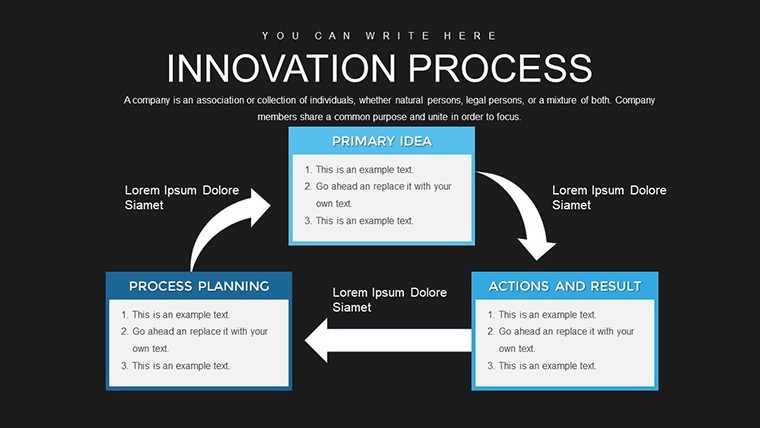
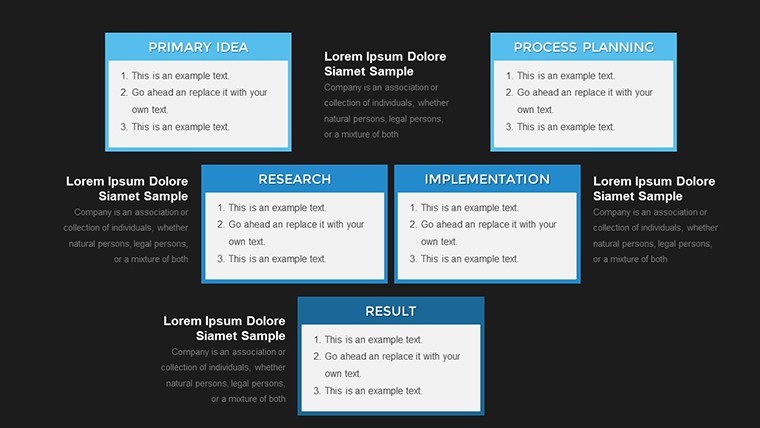
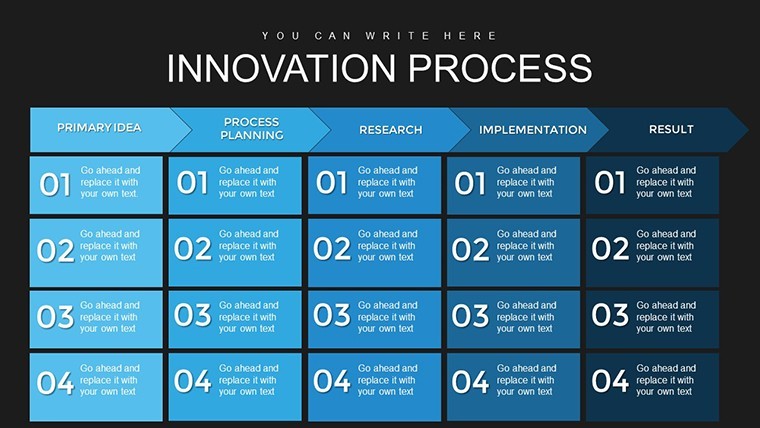
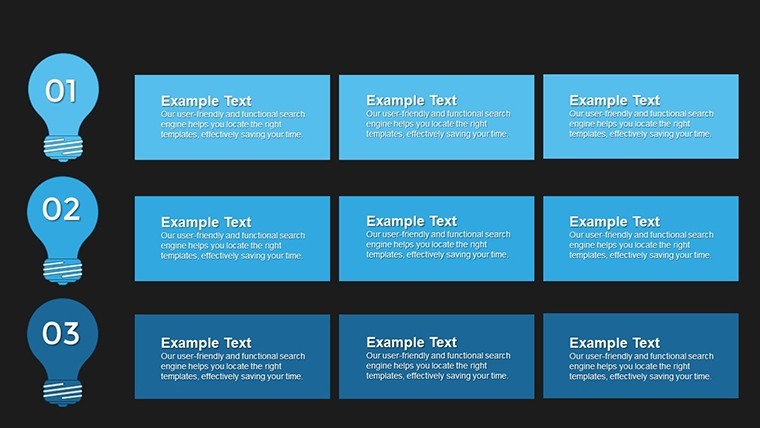
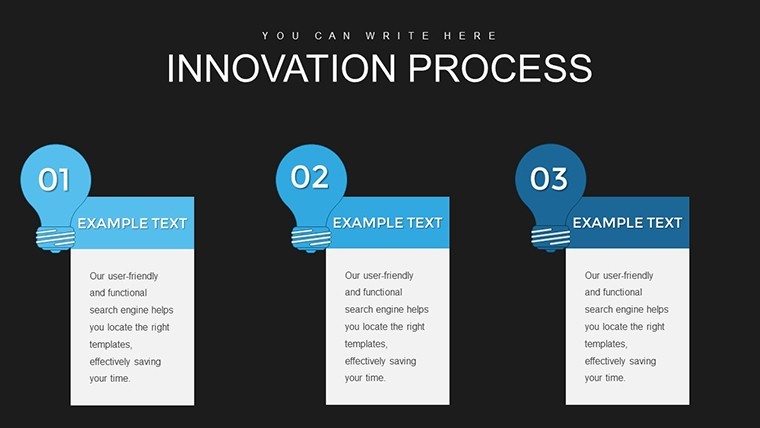
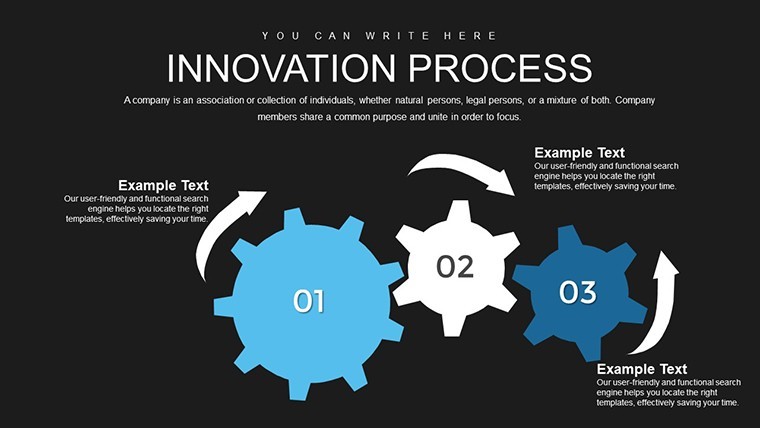
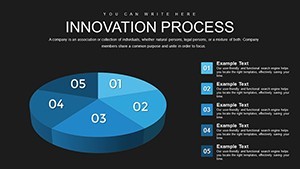
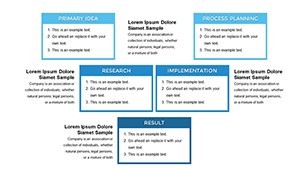
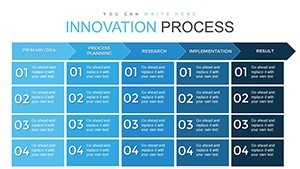
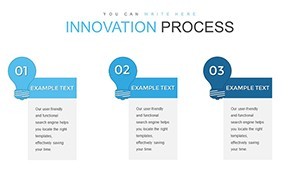
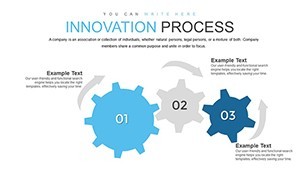
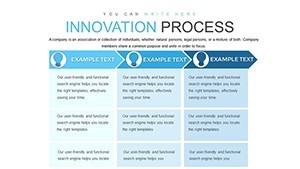
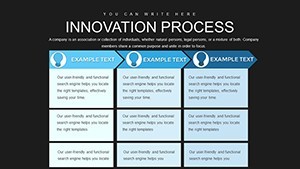
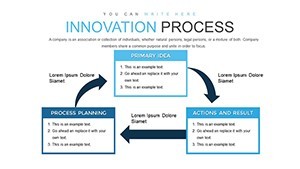
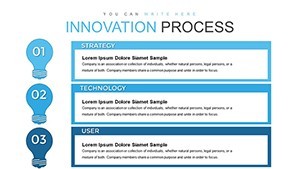
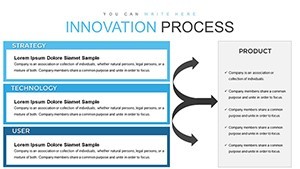
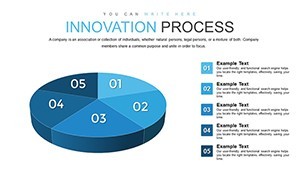
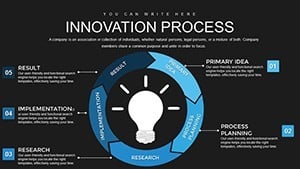
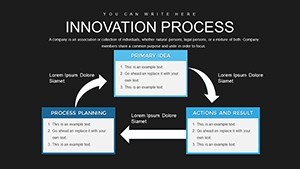
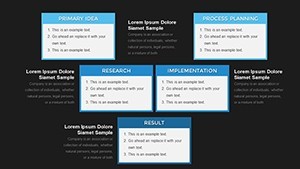
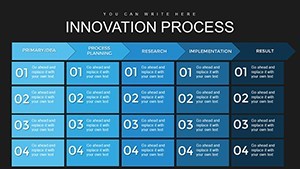
Innovation isn't just a buzzword - it's the engine driving modern businesses forward. Yet, navigating its complexities can be daunting without the right tools. Enter our Innovation Process Steps Keynote Template, a meticulously crafted resource with 24 editable slides dedicated to breaking down the five core stages of innovation. Designed for entrepreneurs, managers, and teams in dynamic markets, this template uses clear, relationship-focused charts to map out paths from problem identification to successful launch. By visualizing these steps, you'll not only clarify your strategies but also spark collaborative discussions that lead to breakthrough ideas.
Navigating the Five Pillars of Innovation with Ease
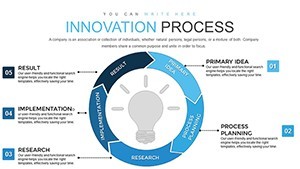
The innovation journey begins with spotting opportunities, a phase where research meets insight. This template's slides dedicate space to compiling market data into digestible charts, like bubble diagrams showing customer needs or bar graphs highlighting trends. Moving to idea generation, brainstorm-friendly layouts encourage wild creativity, with mind-map style charts to organize thoughts without losing momentum. Evaluation comes next, where feasibility charts compare options side-by-side, using weighted scoring systems inspired by tools like the Boston Consulting Group's matrix for strategic depth.
Development slides focus on prototyping, with timeline charts tracking iterations and feedback loops. Finally, implementation charts outline launch strategies, incorporating Gantt-like visuals for marketing and scaling plans. All within a business models category, ensuring alignment with frameworks like Lean Startup methodologies. The .key format guarantees flawless Keynote compatibility, with editable elements that let you infuse your brand's essence - change hues to evoke energy, or add icons representing your industry specifics.
Essential Features for Innovative Minds
- 24 Editable Slides: Tailored for each innovation step, from research overviews to launch roadmaps.
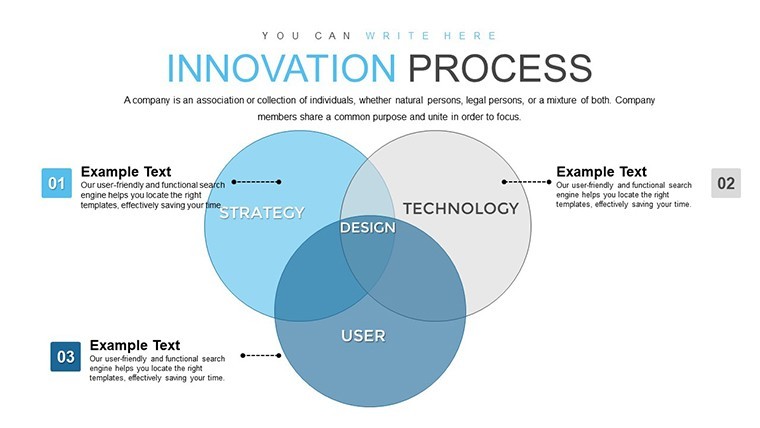
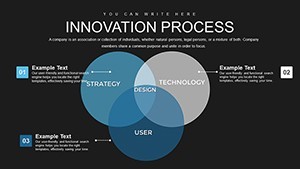
- Relationship Charts: Emphasize connections between ideas, teams, and outcomes for holistic views.
- Customizable Designs: Adjust text, shapes, and data inputs to reflect your unique innovation narrative.
- Business Model Integration: Aligns with proven strategies, enhancing strategic planning.
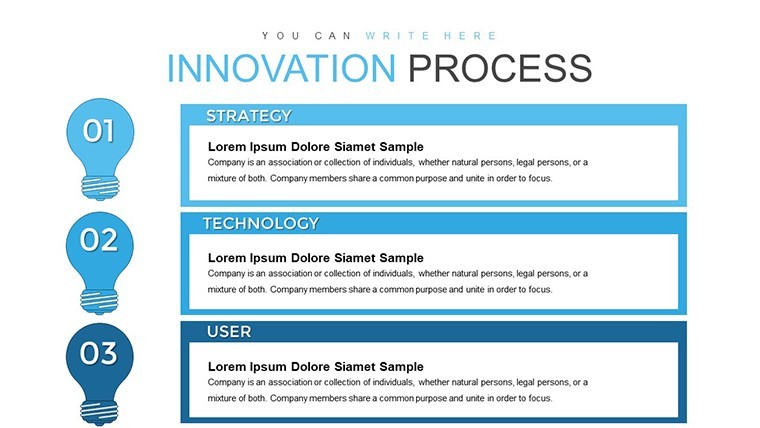
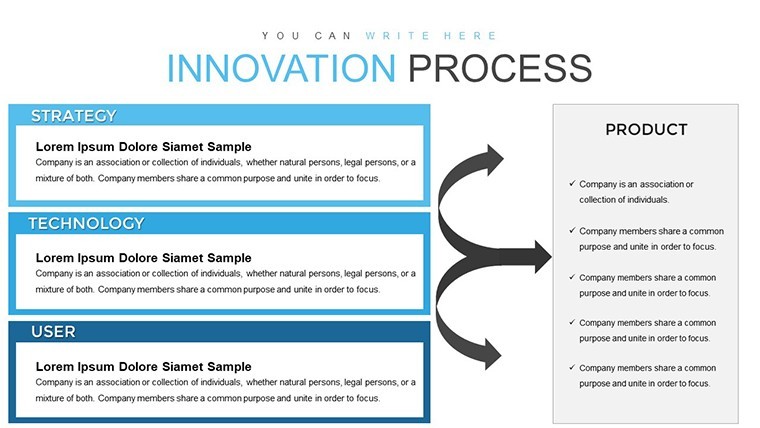
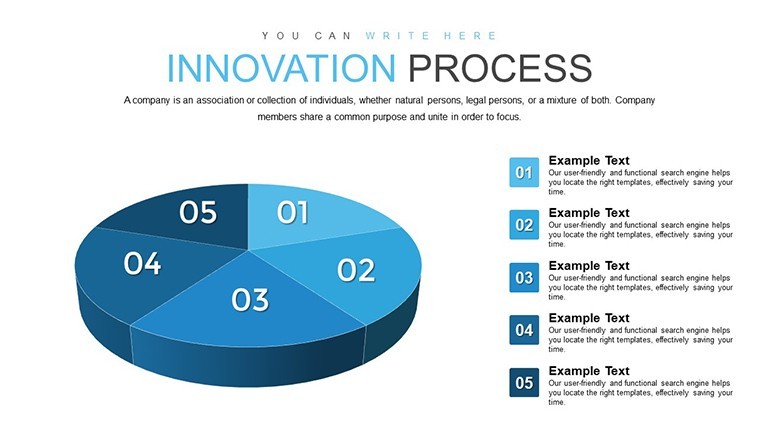
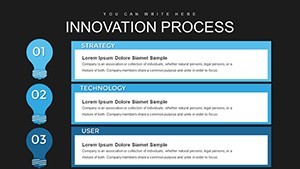
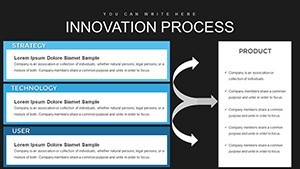
- Visual Variety: Includes diagrams, flows, and graphs to suit diverse presentation styles.
In practice, a tech startup might use these to pitch venture capitalists, showcasing how their app evolves from concept to market dominance. Or a corporate R&D team could refine internal processes, drawing on case studies like Apple's iterative design philosophy for inspiration.
Practical Use Cases: Turning Ideas into Reality
For product managers, this template simplifies stakeholder alignment by visually sequencing development phases, reducing misunderstandings. In workshops, facilitators leverage it to guide groups through ideation, using interactive charts that evolve in real-time. Educational applications shine too - business schools employ it to teach innovation cycles, backed by references to Harvard Business Review articles on disruptive technologies.
Consider a healthcare firm innovating patient care models: start with problem identification slides graphing demographic data, generate solutions via clustered charts, evaluate with risk-assessment matrices, develop prototypes in detailed flows, and implement with strategy canvases. This structured approach, rooted in agile principles, accelerates time-to-market while minimizing risks.
Mastering the Template: A Guided Workflow
- Import the File: Open the .key in Keynote and explore the slide deck.
- Personalize Content: Input your data into charts for immediate relevance.
- Enhance Visuals: Tweak colors and add animations for engaging reveals.
- Iterate Based on Feedback: Use evaluation slides to refine your own process.
- Present and Launch: Deliver with confidence, using the template as your innovation blueprint.
Unlike generic slides, this template's focus on relationships fosters deeper insights, often leading to 15-25% faster decision-making in team settings, as noted in innovation management studies.
Empowering Teams to Innovate Boldly
What sets successful innovators apart? A clear roadmap. This template provides that, weaving in elements from design thinking to ensure user-centric outcomes. For marketing pros, map campaign evolutions; for educators, illustrate curriculum development. Its trustworthiness stems from alignment with expert sources like IDEO's human-centered design, offering a reliable foundation for your ventures.
Embrace this tool to not only document but ignite innovation. Download, customize, and watch your ideas flourish into tangible successes. Ignite your innovation journey now.
Frequently Asked Questions
- How many steps does the template cover?
- It details five key innovation steps, with dedicated slides for each.
- Can I modify the charts for my industry?
- Yes, all elements are editable to fit sectors like tech, healthcare, or education.
- Is it suitable for team collaborations?
- Absolutely, with layouts designed for brainstorming and shared editing in Keynote.
- What makes this different from standard Keynote templates?
- Its focus on relationship charts and business models provides deeper strategic value.
- Does it include examples or placeholders?
- Yes, pre-filled placeholders guide you through customization.
- Can I add more slides if needed?
- Easily duplicate and edit slides to expand as your process requires.

