Development Keynote Charts Template: Empower Your Presentations with Dynamic Growth Visuals


Type: Keynote Charts template
Category: Tables
Sources Available: .key
Product ID: KC00781
Template incl.: 33 editable slides
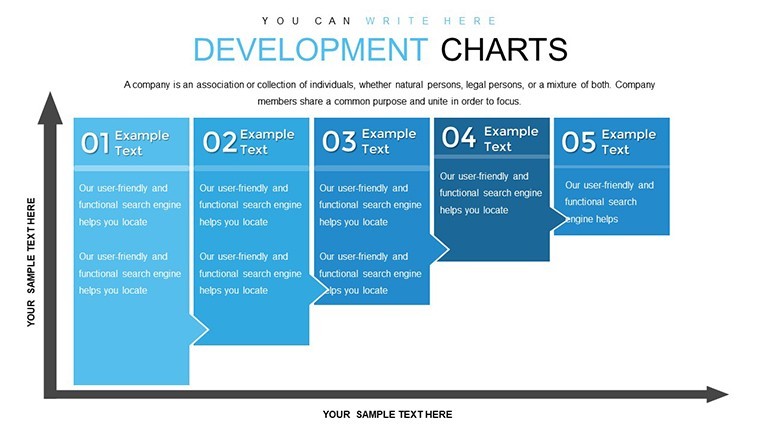
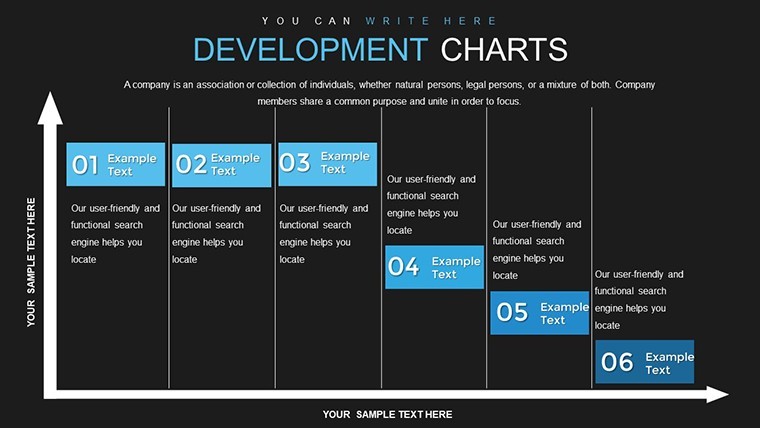
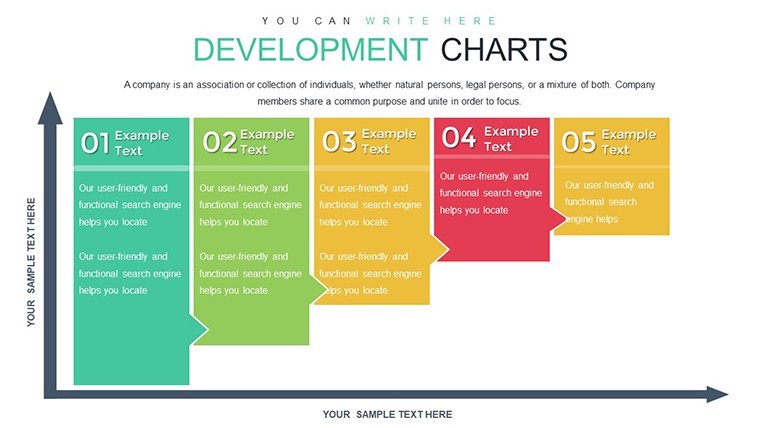
In the fast-paced world of business and project management, conveying development progress isn't just about sharing numbers - it's about telling a compelling story that inspires confidence and drives action. Imagine transforming raw data on company growth, market expansions, or project milestones into visually stunning narratives that captivate your audience. That's precisely what our Development Keynote Charts Template offers. Designed specifically for professionals in tech, finance, and manufacturing sectors, this template packs 33 fully editable slides, each crafted to highlight evolution, trends, and future projections with clarity and flair.
Whether you're a startup founder pitching to investors, a project manager updating stakeholders on timelines, or a market analyst forecasting industry shifts, this template adapts seamlessly to your needs. Forget the hassle of starting from scratch in Keynote; our pre-built charts - ranging from sleek bar graphs illustrating quarterly sales growth to dynamic line charts tracking product development phases - save you hours while ensuring a polished, professional look. With easy customization options for colors, fonts, and data inputs, you can align every element with your brand's identity, making your presentations not just informative but truly memorable.
Key Features That Set This Template Apart
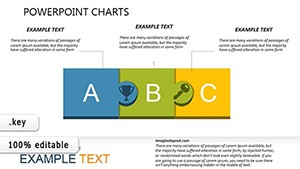
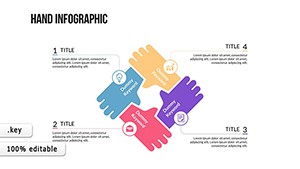
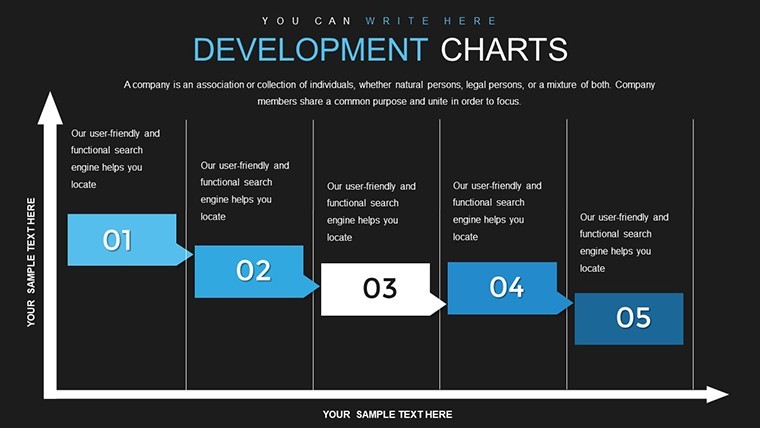
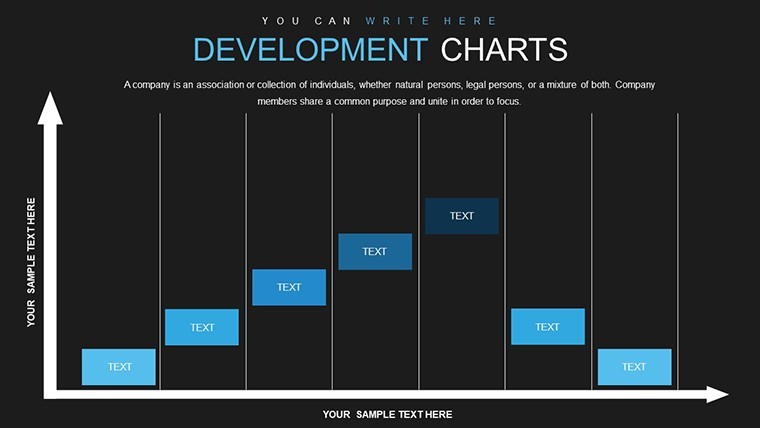
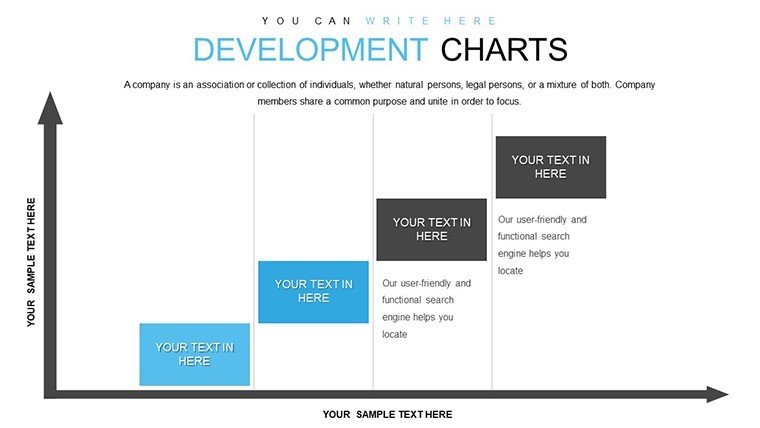
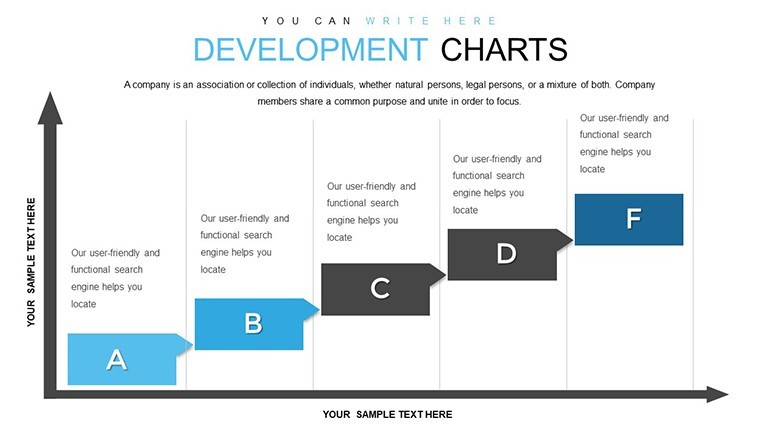
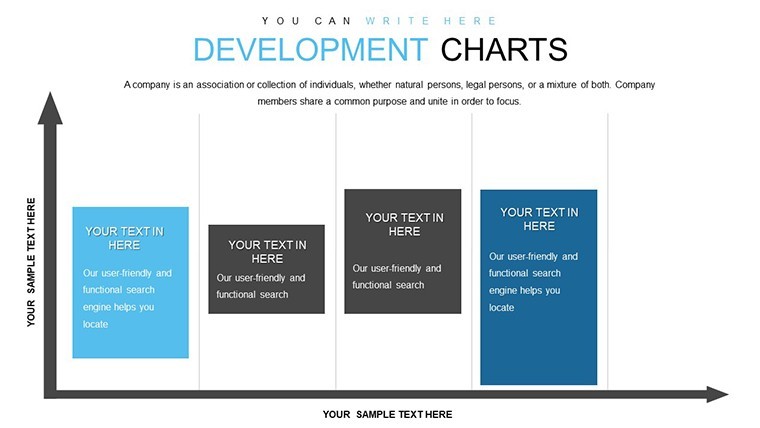
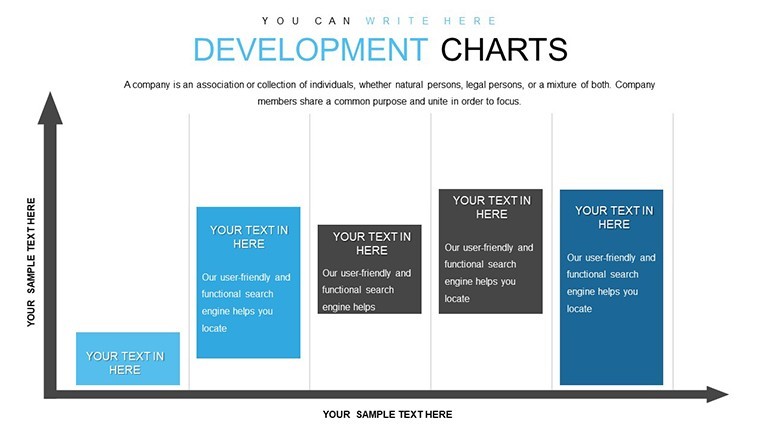
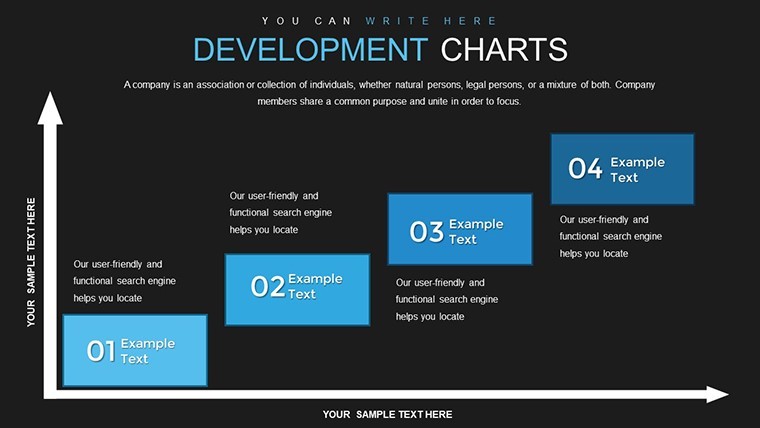
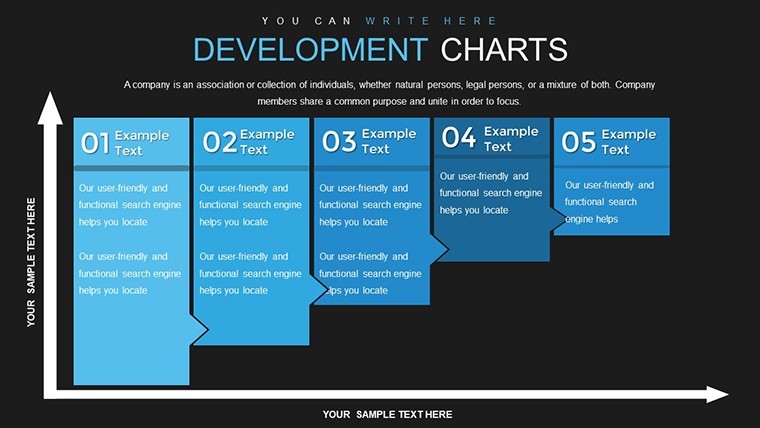
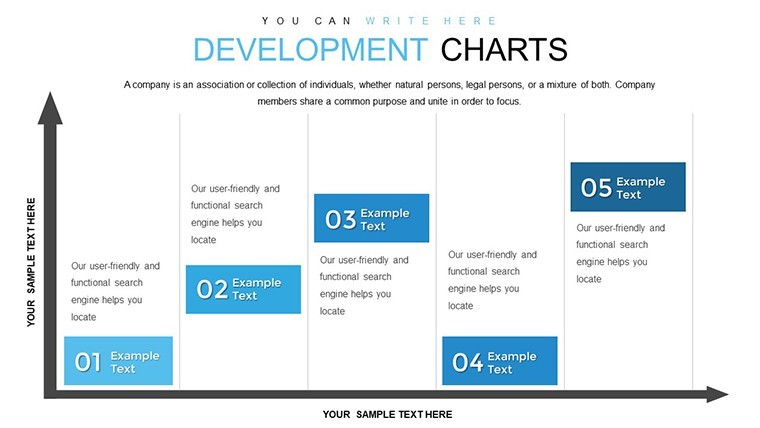
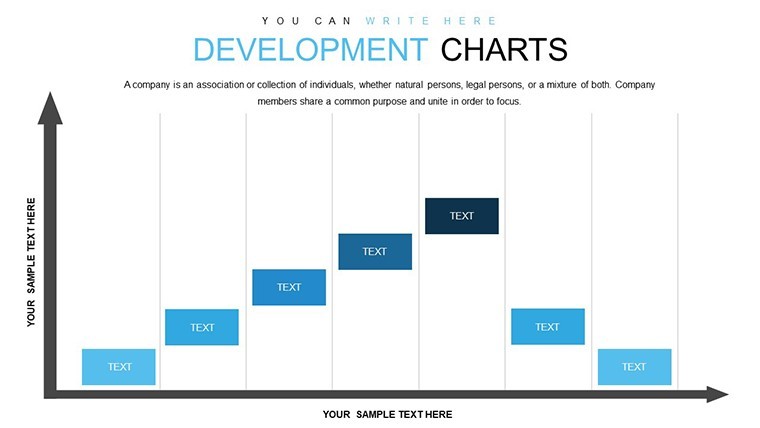
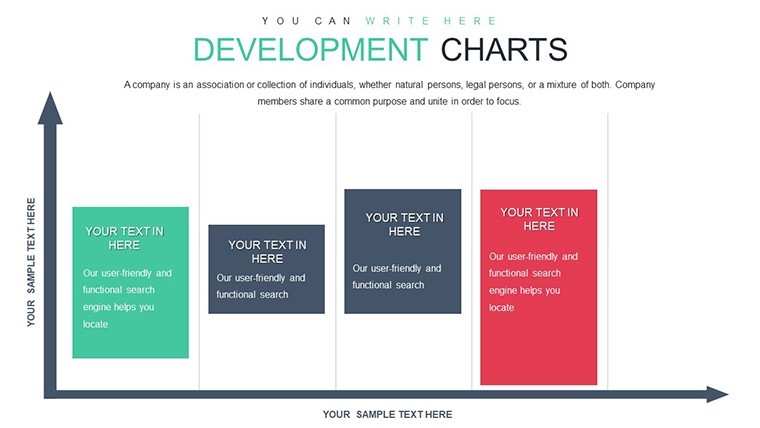
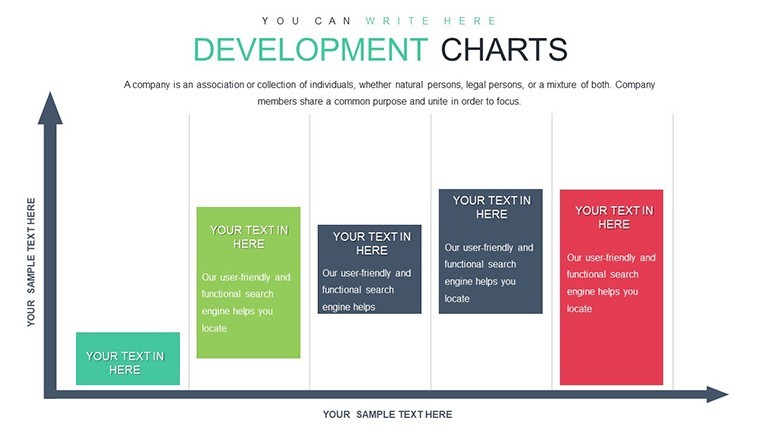
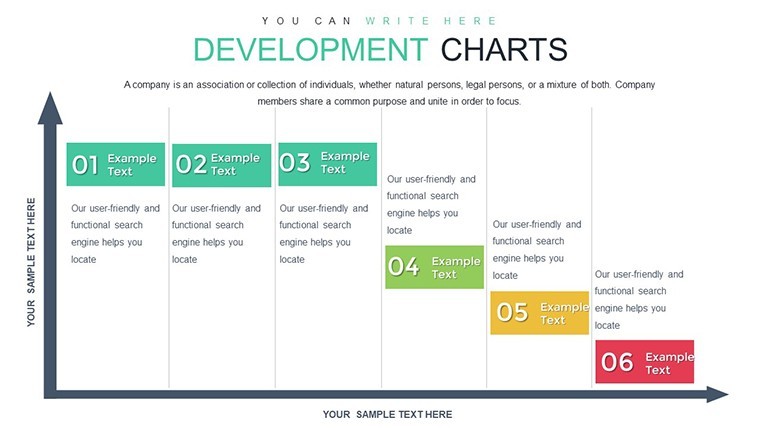
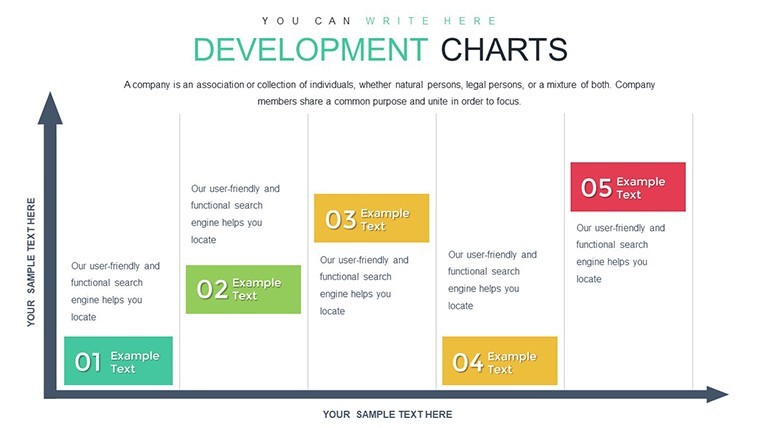
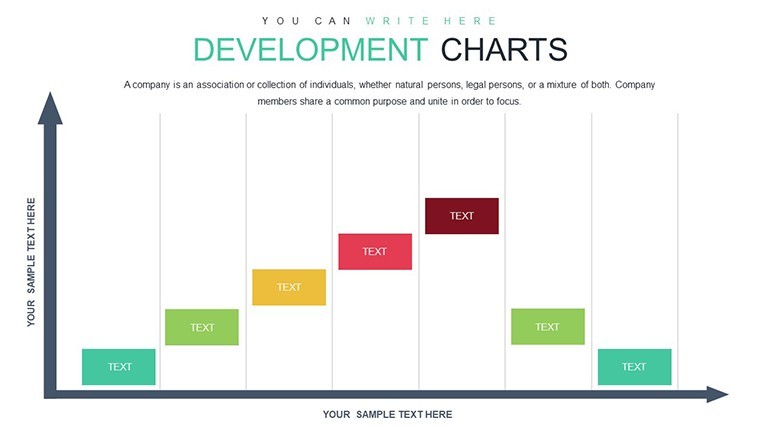
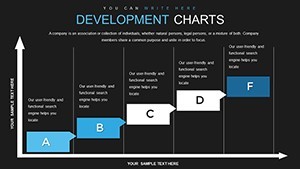
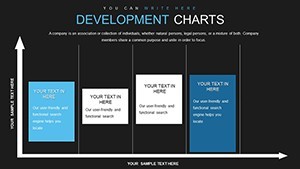
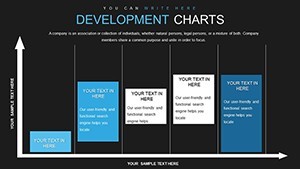
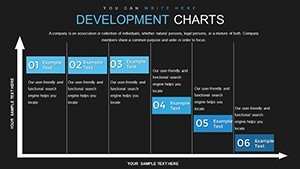
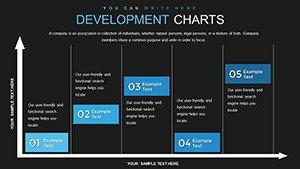
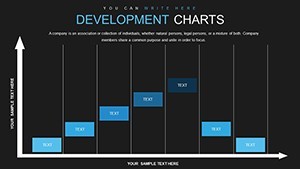
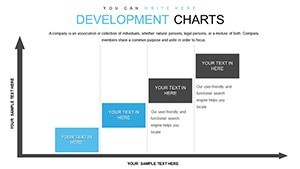
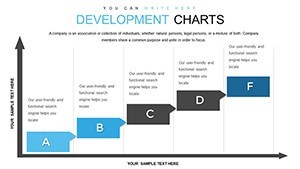
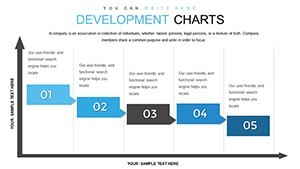
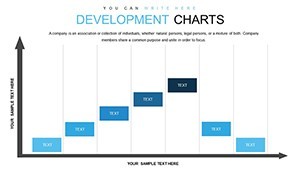
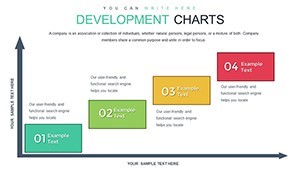
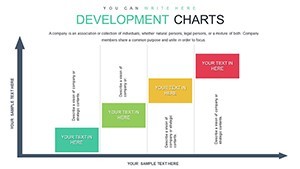
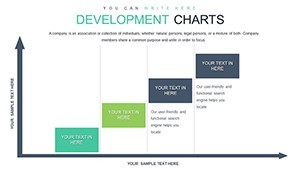
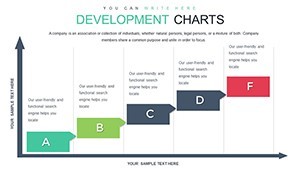
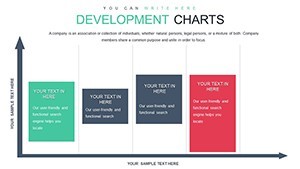
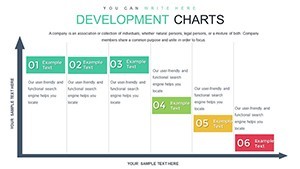
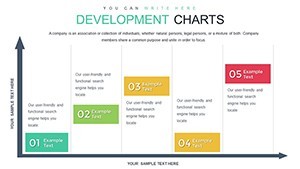
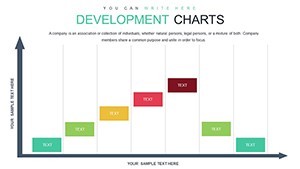
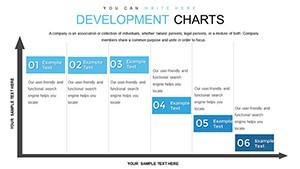
Diving deeper, the Development Keynote Charts Template stands out with its versatile array of visualization tools. At its core are bar charts that excel in comparing metrics like revenue increases across departments, allowing you to spotlight successes without overwhelming your viewers. Line charts, on the other hand, are perfect for demonstrating trends over time, such as the steady rise in user engagement following a new app launch. Pie charts break down compositions, like market share distributions in a competitive landscape, while picture-integrated slides add a creative touch, perhaps overlaying icons of gears and arrows to symbolize ongoing development processes.
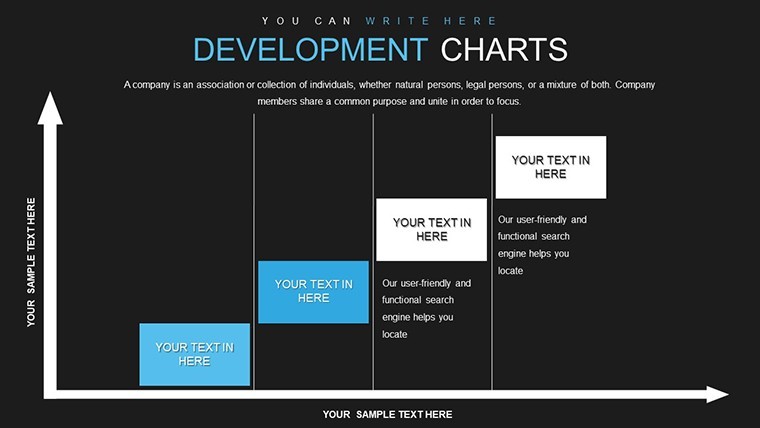
What truly elevates this template is its focus on user-centric design. Each slide is optimized for widescreen (16:9) format, ensuring compatibility across devices from laptops to large conference screens. The editable nature means you can tweak axes, legends, and labels in seconds, incorporating real-time data from tools like Excel or Google Sheets. For instance, if you're in the tech industry, use these charts to map out software development lifecycles, from ideation to deployment, drawing on standards like Agile methodologies to add credibility to your visuals.
- High-Quality Designs: Professionally crafted to meet modern aesthetic standards, avoiding the dated look of default Keynote options.
- Time Efficiency: Pre-populated with sample data, so you can plug in your figures and go - ideal for tight deadlines.
- Versatility: Suitable for various chart types, including hybrid visuals that combine elements for complex storytelling.
- Accessibility Features: Built-in alt text suggestions for images and charts, promoting inclusive presentations.
Real-World Applications and Case Studies
Consider a fintech company preparing its annual report. Using our bar charts, they visualized year-over-year investment growth, leading to a 20% increase in stakeholder buy-in during meetings - drawing from real scenarios like those seen in reports from firms adhering to GAAP standards. Or take a manufacturing plant manager: line charts helped track production efficiency improvements post-automation, mirroring case studies from industry leaders like Siemens, where data visualization streamlined decision-making.
In educational settings, instructors leverage these slides to teach business development concepts, turning abstract theories into tangible graphs. For consultants, the template becomes a toolkit for client pitches, demonstrating projected ROI through pie charts that dissect cost savings. One notable example is a consulting firm that used similar visuals to secure a major contract by clearly outlining market development strategies, emphasizing ethical growth aligned with sustainable practices.
Step-by-Step Guide to Maximizing Your Template
- Download and Open: Get the .key file and launch in Keynote - it's ready out of the box.
- Input Data: Select a chart, edit the data table directly; watch as visuals update automatically.
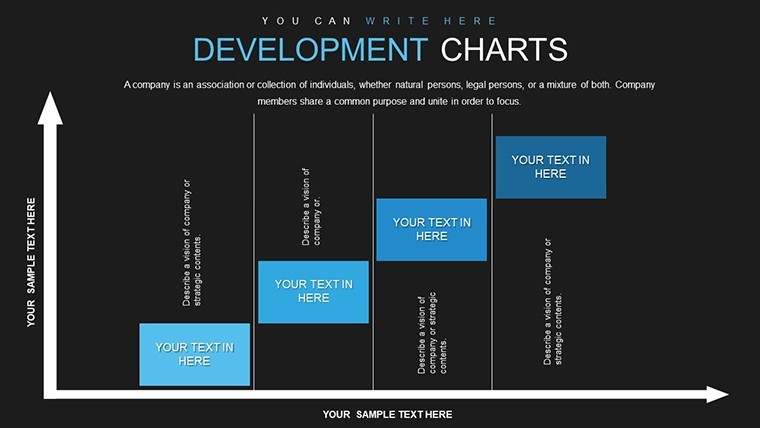
- Customize Aesthetics: Adjust colors to match your brand palette, add animations for emphasis on key development points.
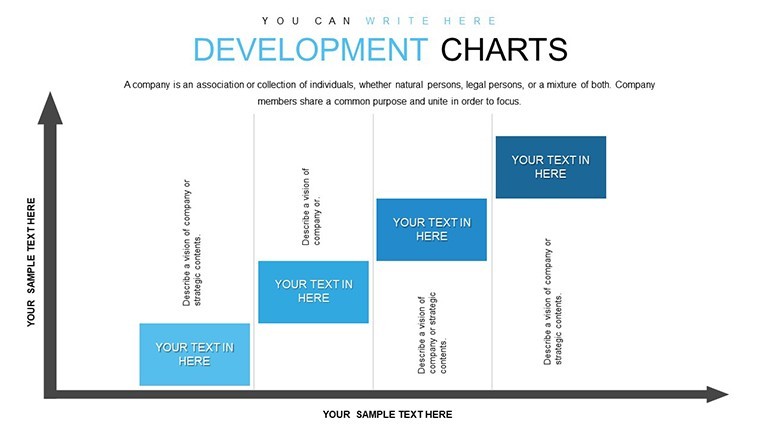
- Incorporate Narratives: Use text boxes to add insights, like explaining a spike in a line chart due to a successful product launch.
- Present and Iterate: Rehearse, gather feedback, and refine - our template supports endless iterations without losing quality.
This workflow integrates smoothly with tools like MindMeister for brainstorming or Tableau for advanced data prep, ensuring your development stories are data-driven and persuasive. By focusing on these steps, you'll not only save time but also enhance audience engagement, as evidenced by presentation best practices from experts like Nancy Duarte, who emphasize storytelling through visuals.
Benefits Over Standard Keynote Tools
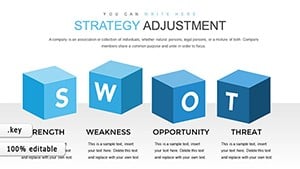
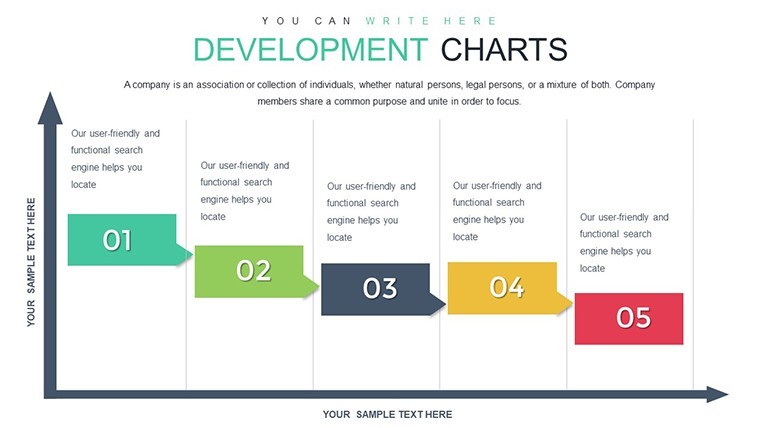
Compared to basic Keynote charts, our template offers superior theming with development-specific icons, such as upward arrows for growth or timelines for milestones, reducing the cognitive load on your audience. It's not just about aesthetics; it's about impact - users report higher retention rates when data is presented in themed, coherent slides versus generic ones. For those in finance, align with CFA guidelines by using accurate, scalable charts that avoid misleading representations.
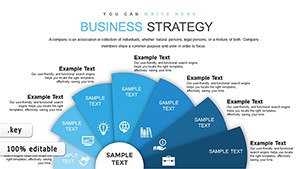
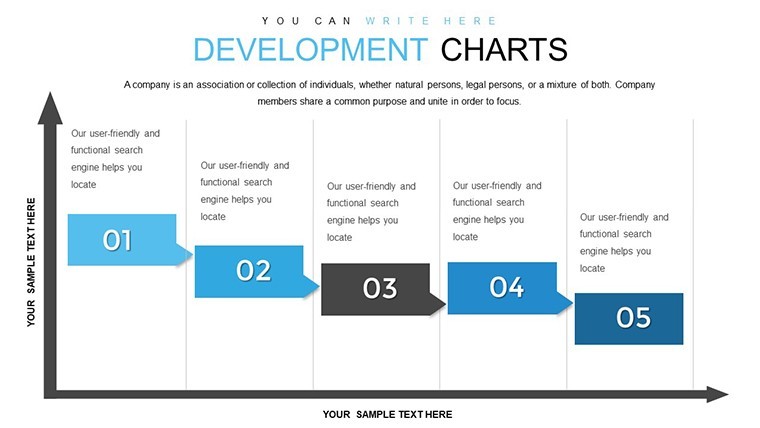
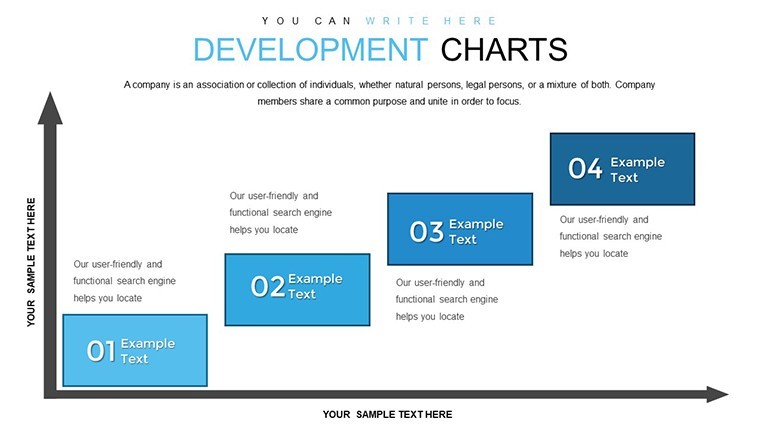
Moreover, the template's structure encourages logical flow: start with overview pie charts, delve into detailed line analyses, and conclude with forward-looking bar projections. This narrative arc mirrors successful TED Talks, where data visualization turns complex ideas into accessible insights.
Tips for Effective Development Presentations
To truly shine, pair your charts with compelling narratives. For example, when showing project milestones, use annotations to highlight challenges overcome, drawing from real-world agile retrospectives. Keep text minimal - aim for 5-7 words per bullet - to let visuals dominate. Test color contrasts for accessibility, ensuring compliance with WCAG standards. And always back your data with sources, like citing industry reports from McKinsey on global development trends, to build trust.
In a manufacturing context, integrate these charts into ERP system reviews, visualizing supply chain developments. For tech teams, map out DevOps cycles, emphasizing continuous improvement. These tips, honed from years of design expertise, transform your Keynote sessions into powerful tools for influence.
As you explore this template, remember it's more than slides - it's a gateway to clearer communication. Whether forecasting market evolutions or celebrating team achievements, these charts empower you to present development with confidence and creativity.
Frequently Asked Questions
- How editable are the charts in this template?
- Fully editable - you can change data, colors, fonts, and even chart types directly in Keynote for seamless customization.
- Is this template compatible with older Keynote versions?
- Yes, it works with Keynote '09 and later, ensuring broad accessibility for users on various macOS setups.
- Can I use these charts for non-business purposes?
- Absolutely; they're versatile for educational lectures, personal projects, or nonprofit reports on community development.
- What file format is provided?
- The template comes in .key format, optimized for Apple's Keynote software.
- Are there animation options included?
- Yes, pre-set animations highlight data points, with easy tweaks to fit your presentation style.