SEO Infographic Keynote Charts - Editable | ImagineLayout


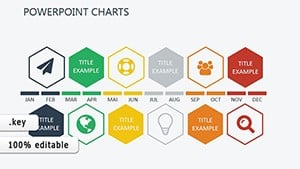
SEO Infographic Charts for Data Visualization
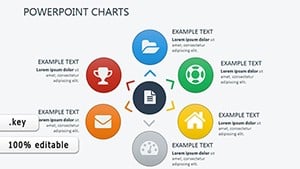
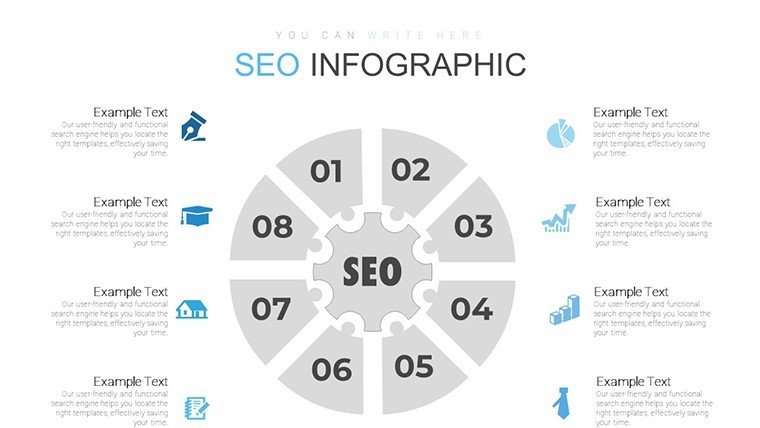
26 editable SEO infographic slides deliver actionable insights from data in a single KEY file. Everything is already structured.
The paid version supplies the complete 26 slides with editable charts and media slots suited for marketing campaign summaries or performance reporting.
You insert your SEO numbers and the layouts organize the information instead of creating custom infographics manually.
In most cases marketing teams only replace text and adjust colors.
SEO specialists use this when they need to present key metrics to executives without overwhelming the audience.
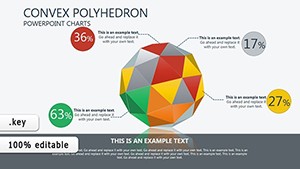
The infographic structure supports comparison and prioritization of data so viewers can decide on the next optimization step.
This template works best for structured diagrams and is not ideal for data-heavy dashboards.
It is not designed for creative storytelling slides with loose narrative flow.
Use this instead of building infographic elements from scratch.
The predefined charts keep structure readable on one slide preventing overcrowded layouts in stakeholder reviews.
Typically teams reuse the same file across monthly performance updates.
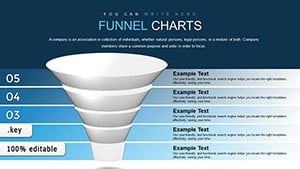
Look at the Boost Sales SEO Services Keynote Charts Template or the Funnel Keynote Chart for related options.
| Feature | Details |
|---|---|
| Slides / diagrams | 26 SEO infographic diagrams |
| File format | KEY |
| Software version | Keynote 9+ compatible with Mac and iPad |
| Color schemes | Customizable colors and media slots updated via slide master |
| Editable elements | Charts text colors and added media resize independently |
| Aspect ratio | 16:9 widescreen |
| Free vs Paid | Paid version includes the full 26 editable slides |
| Masters / Backgrounds | Slide master for global color updates |
What Keynote versions are supported?
The template works with Keynote '09 and later versions on any macOS installation. It maintains full editability on both desktop and iPad versions of the app. You can open it directly and all animations and transitions remain functional.
How do I change colors via the slide master?
Open the file in Keynote then select View and choose Edit Master Slides. Select the shapes or text on the master slide and update fill stroke or font color in the format panel. This single change applies across every slide instantly.
Can I use this template for client work?
You can use the template for client work under the standard license terms. Modify the slides and deliver the presentation file to your clients without restriction on the output. The only condition is that you do not resell or redistribute the original template file itself to third parties.
What is the difference between free and paid versions?
The paid version includes the complete set of 26 editable slides with all branch structures and icons unlocked. No free version is listed on the page so the purchase gives you the full file immediately. You receive everything needed for immediate use upon download.
What are the refund conditions?
Refunds are available if the template does not open correctly in your Keynote version within the first 14 days. Contact the support team with your purchase receipt and details of the issue for prompt processing. Note that once the file is downloaded and used the refund window closes per standard digital policy.
You open the file and start editing.
Download and start editing immediately