Editable Analytics Tutorial Charts Keynote - Instant Download | ImagineLayout


Type: Keynote Charts template
Category: Analysis
Sources Available: .key
Product ID: KC00681
Template incl.: 40 editable slides
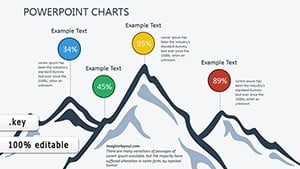
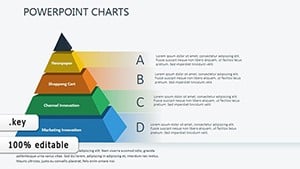
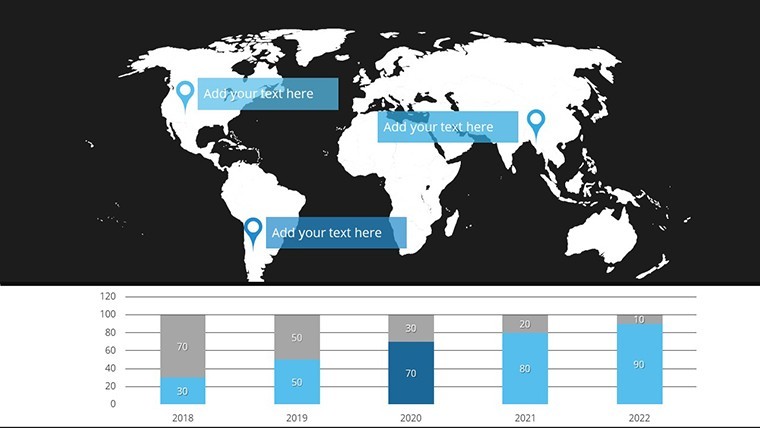
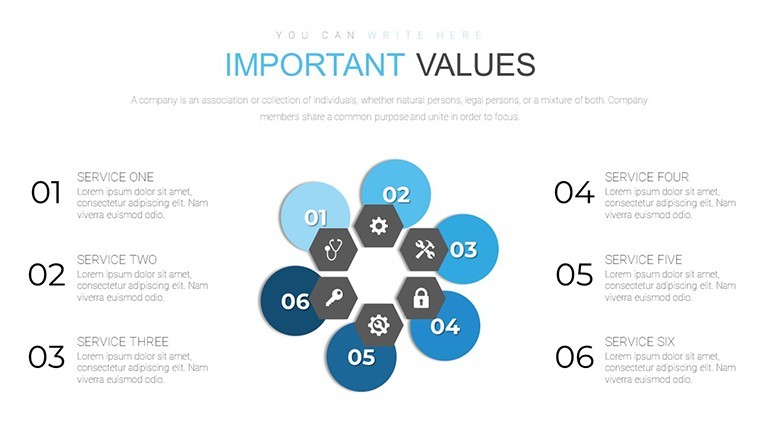
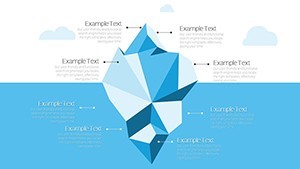
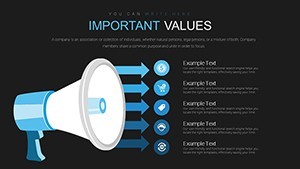
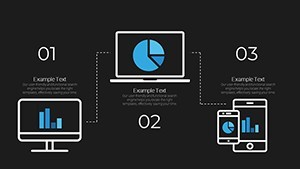
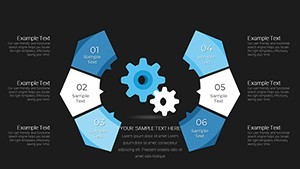
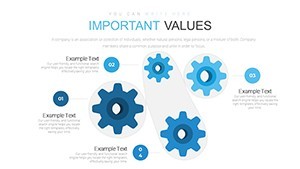
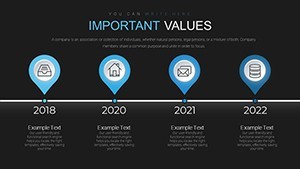
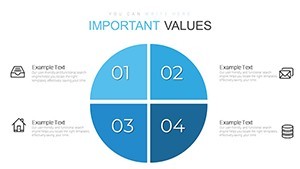
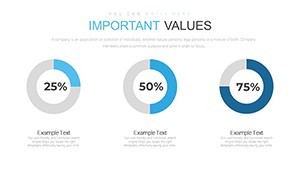
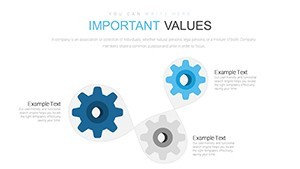
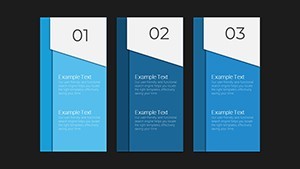
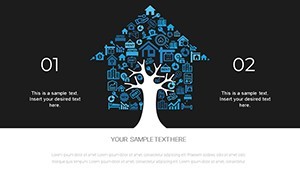
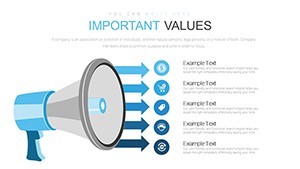
Editable Analytics Tutorial Charts
What's in the paid version? 40 editable slides with tutorial elements for growth insights.
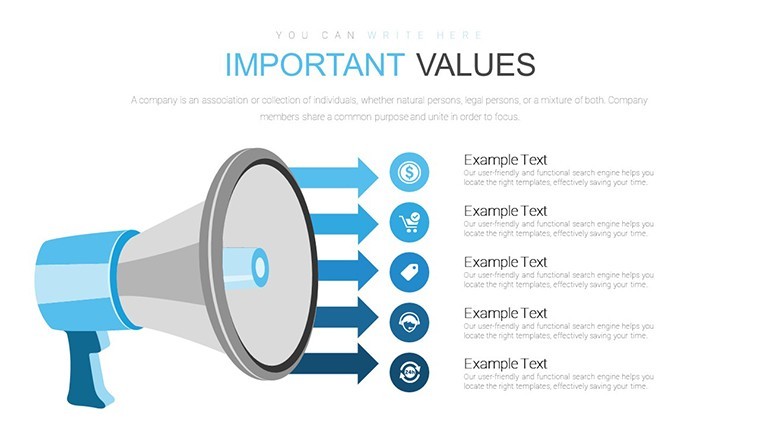
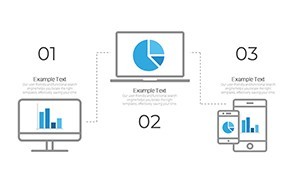
The KEY file includes 40 analytics tutorial diagrams ready for immediate data entry.
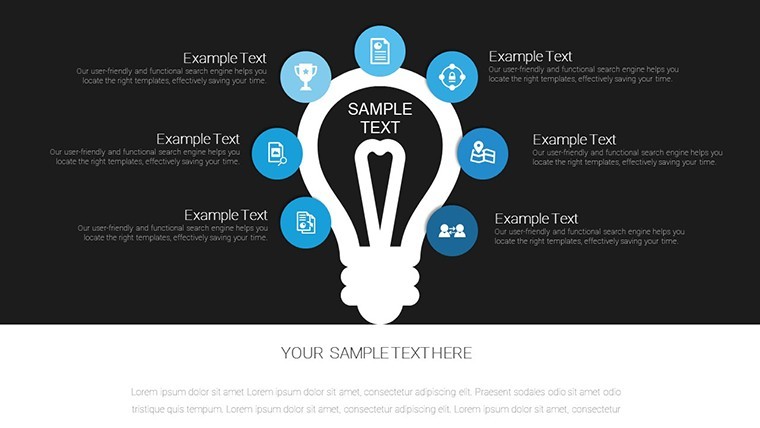
In most cases you only replace numbers while the tutorial layout guides the viewer. The page does not list color schemes or free version details but paid gives the full set.
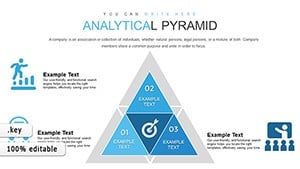
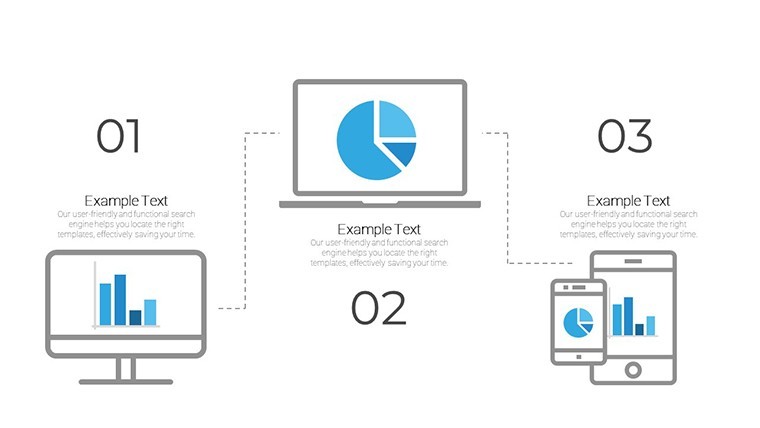
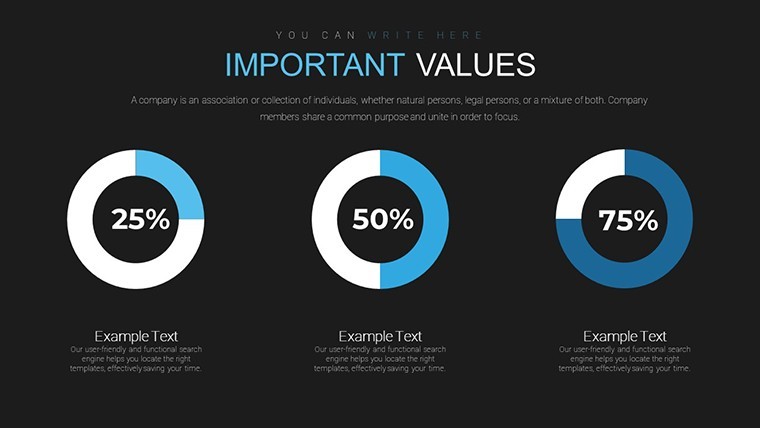
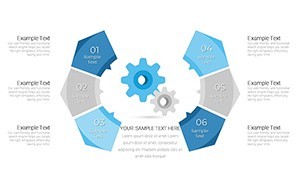
Analysts preparing growth reports for leadership use this to break down metrics step by step. The file replaces manual chart creation so you focus on insights instead of alignment.
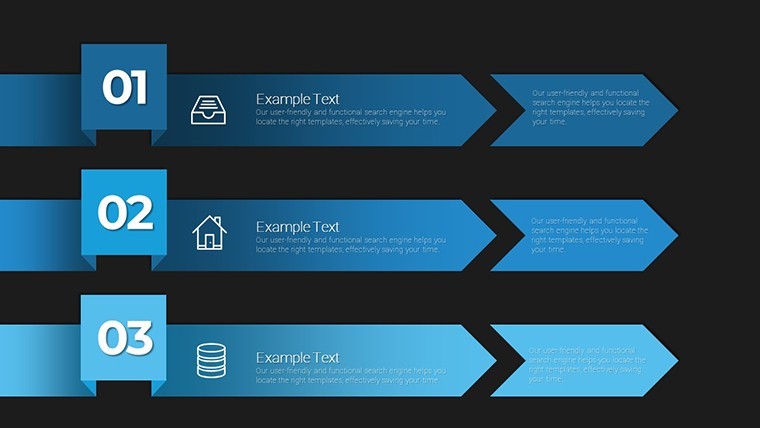
You can duplicate slides and reuse the same structure. Color changes happen via the slide master in recent Keynote versions. Tutorial elements help new users understand the flow.
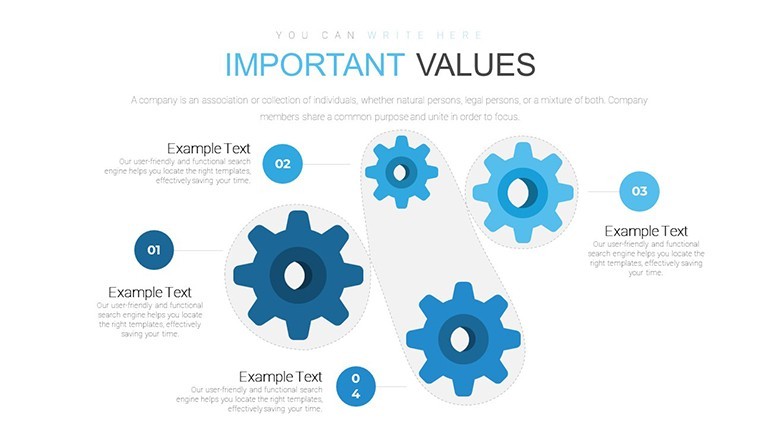
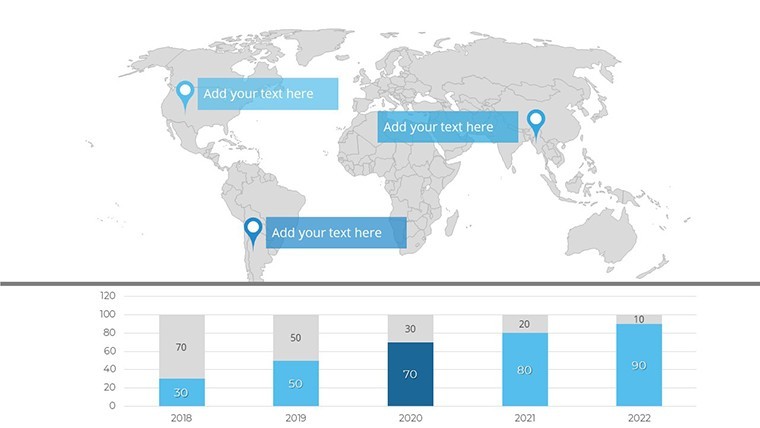
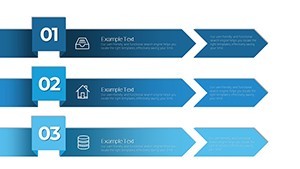
This Keynote chart template supports data analysis and decision making. After using it viewers identify trends and make clear choices on next actions.
It works best for structured tutorial sequences not open-ended brainstorming slides. The file is not ideal when you present raw dashboards without explanatory steps.
See also Analytical Reviews Keynote Charts and Data Analysis Graphs Keynote Charts Template.
Specifications
| Feature | Details |
|---|---|
| Slides / diagrams | 40 analytics tutorial charts |
| File format | KEY |
| Software version | Recent Keynote versions |
| Color schemes | Not specified on page, edit via master |
| Editable elements | data points, tutorial text and visuals fully adjustable |
| Aspect ratio | 16:9 |
| Free vs Paid | Paid includes 40 editable slides |
| Masters / Backgrounds | Fully editable with tutorial guides |
How do I change colors via the slide master?
To change colors open the slide master view in Keynote. Select the master slide and update the color palette for all objects. Apply the changes and they propagate to every diagram automatically in most cases. The process takes under a minute once you know the steps.
Can I use this template for client work?
You can use the template for client work under the standard license. The file remains your property but you cannot resell the original design as is. Contact support for enterprise licensing if needed for multiple users.
What is the difference between free and paid?
The paid version delivers the complete set of 40 editable slides. The page does not specify what the free version includes exactly. In practice you get the full diagrams only with the paid purchase.
What are the refund conditions?
Refunds are processed if the file does not open correctly in your Keynote version. Submit a request within 30 days with your download details. The team reviews and issues a refund if the issue cannot be resolved with support guidance.
How do I apply the template to an existing presentation?
Open your existing Keynote file then import the master slides from this template. Match layouts slide by slide to transfer content. In most cases only minor adjustments are needed after import.
You open the file and start editing.
Download and start editing immediately