Tornado Funnel Charts Keynote - Instant Download | ImagineLayout


Type: Keynote Charts template
Category: Flow
Sources Available: .key
Product ID: KC00678
Template incl.: 20 editable slides
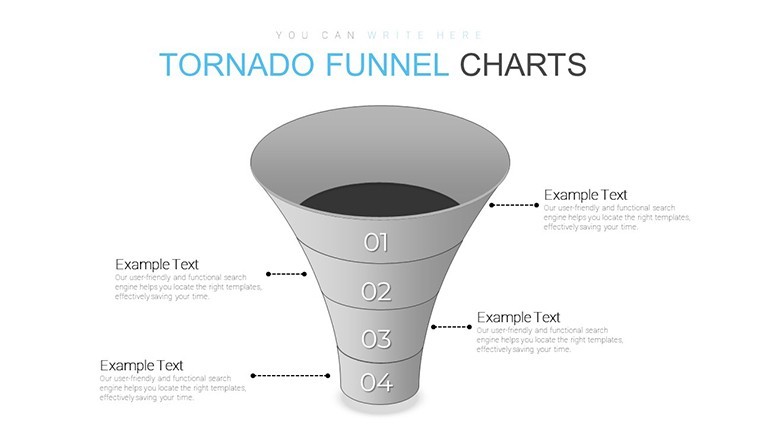
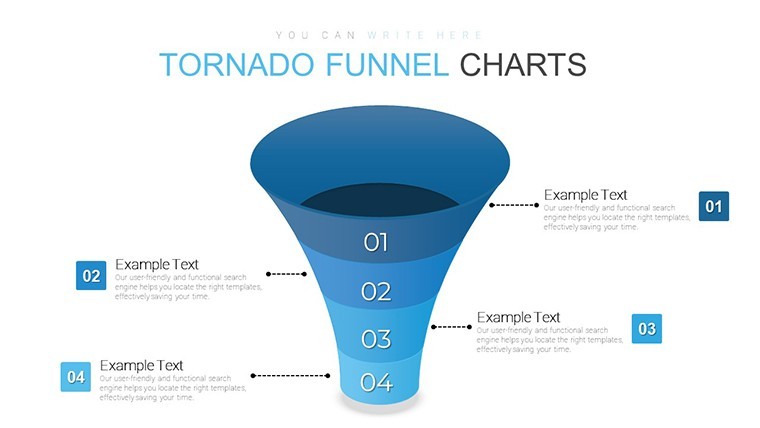
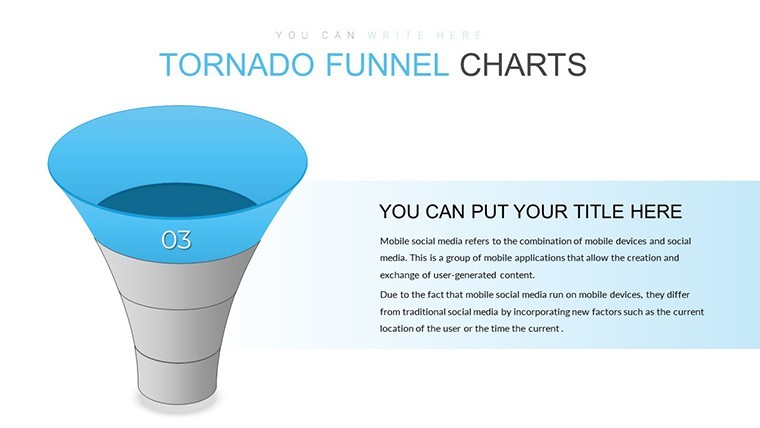
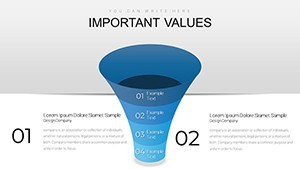
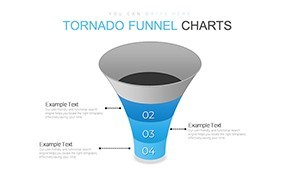
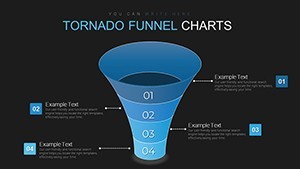
Tornado Funnel Charts Keynote
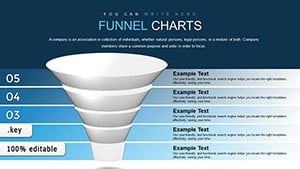
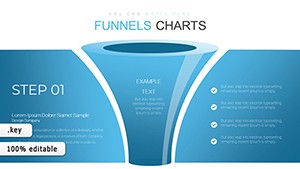
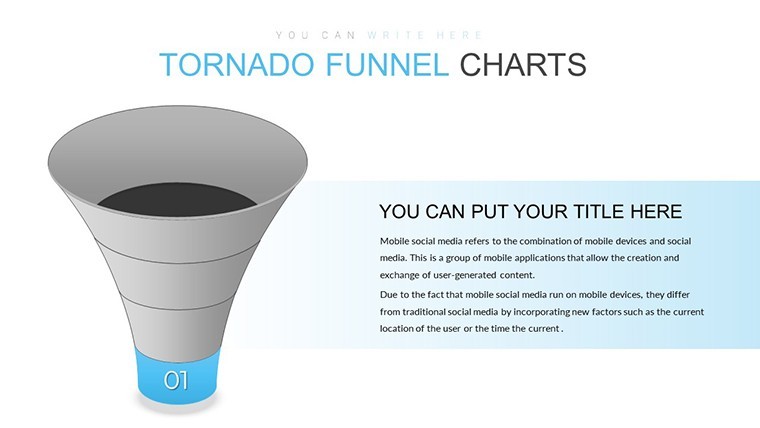
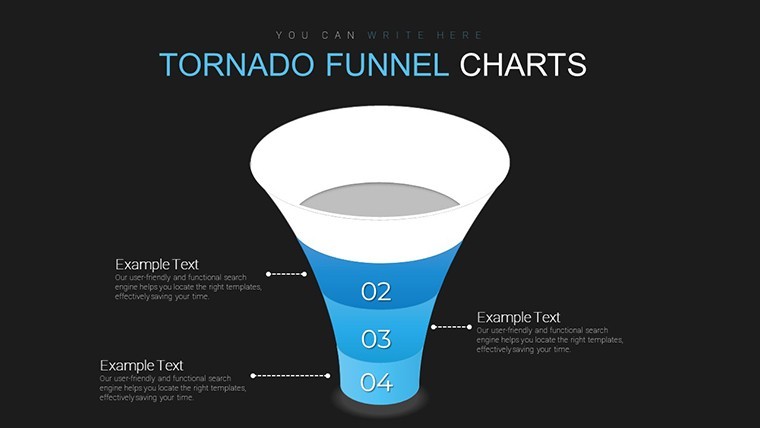
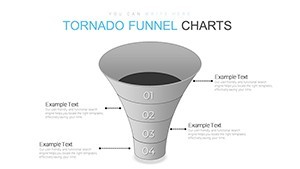
The KEY file delivers 20 tornado funnel diagrams ready for any sales pipeline review. You drop in your stage data and the narrowing flow structure handles the rest.
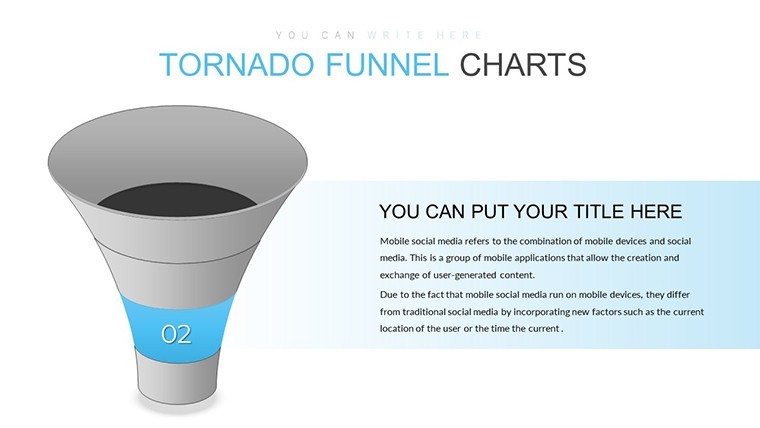
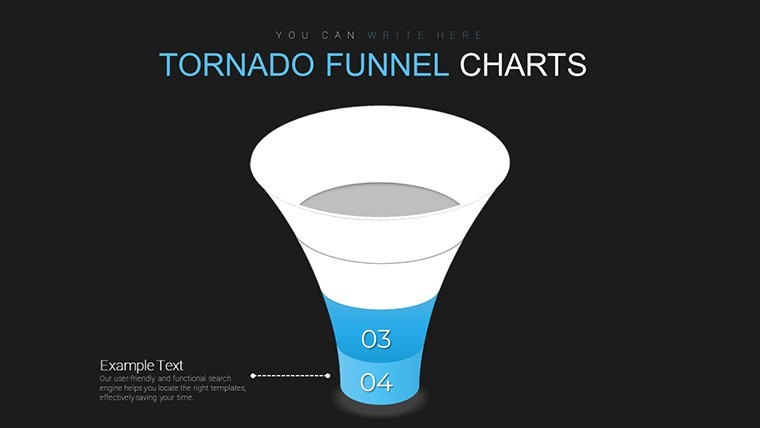
In most cases you only replace text and adjust colors. No setup needed.
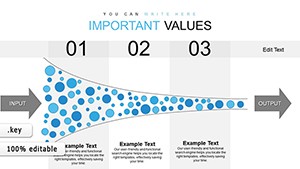
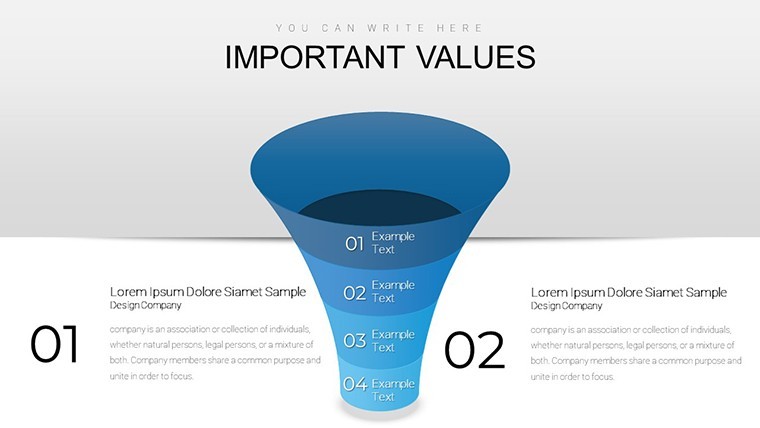
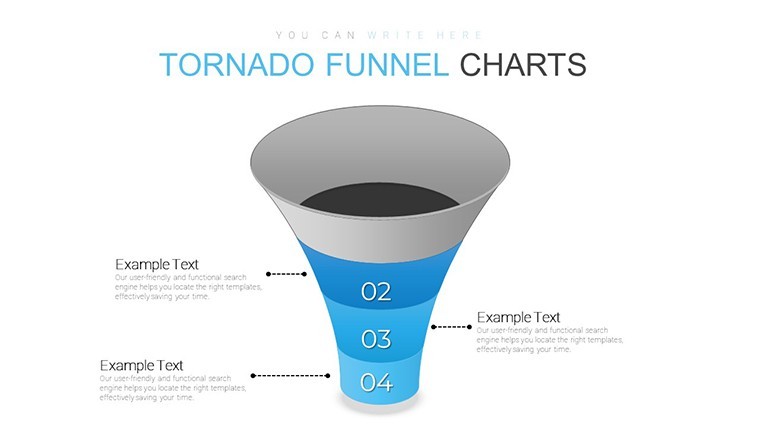
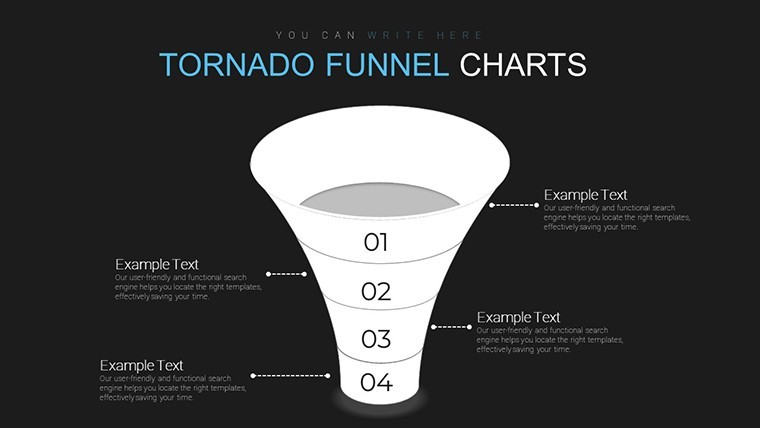
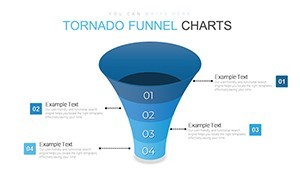
The paid version includes the full 20 slides with all diagram types while the page does not list exact free version contents. The layouts feature horizontal linear structure with filled icons and arrows that keep everything aligned on one slide.
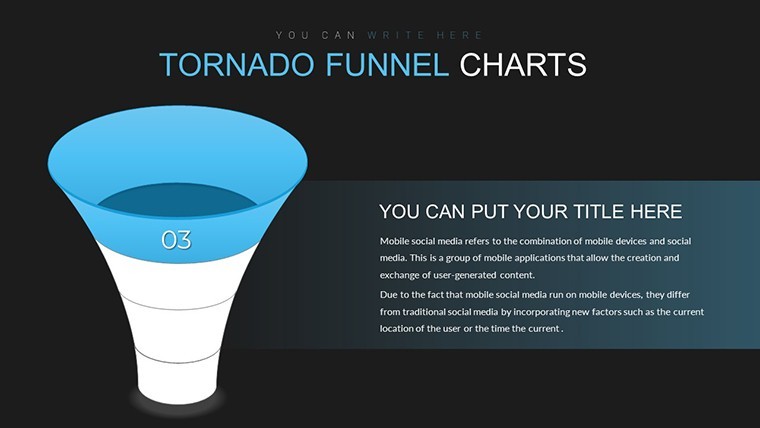
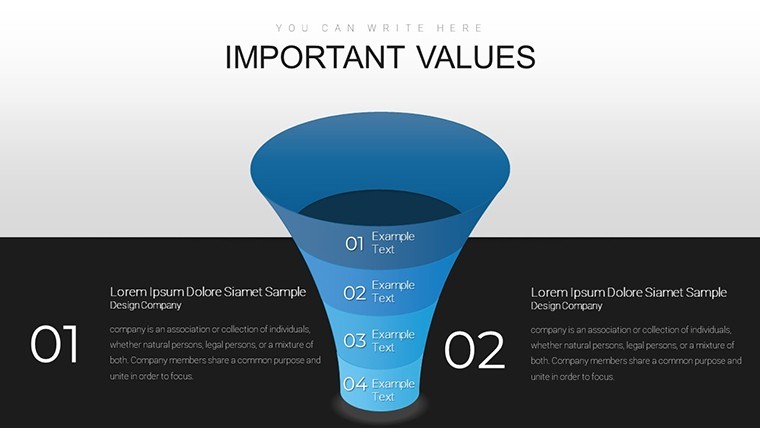
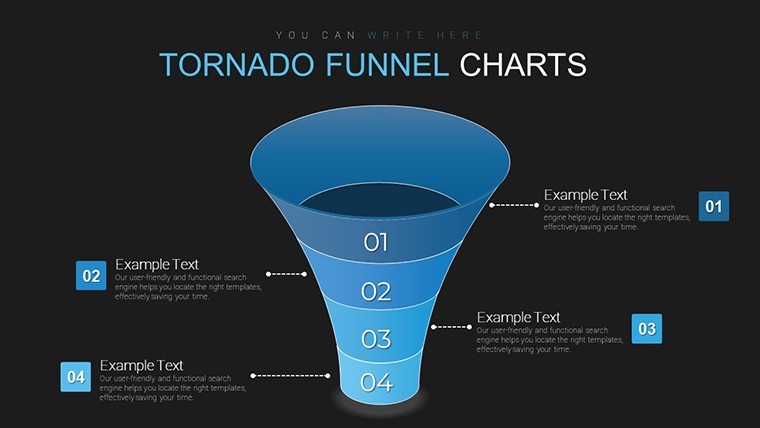
For marketing managers who track conversion rates the file saves hours instead of building from scratch. Use this when you need to explain a multi-step process to stakeholders without arranging shapes manually. The predefined narrowing segments prevent overcrowded layouts.
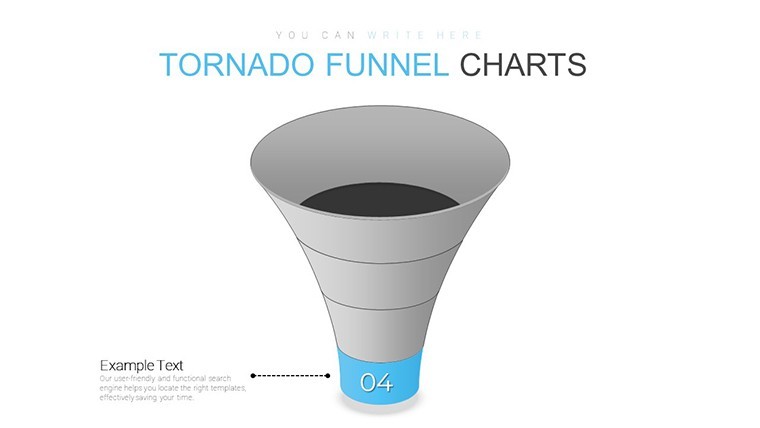
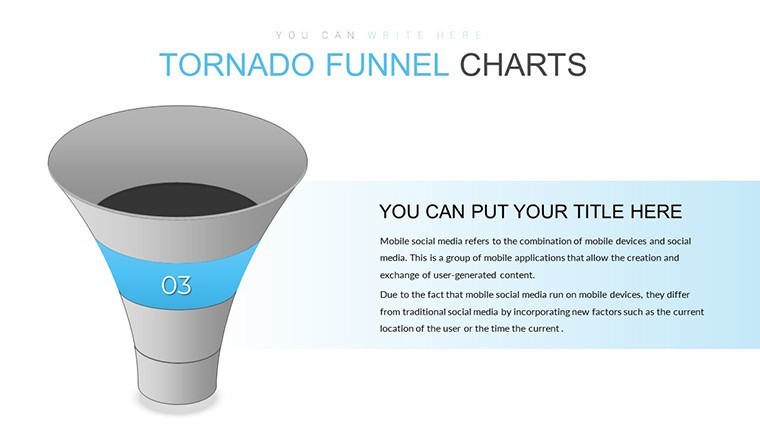
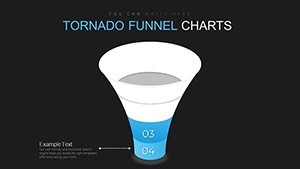
Typically teams reuse the same diagram across weekly reports. You can duplicate slides and reuse the same structure. Color changes happen via the slide master in Keynote 12 and later.
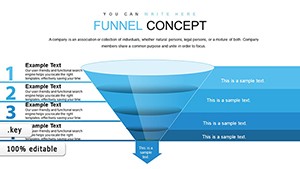
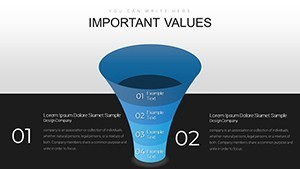
This Keynote chart template supports prioritization analysis by showing drop offs in the funnel. After using it you can decide where to allocate resources to fix bottlenecks in the process. It clarifies priority between multiple options in real work scenarios.
The file works best for structured diagrams not creative storytelling slides. It is not ideal for data-heavy dashboards with dozens of metrics.
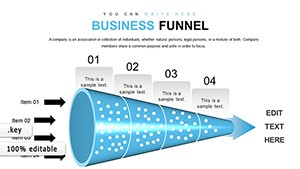
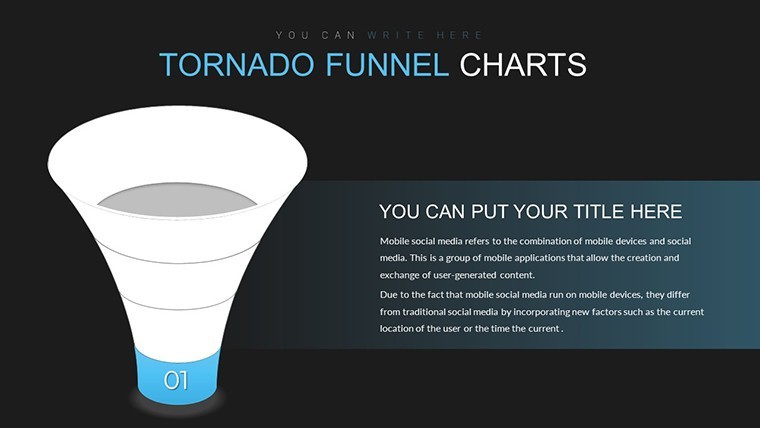
When presenting to the board the horizontal layout keeps structure readable in a single slide. Instead of building diagrams manually the file lets you focus on the numbers and outcomes.
See also Funnel Keynote Chart and Creative Funnel Charts Keynote Template for more flow options.
Specifications
| Feature | Details |
|---|---|
| Slides / diagrams | 20 tornado funnel charts |
| File format | KEY |
| Software version | Keynote 12+ |
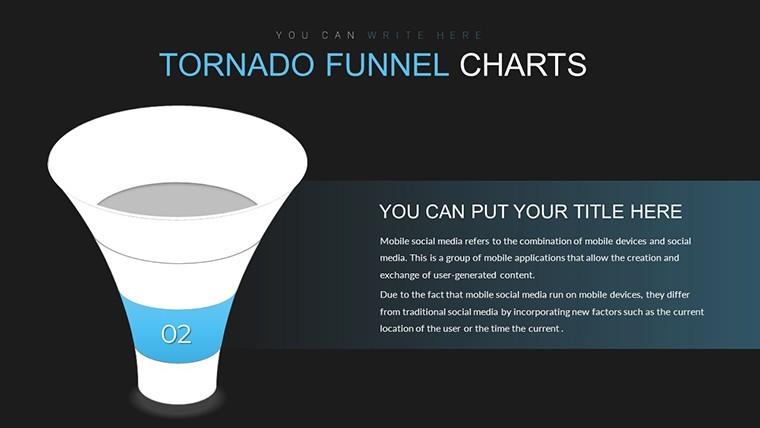
| Color schemes | Not specified on page, change via slide master |
| Editable elements | shapes, icons, text and arrows resize and recolor independently |
| Aspect ratio | 16:9 |
| Free vs Paid | Paid includes full 20 editable slides with all diagram types |
| Masters / Backgrounds | Slide master for quick edits |
How do I change colors via the slide master?
To change colors open the slide master view in Keynote. Select the master slide and update the color palette for all objects. Apply the changes and they propagate to every diagram automatically in most cases. The process takes under a minute once you know the steps.
Can I use this template for client work?
You can use the template for client work under the standard license. The file remains your property but you cannot resell the original design as is. Contact support for enterprise licensing if needed for multiple users.
What is the difference between free and paid?
The paid version delivers the complete set of 20 editable slides. The page does not specify what the free version includes exactly. In practice you get the full diagrams only with the paid purchase.
What are the refund conditions?
Refunds are processed if the file does not open correctly in your Keynote version. Submit a request within 30 days with your download details. The team reviews and issues a refund if the issue cannot be resolved with support guidance.
Which Keynote version is required?
The template works in Keynote 12 and later on macOS. Earlier versions may require conversion but some editing features could be limited. Always test the file on your current macOS setup before final use.
Everything is already structured.
Download and start editing immediately