3D Circular Keynote Charts - Fully Editable | ImagineLayout


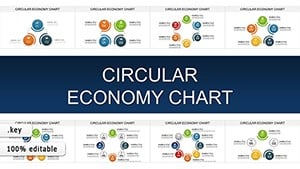
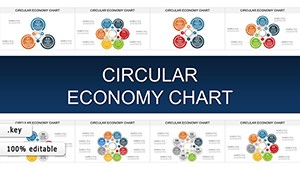
KEY file with 18 3D circular diagrams
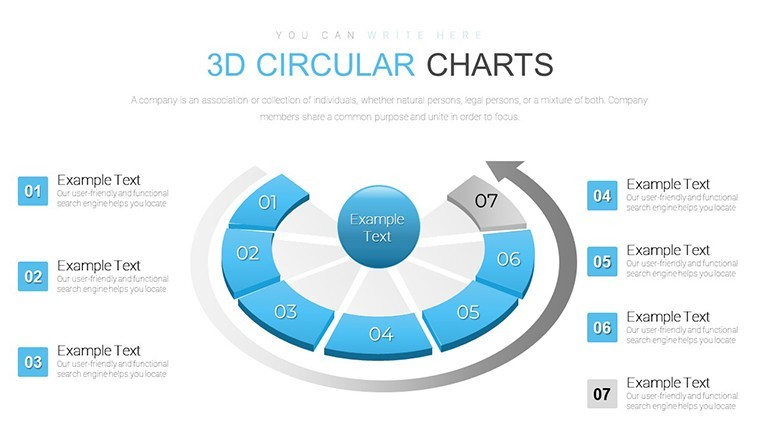
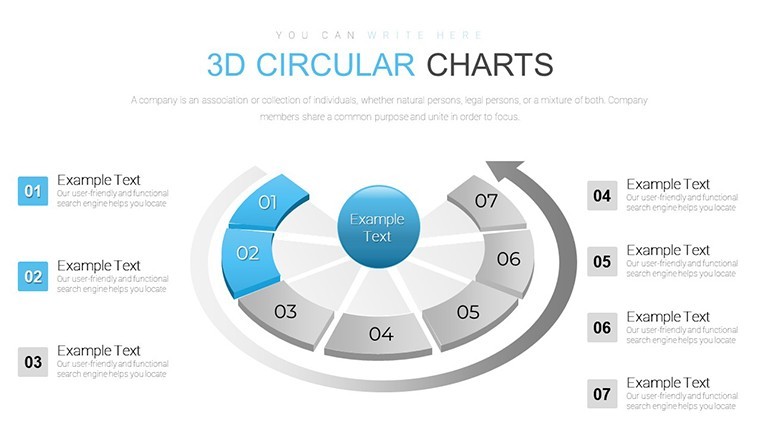
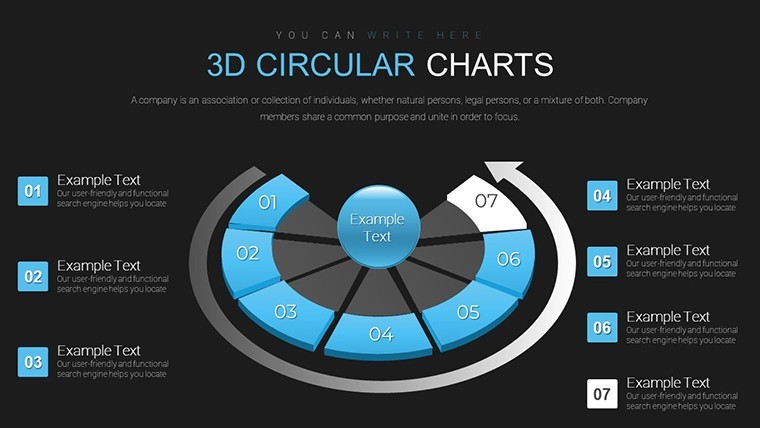
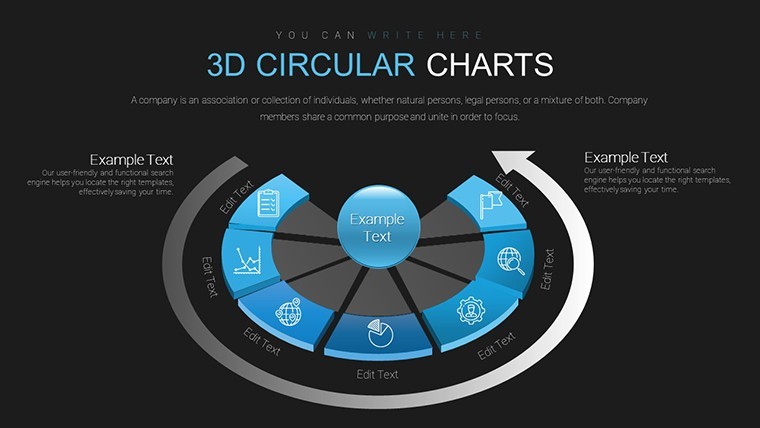
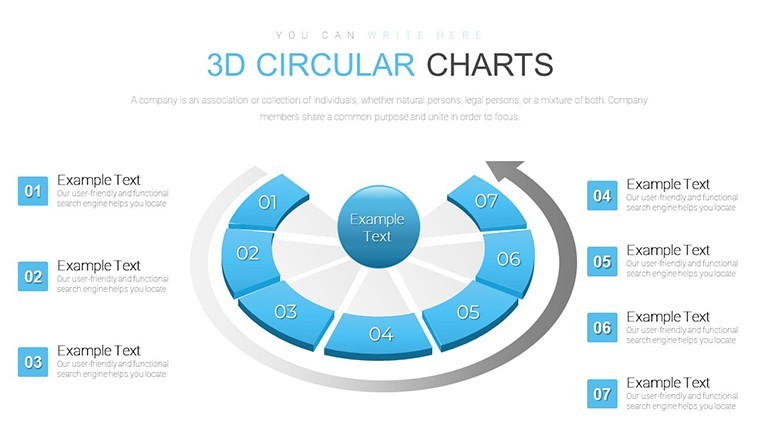
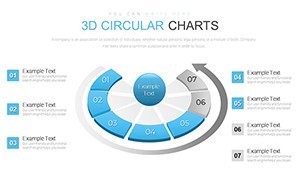
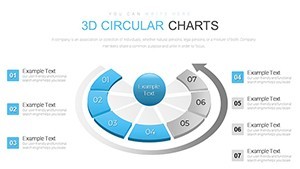
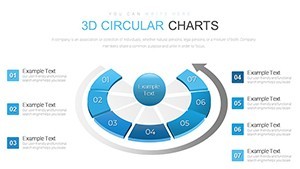
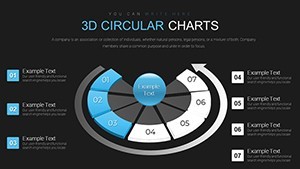
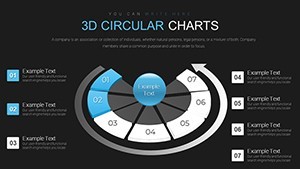
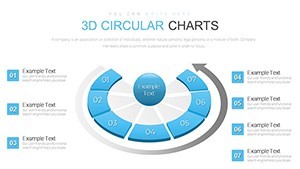
The KEY file includes 18 editable 3D circular diagrams ready for proportion breakdowns in board meetings.
No setup needed.
You replace the default labels and percentages then the 3D depth on circular sectors updates automatically across all slides which saves hours instead of building diagrams manually in Keynote.
The paid version provides the full set of 18 slides while free version details are not listed on the page.
In most cases you only replace text and adjust colors.
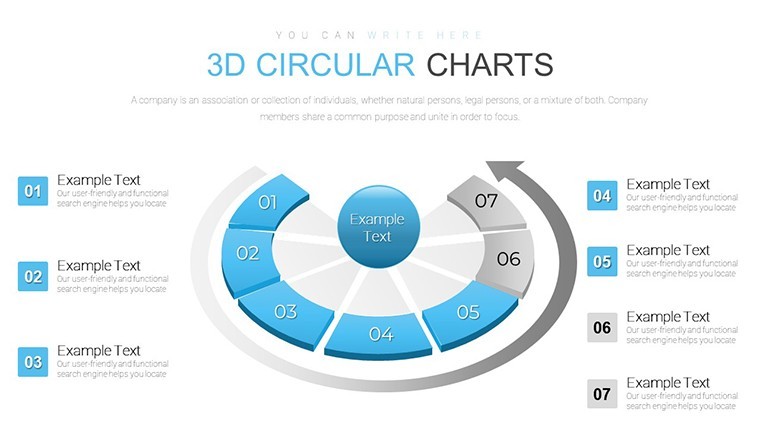
This layout supports proportion analysis that shows how resources divide across categories so teams decide where to allocate budget next.
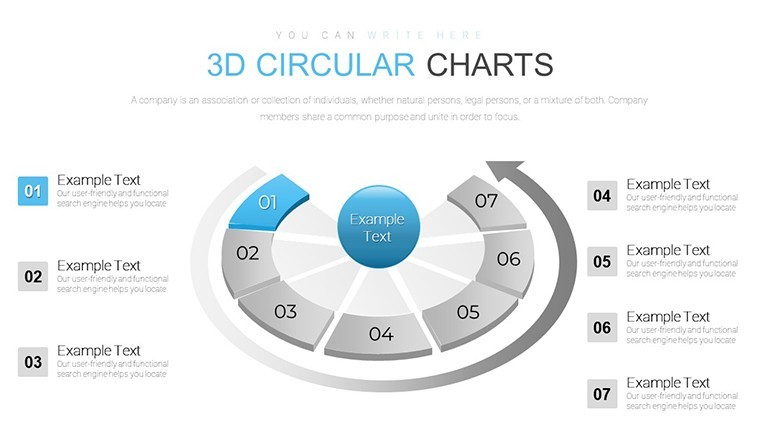
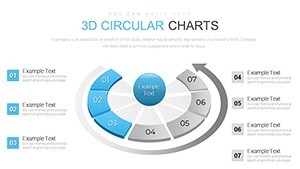
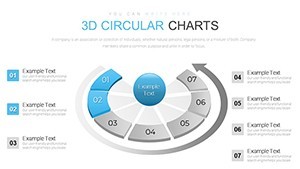
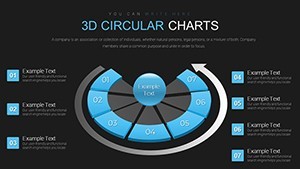
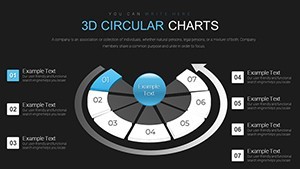
When you need to explain category splits to stakeholders without arranging shapes the circular structure handles the division out of the box.
Use this instead of building diagrams manually in Keynote.
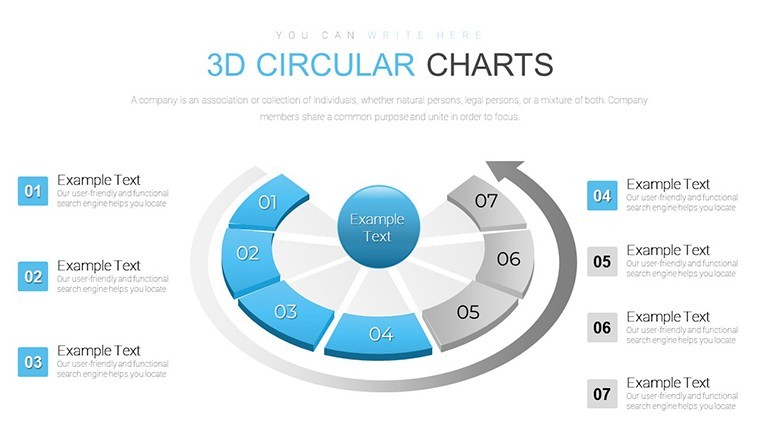
The predefined 3D circular structure keeps everything aligned so you don`t end up adjusting angles slide by slide.
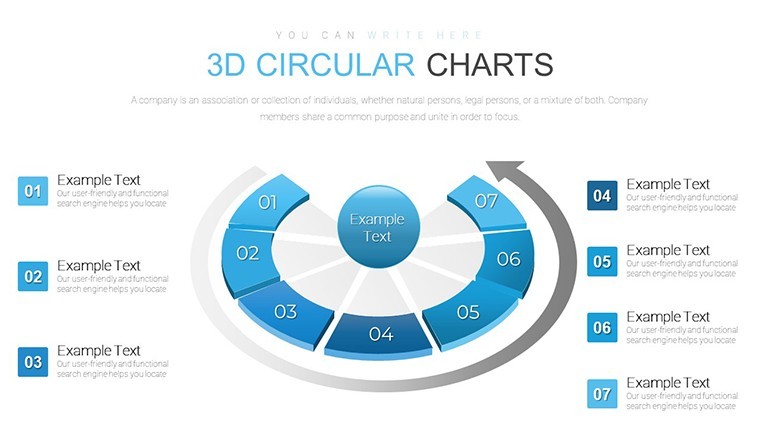
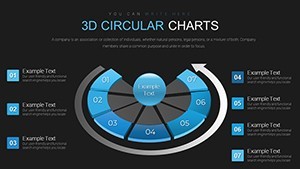
Best used when your data fits circular proportions but not ideal for linear timelines.
It works best for structured diagrams not creative storytelling slides.
Analysts who present share data to teams find it fits their task.
Typically teams reuse the same diagram across weekly reports.
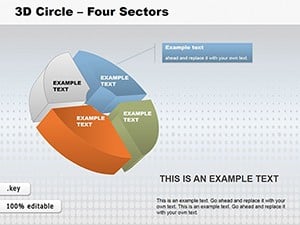
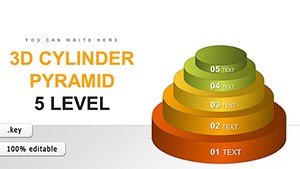
You can see similar options like the 3D Circle Four Sectors Keynote Charts: Depth in Every Division or the 3D 5-Level Cylinder Pyramid Keynote Charts for more circular ideas.
Specifications
| Feature | Details |
|---|---|
| Slides / diagrams | 18 3D circular charts |
| File format | KEY |
| Software version | Keynote 12+ |
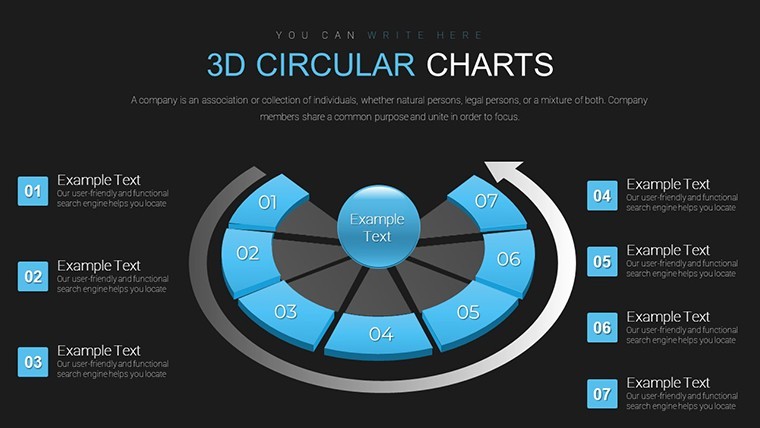
| Color schemes | Not specified on page switch via master |
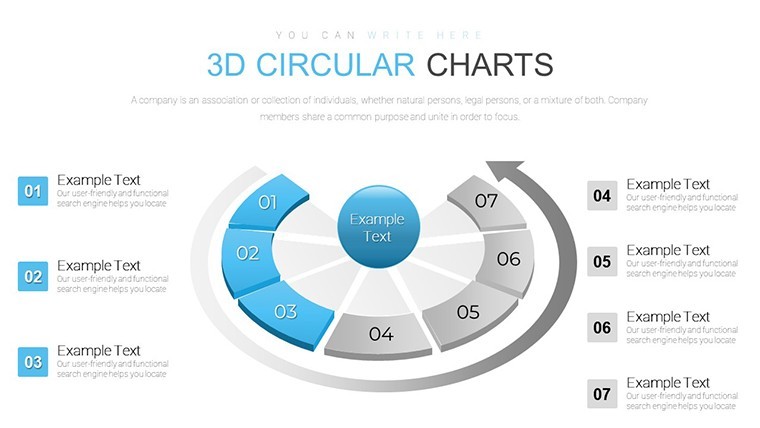
| Editable elements | Text percentages 3D depth and sectors resize independently |
| Aspect ratio | 16:9 |
| Free vs Paid | Paid includes full 18 slides free not specified |
| Masters / Backgrounds | Standard masters for global edits |
Everything is already structured.
Download and start editing immediately
How do I change colors via slide master?
Open the file in Keynote then go to View > Edit Master Slides. Select the master slide that controls the 3D circular charts and update the fill color once. All 18 diagrams update automatically in the presentation. This method works reliably in every current version.
Can I use this template for client work?
Yes one license allows use in client presentations and deliverables. You may deliver the final exported PDF or Keynote file to the client. Do not resell the original template file itself. Full license terms are included in the download package.
What is the difference between free and paid versions?
The page does not list free version details while the paid version includes the complete set of 18 editable slides. Paid buyers receive the full KEY file with all diagrams ready to customize. Free options if available would be limited previews only.
What are the refund conditions?
Refunds are available within 30 days if the file does not open in your version of Keynote. Contact support with your order number and a brief description of the issue. Approved refunds are processed back to the original payment method.
Which Keynote version and macOS do I need?
The template works in Keynote 12 and newer on macOS Ventura or later. Older versions may open the file but 3D effects require the latest release. Test the free preview first if you use an older macOS setup.