Petal Flower Keynote Charts - Fully Editable | ImagineLayout


Type: Keynote Charts template
Category: Illustrations
Sources Available: .key
Product ID: KC00674
Template incl.: 23 editable slides
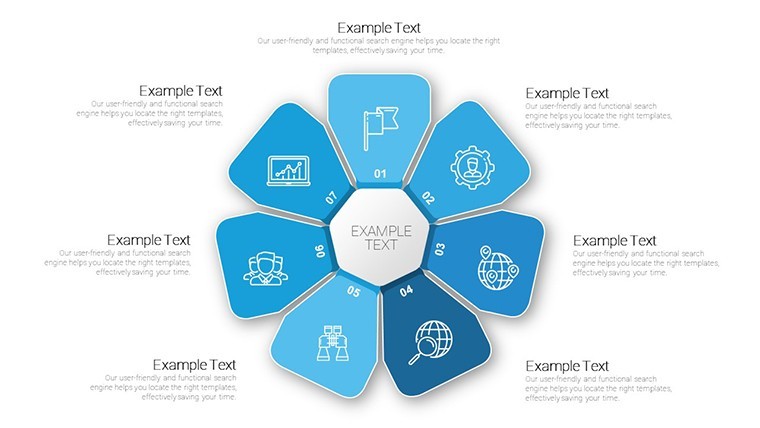
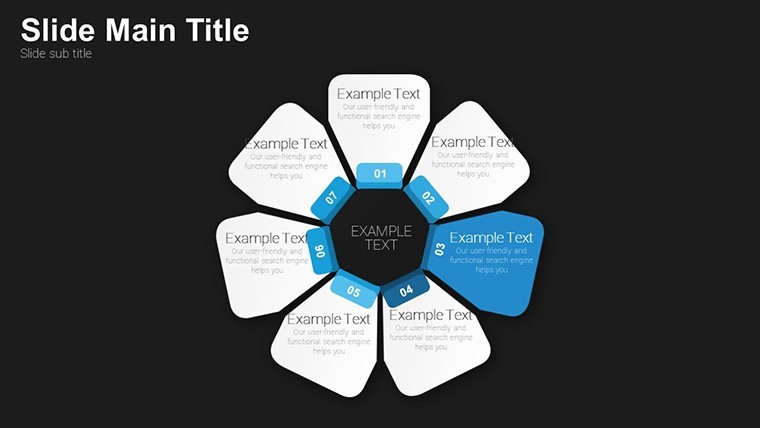
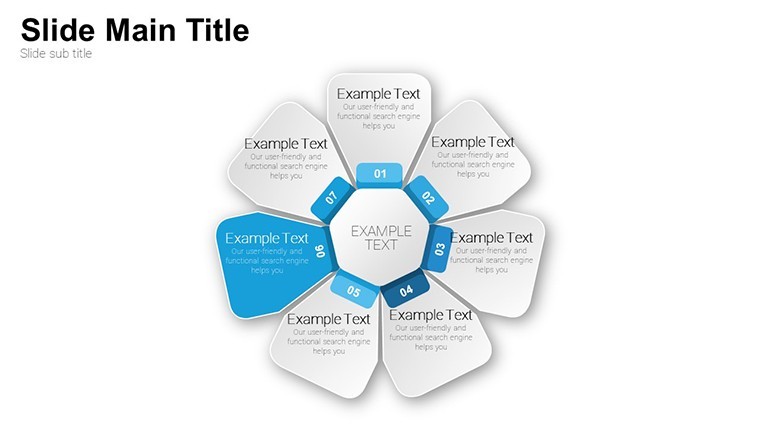
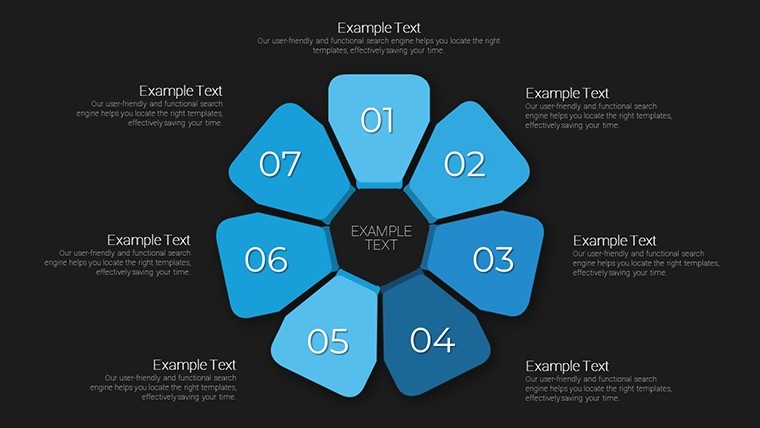
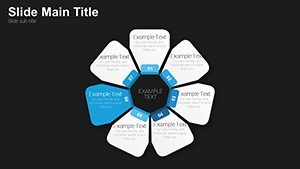
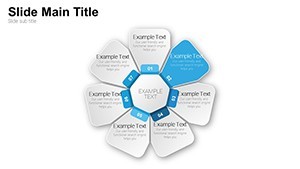
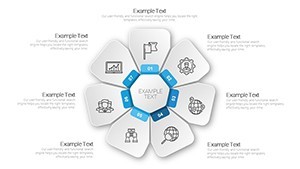
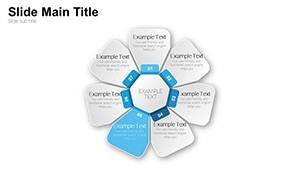
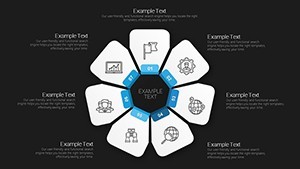
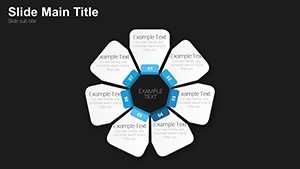
Petal Flower Keynote Charts: Blooming Indicators for Creative Slides
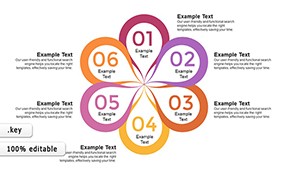
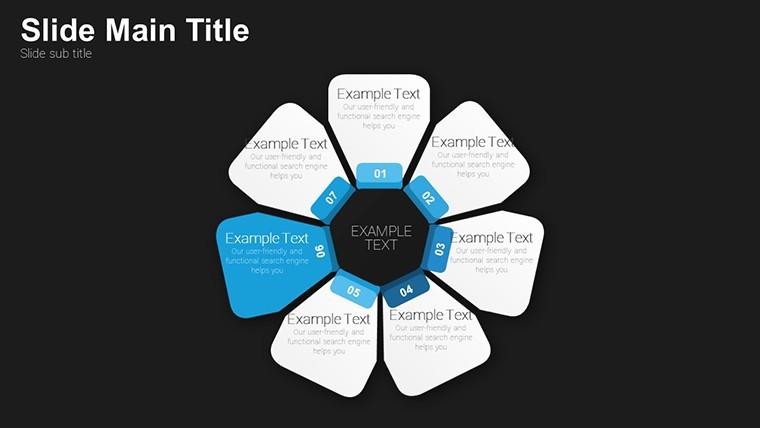
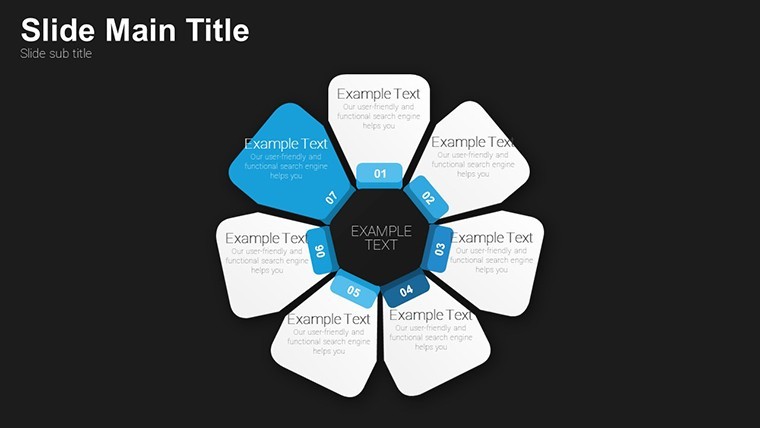
23 petal flower diagrams fill the KEY file and suit creative KPI presentations where you need to show performance metrics at a glance.
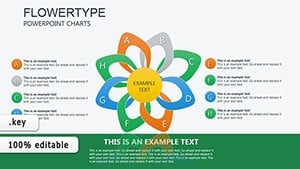
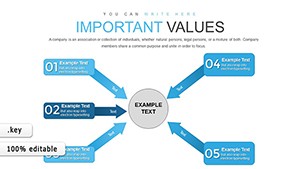
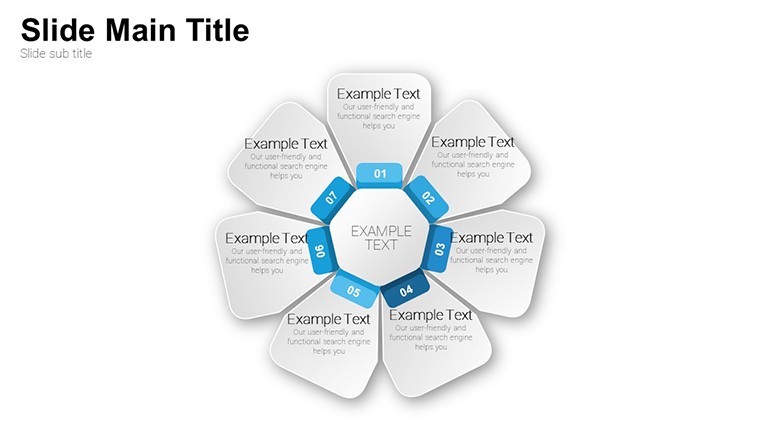
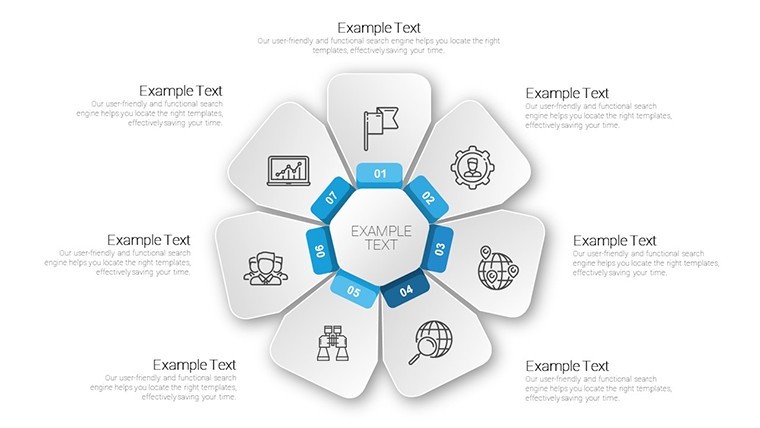
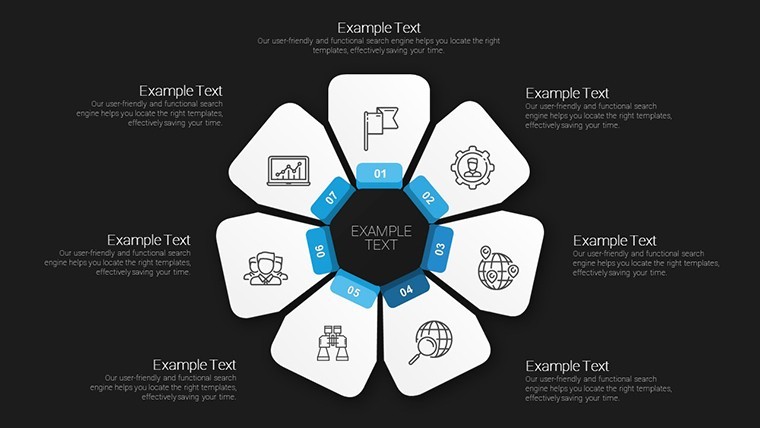
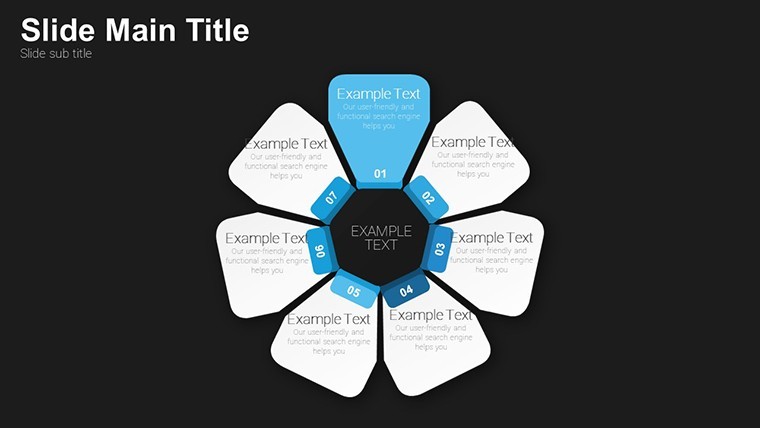
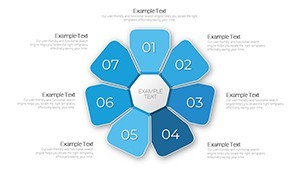
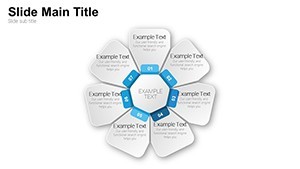
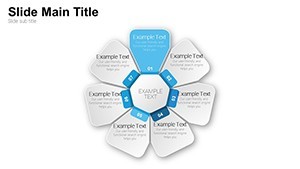
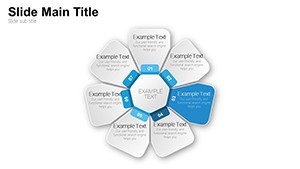
Radial flower structures with central core and large or small petals represent main metrics and sub-indicators while flat filled icons add organic feel.
You can duplicate slides and reuse the same structure.
The paid version supplies all 23 editable slides instead of building from scratch and the file supports team structure overviews across departments.
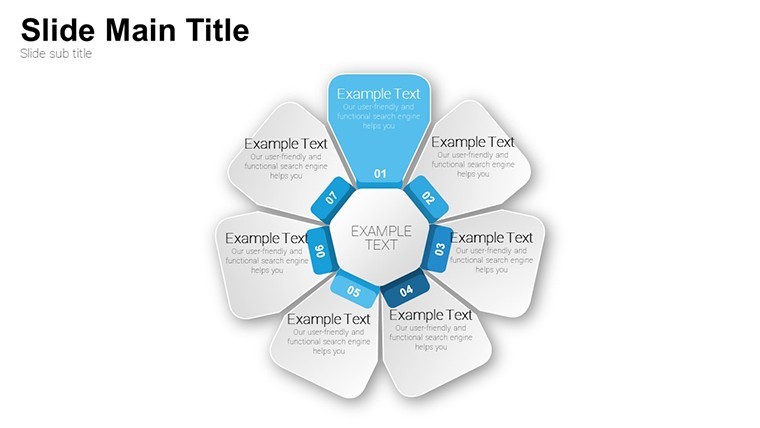
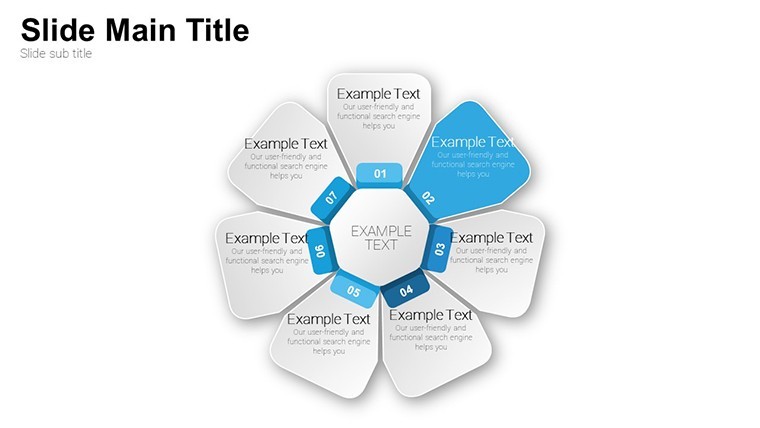
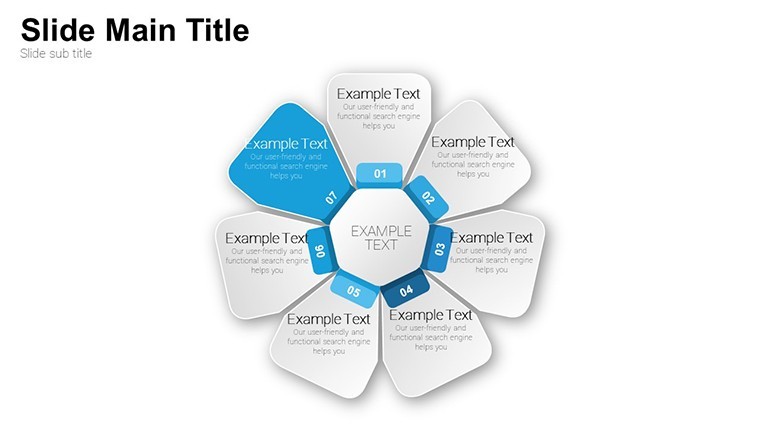
Evenly distributed petals with balanced free-form spacing prevent clutter when scaling values by color or size.
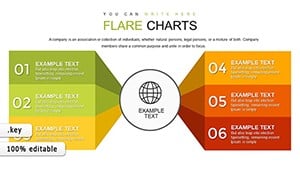
When you need to break down strategy priorities to the leadership team the petal layouts organize indicators in one view instead of arranging shapes manually.
Use this instead of building diagrams manually in Keynote.
The predefined radial structure keeps everything aligned so you avoid adjusting spacing slide by slide.
This Keynote diagram template supports relationship mapping analysis and after viewing the petals the viewer can decide which areas need priority focus.
The layouts work across multiple reports and typically teams reuse the same diagram for quarterly reviews.
In most cases you only replace text and adjust colors.
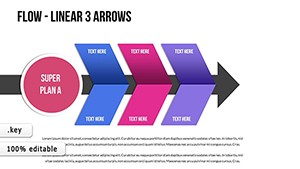
It works best for structured indicator visuals and is not ideal for linear timelines.
This file suits strategy planners who visualize KPIs regularly yet is not designed for data-heavy dashboards.
Check related options like the Flowertype Keynote Charts: Elegant Cyclic Pies for Analytical Depth or Flow Linear Arrows Keynote Charts.
| Feature | Details |
|---|---|
| Slides / diagrams | 23 radial petal flower charts with core and scalable petals |
| File format | KEY |
| Software version | Keynote 12+ |
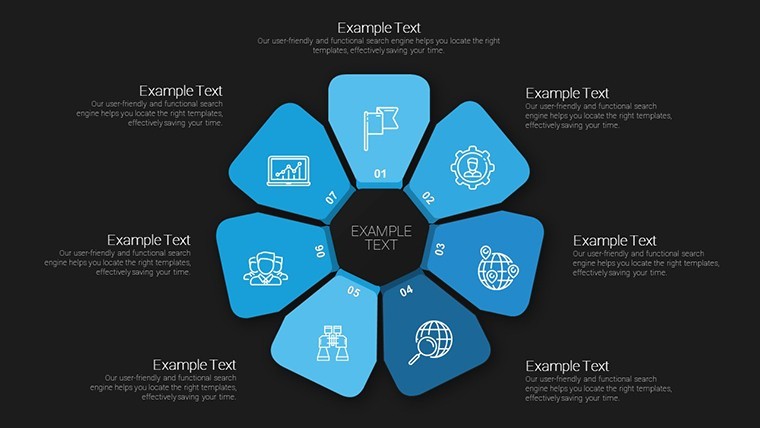
| Color schemes | Customizable via slide master with instant palette switch |
| Editable elements | Petals, core and text resize or recolor independently |
| Aspect ratio | 16:9 |
| Free vs Paid | Paid version delivers all 23 editable slides; no free full version listed |
| Masters / Backgrounds | Single master slide for consistent floral styling |
Everything is already structured.
Download and start editing immediately
What Keynote version and macOS is required?
The template works in Keynote 12 and newer.
It requires macOS 13 or later for full compatibility.
Older versions may show minor alignment issues but the core diagrams remain editable.
How do I change colors via slide master?
Open View > Master Slides in Keynote.
Select the master slide and update the color palette in the Format panel.
Close the master view and the change applies to every slide instantly.
Does the license allow client work?
Yes the license permits use in client projects.
You can deliver the customized deck to your client but cannot resell the original template files.
One license covers one user account.
What is the difference between free and paid?
The paid version provides the complete set of 23 editable slides.
No free version is listed on the page but previews show sample layouts.
The full download unlocks all elements for immediate use.
What are the refund conditions?
Refunds are available within 14 days if the template does not meet your needs.
Contact support with your order number to start the process.
Full details appear in the purchase confirmation email.