Promo code "00LAYOUTS"
Competition Analysis Keynote Charts Template
Type: Keynote Charts template
Category: Analysis
Sources Available: .key
Product ID: KC00670
Template incl.: 26 editable slides
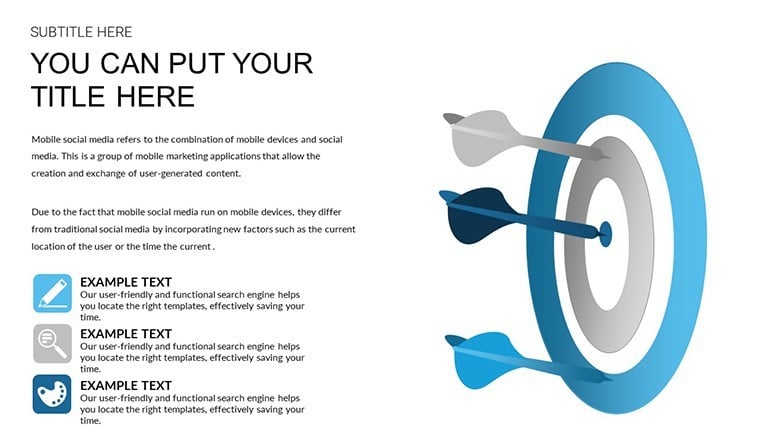
Understanding competition is the cornerstone of strategic business planning. Our Competition Analysis Keynote Charts Template equips you with 26 editable slides to explore market forces, rival strategies, and economic conditions. Ideal for economists, business analysts, and entrepreneurs, it helps dissect the presence of independent producers and consumers, turning theoretical concepts into actionable visuals. No more abstract discussions - use these charts to illustrate porter's five forces or SWOT analyses with precision and flair.
Grounded in economic principles from thinkers like Michael Porter, this template offers control over every detail, ensuring your presentations reflect real-market scenarios. Load it in Keynote, and customize axes, grids, and colors to highlight competitive landscapes, fostering deeper insights for your team or clients.
Essential Features for In-Depth Analysis
This template empowers with robust customization, tailored for analytical depth.
- Extensive Chart Controls: Adjust sizes, fonts, and tick marks for accurate data representation.
- Grid and Axis Flexibility: Add or remove elements to focus on key metrics like market share.
- Color and Style Options: Match to corporate branding or emphasize data trends visually.
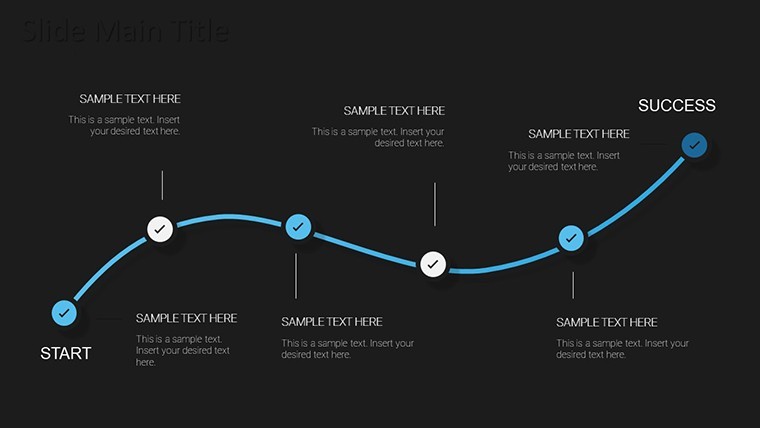
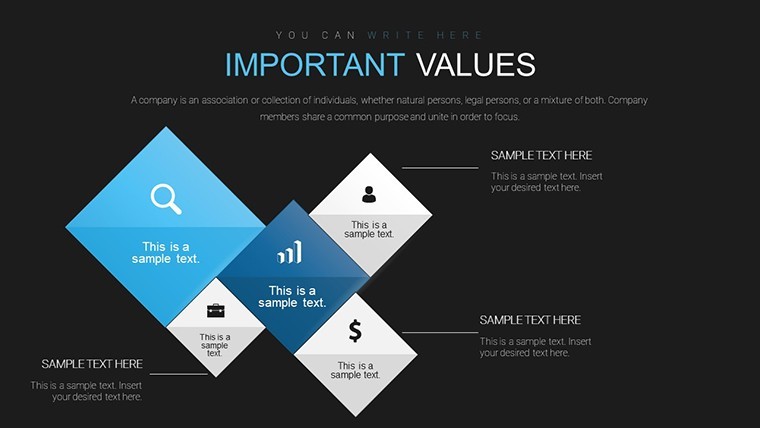
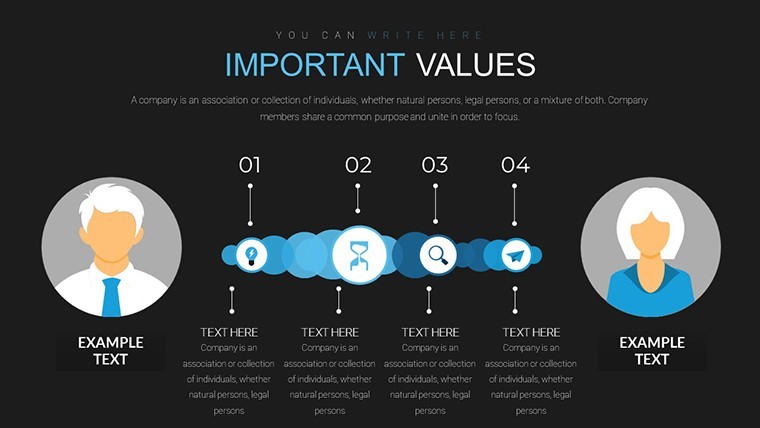
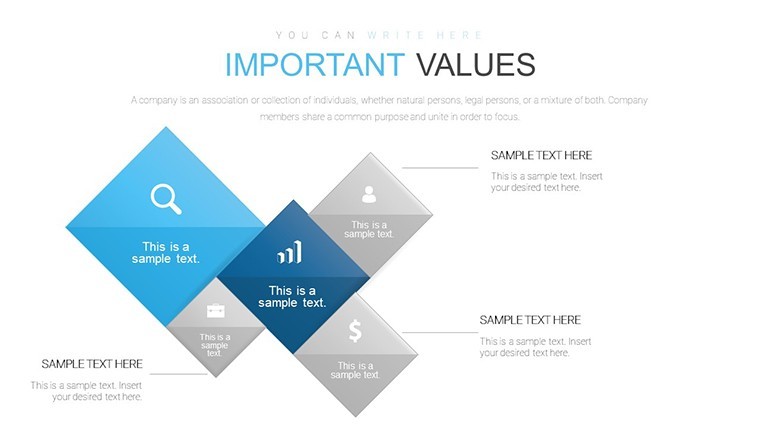
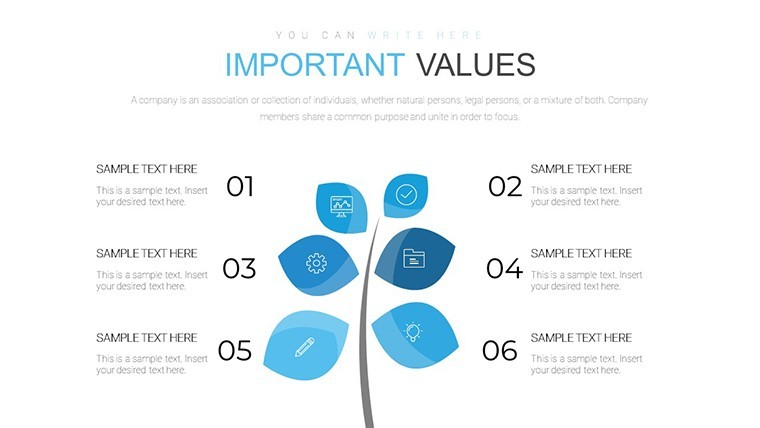
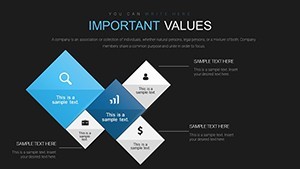
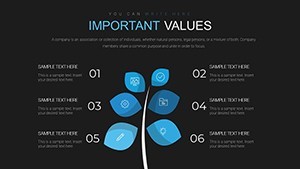
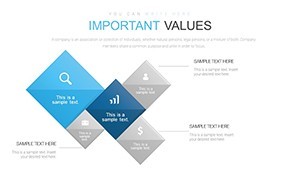
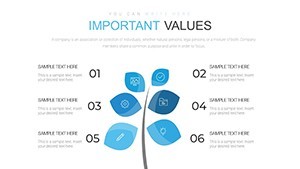
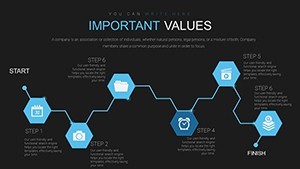
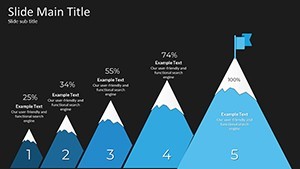
- Analysis-Focused Designs: From matrices to timelines, suited for competition breakdowns.
It also includes layered elements for complex overlays, like comparing competitor pricing strategies.
Strategic Benefits for Business Minds
Leverage this for competitive intelligence that drives growth. Case studies from firms like Bain & Company show visual aids enhance strategy sessions by 45%. For you, it means clearer competitor mappings, leading to informed decisions and potential market advantages.
Benefits include authoritative outputs: Vector graphics ensure sharpness, building trust in your analyses. It's a reliable tool for dissecting market entry barriers or rivalry intensity.
Comprehensive Slide Overview
Delve into the slides' analytical power:
- Slides 1-4: Conceptual Foundations - Define competition with mind maps and basic charts.
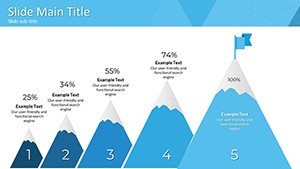
- Slides 5-12: Market Structure Visuals - Graphs for monopoly vs. oligopoly comparisons.
- Slides 13-18: Strategy Tools - Customizable SWOT and PESTLE frameworks.
- Slides 19-23: Data-Driven Insights - Scatter plots for correlation analyses.
- Slides 24-26: Actionable Summaries - Dashboards for key takeaways and recommendations.
Incorporate LSI such as "market rivalry charts" organically.
Practical Applications in Economic Contexts
Use for board reports on industry competition or startup pitches analyzing rivals. Draw from real sources like World Economic Forum reports for examples, visualizing global trade dynamics.
Workflow: Download .key, input data, refine visuals, and present. Add inspirational notes, like how competition "fuels innovation," to motivate.
Analytical Tips from Experts
Ensure data accuracy with labeled sources. Use contrasting visuals for emphasis, per economic visualization guides. Unlike basic tools, this prevents scaling issues for pro results.
Seize Your Competitive Advantage
This template is your ally in navigating markets. Begin analyzing and outmaneuver competitors today.
Frequently Asked Questions
How detailed is the customization?
Full control over all visual elements for tailored analyses.
Suitable for beginners?
Yes, intuitive for all levels in business analysis.
Can it handle complex data?
Absolutely, supports multi-variable charts.
What economic models does it support?
Porter's, SWOT, and more via editable templates.
Export options?
Standard Keynote exports like PDF.
Updates available?
Check site for latest versions.

