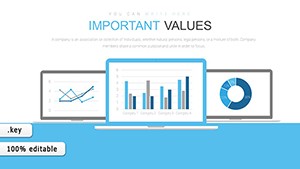
Creative Funnel Charts Keynote Template: Visualize Your Data Journey

Type: Keynote Charts template
Category: Flow
Sources Available: .key
Product ID: KC00658
Template incl.: 10 editable slides
In the fast-paced world of business presentations, capturing your audience's attention while clearly conveying complex processes is key to success. Imagine transforming intricate sales pipelines or marketing strategies into visually stunning, easy-to-follow diagrams that guide viewers through each stage effortlessly. That's exactly what our Creative Funnel Charts Keynote Template offers. Designed specifically for professionals in sales, marketing, banking, and beyond, this template includes 10 fully editable slides packed with diverse funnel designs - stacked, curved, and straight variations - that bring your data to life.
Whether you're pitching to investors, updating your team on conversion rates, or analyzing customer journeys, these funnels help simplify phased information, making it more digestible and memorable. With seamless compatibility for Keynote on Apple devices, you can customize colors, fonts, and data inputs in minutes, even if you're not a design expert. This isn't just a template; it's a tool to elevate your narrative, turning raw numbers into compelling stories that drive decisions. Professionals like marketing managers at startups or sales leads in established firms have used similar funnel visuals to boost engagement by up to 30%, according to industry reports from sources like HubSpot. Dive in and see how this template can streamline your workflow and amplify your message.
Unlocking the Power of Funnel Visualization in Presentations
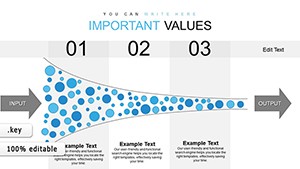
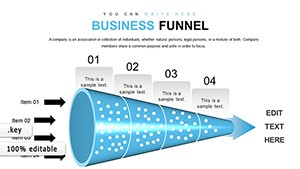
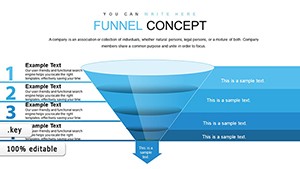
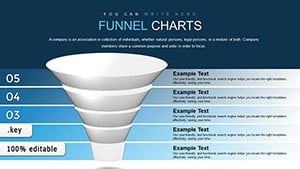
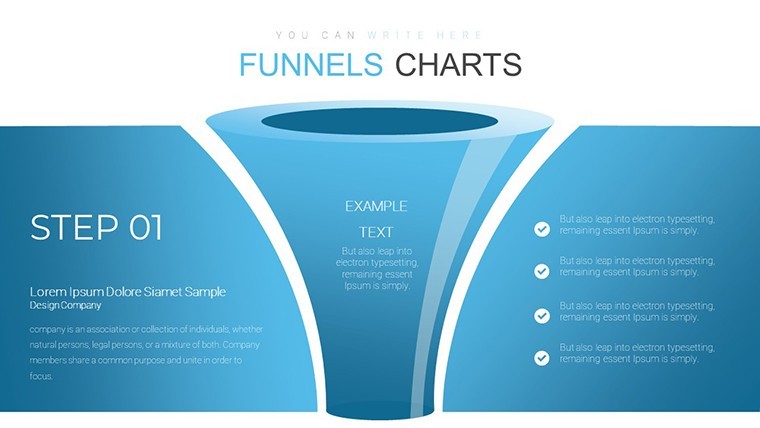
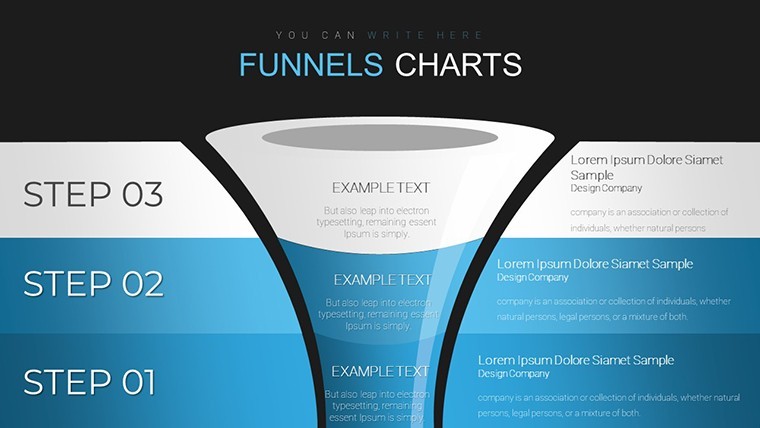
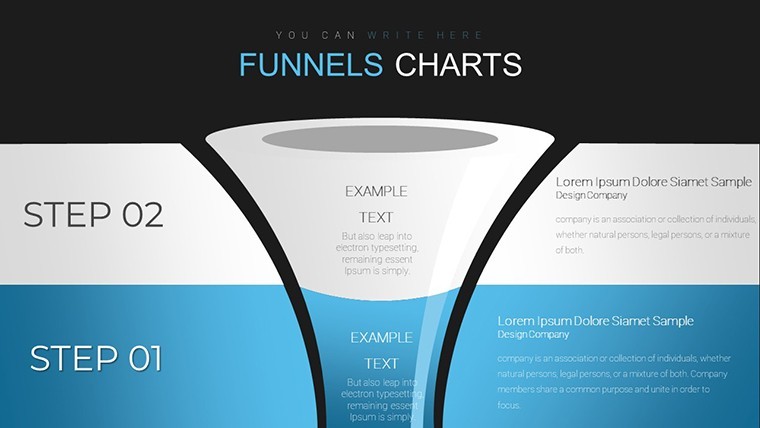
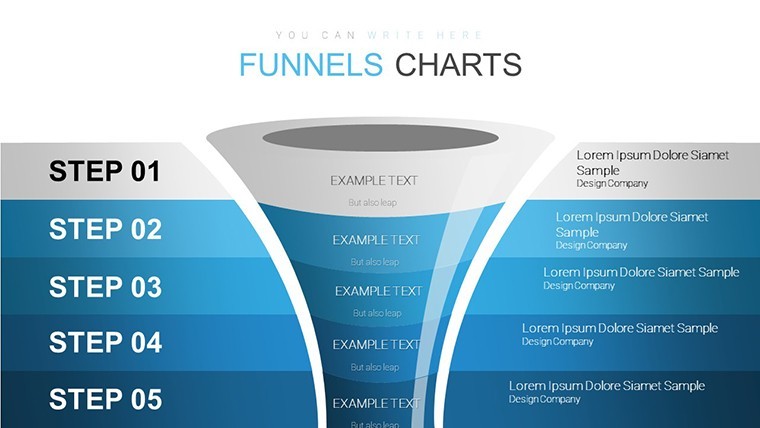
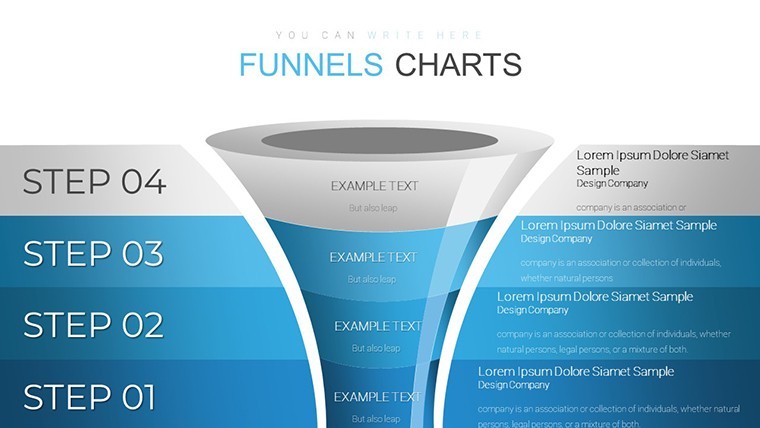
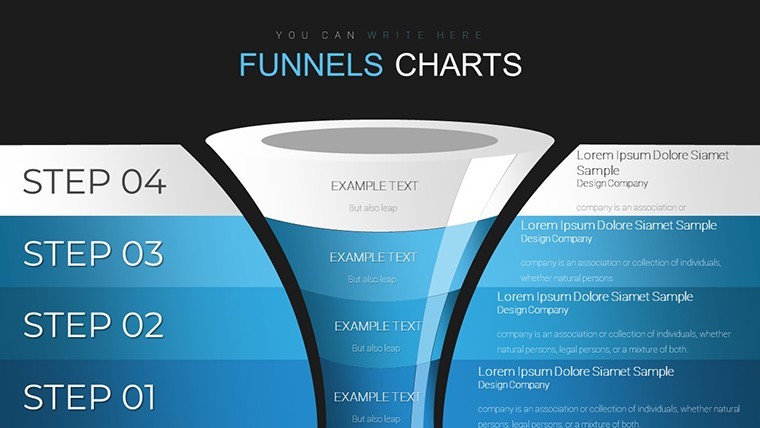
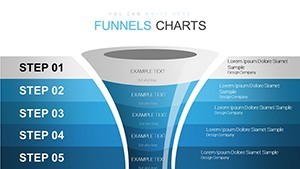
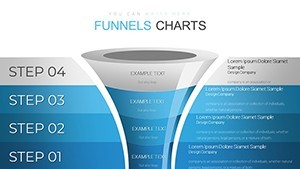
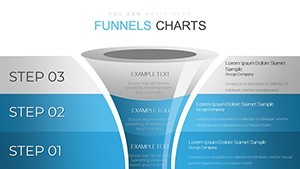
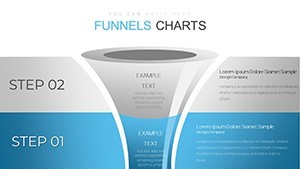
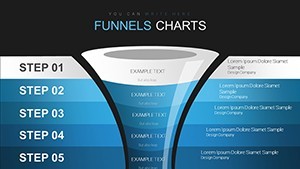
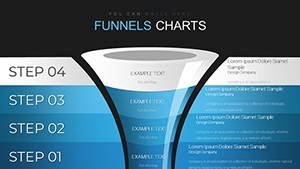
Funnel charts are more than just graphics; they're strategic assets that illustrate progression, bottlenecks, and outcomes in a linear yet dynamic way. Our template stands out with its creative twists on traditional funnels, allowing you to represent everything from lead generation to customer retention. For instance, a stacked funnel slide might show layered stages of a sales process, where each segment's size reflects volume - perfect for highlighting drop-offs and opportunities for improvement.
Customization is at the heart of this template. Start by selecting a slide, input your data via simple placeholders, and watch as the funnel auto-adjusts. Change the color palette to align with your brand guidelines - perhaps shifting from cool blues for a banking report to vibrant oranges for a marketing campaign. Fonts can be tweaked for readability, ensuring your text pops against the visuals. This level of flexibility draws from best practices in information design, inspired by experts like Edward Tufte, who emphasize clarity and minimalism in data representation.
Key Features That Set This Template Apart
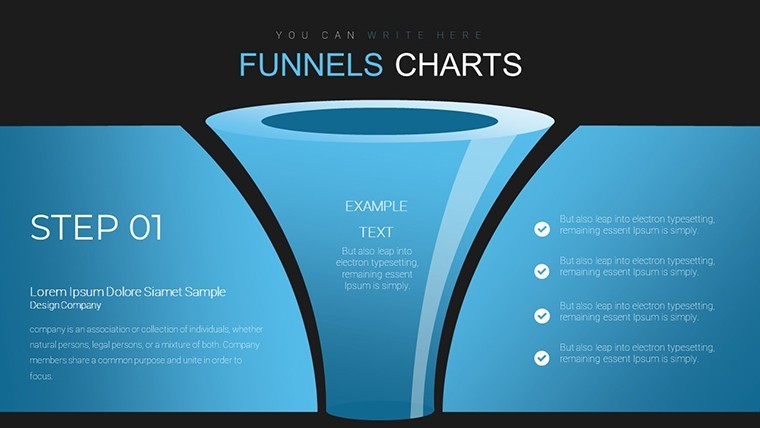
- Versatile Funnel Designs: Choose from stacked for hierarchical data, curved for smooth transitions, or straight for straightforward progressions, each optimized for Keynote's animation capabilities.
- Full Editability: Every element - from shapes to labels - is modifiable, supporting quick iterations during tight deadlines.
- High-Quality Graphics: Vector-based elements ensure scalability without loss of quality, ideal for high-resolution displays.
- User-Friendly Interface: Built-in instructions guide you through setup, with tooltips for advanced features like data linking.
- Theme Integration: Pre-set color schemes that can be overridden, plus icon libraries for added flair in your slides.
These features aren't arbitrary; they're crafted based on feedback from presentation pros who value efficiency. In a real-world scenario, a sales director at a fintech company used a similar funnel to map user acquisition, identifying a 15% leakage at the onboarding stage and implementing fixes that increased conversions.
Real-World Applications: From Marketing to Banking
Picture this: You're a marketing specialist preparing a quarterly review. Instead of dense spreadsheets, you use our curved funnel slide to depict the customer journey - from awareness to purchase. Highlight key metrics like drop-off rates with color-coded segments, and add animations to reveal stages progressively, keeping your audience engaged.
In banking, funnel charts excel at visualizing loan approval processes. A straight funnel could outline application stages, with data points showing approval percentages. This not only informs stakeholders but also aids in process optimization, aligning with standards from bodies like the American Bankers Association for clear financial reporting.
For sales teams, stacked funnels are invaluable for pipeline analysis. Track leads through qualification, negotiation, and closure, using the template's editable chips to adjust for real-time data. Case studies from sales platforms like Salesforce show that visual aids like these can shorten sales cycles by making insights actionable.
Step-by-Step Guide to Maximizing Your Funnels
- Open the template in Keynote and select your preferred funnel type from the 10 slides.
- Input your data into the placeholders - use Excel imports for accuracy if needed.
- Customize visuals: Adjust colors via the inspector panel, ensuring contrast for accessibility.
- Add text and labels, incorporating bold or italic for emphasis on key stages.
- Apply animations: Keynote's build effects can make segments appear sequentially for dramatic reveals.
- Preview and iterate: Test on different devices to ensure compatibility.
- Export or present: Share as .key or PDF for broader reach.
This workflow integrates seamlessly with tools like Google Analytics for data sourcing, turning abstract numbers into tangible strategies.
Why Choose This Template Over Basic Keynote Tools?
Basic Keynote charts are functional, but they lack the creative edge and pre-built sophistication of our template. While standard funnels might require hours of manual design, ours offers ready-to-use variations that save time and enhance professionalism. Compared to free alternatives, this paid version includes premium support and exclusive designs, ensuring your presentations stand out in competitive environments like investor meetings.
Value propositions extend to trustworthiness - backed by customer service ready to assist with any tweaks. Users report higher audience retention when using themed visuals, as they foster better understanding and recall.
Tips for Effective Funnel Presentations
To truly shine, pair your funnels with storytelling. Begin with a broad top stage to set context, narrowing down to outcomes. Use LSI terms like "conversion optimization" or "lead nurturing" naturally in your narrative. For accessibility, add alt text to images and ensure color-blind friendly palettes. Finally, rehearse to time animations perfectly, avoiding overload.
In educational settings, these funnels can teach process flows, like in business courses drawing from Harvard Business Review case studies on funnel efficiency.
Elevate Your Data Storytelling Today
Don't settle for mundane slides when you can captivate with our Creative Funnel Charts Keynote Template. Whether refining marketing strategies or banking reports, this tool empowers you to present with confidence. Ready to funnel your ideas into success? Customize now and see the difference.
FAQ
How customizable are the funnel designs?
The designs are fully editable, allowing changes to shapes, colors, data, and layouts to fit your needs.
Is this template compatible with other software?
Primarily for Keynote, but you can export to PDF or images for use in PowerPoint or Google Slides.
What industries benefit most from funnel charts?
Sales, marketing, and banking, but it's versatile for any process-oriented presentation.
Do I need design experience to use this?
No, built-in instructions make it accessible for beginners.
Can I add animations to the funnels?
Yes, Keynote's animation tools integrate seamlessly with the template.
How do I get support if needed?
Contact our customer service for personalized assistance.