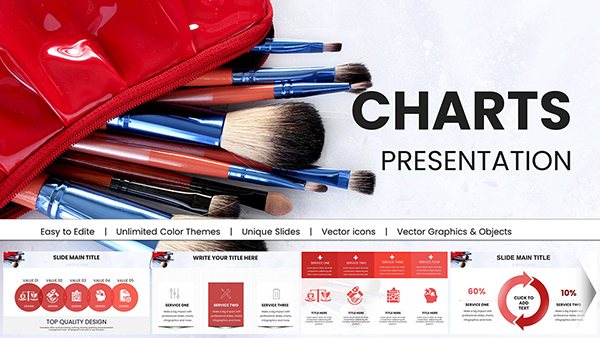
14 Analytical Circles - Editable Keynote | ImagineLayout
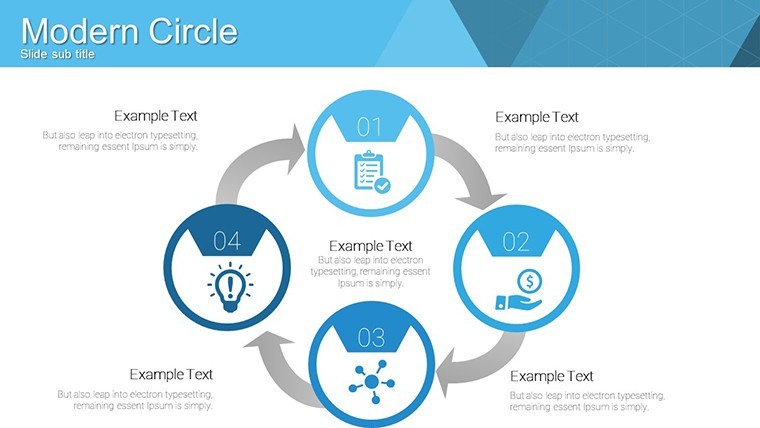
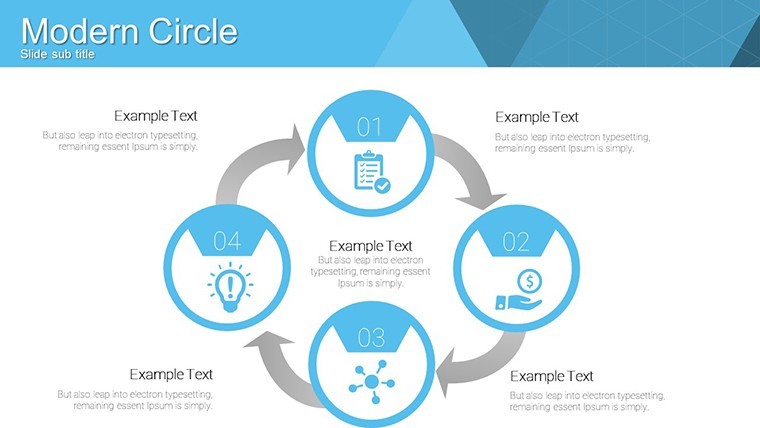


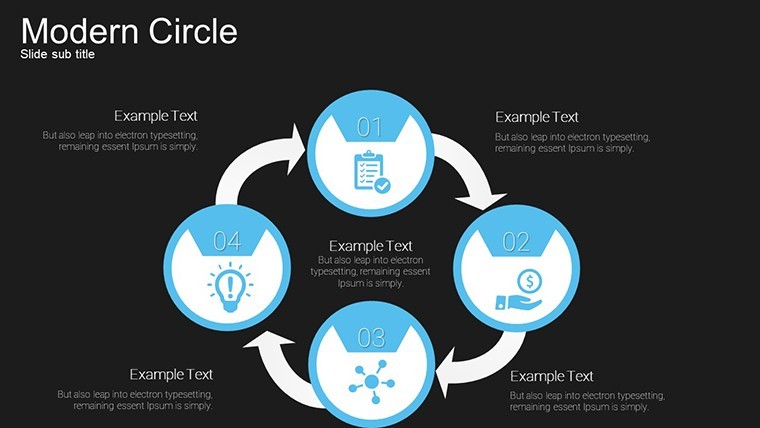


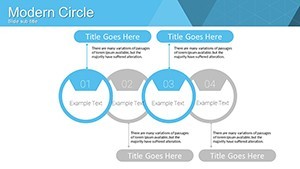
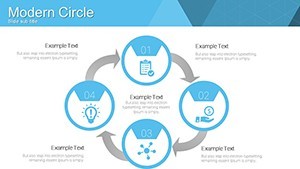
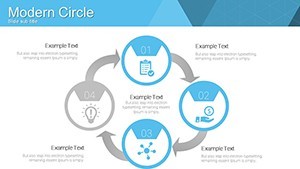


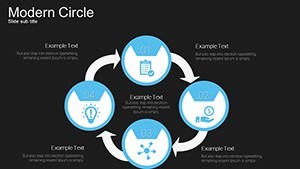
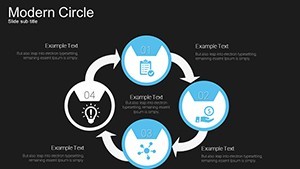
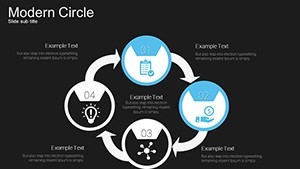
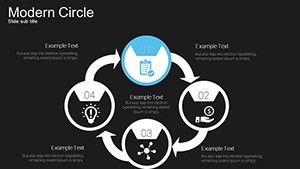
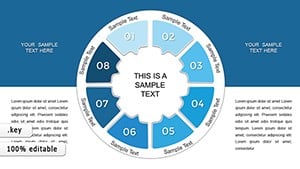
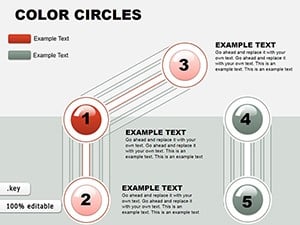
The KEY file includes 14 editable analytical circle diagrams suited for showing intersections in business data on single slides.
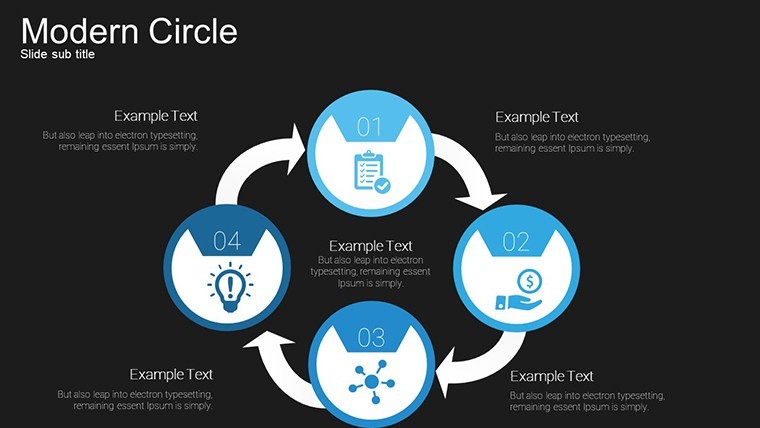
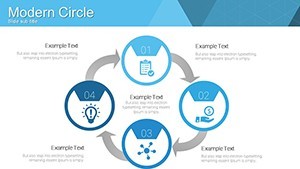
Vibrant color variations with custom animations make the overlapping circles stand out.
No setup needed.
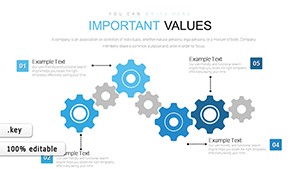
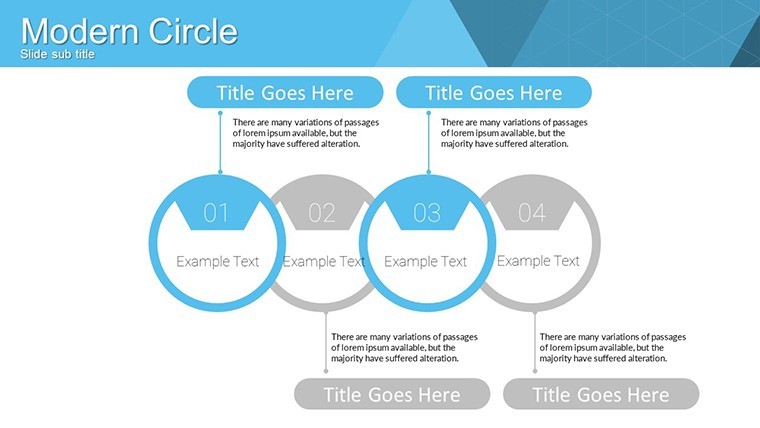
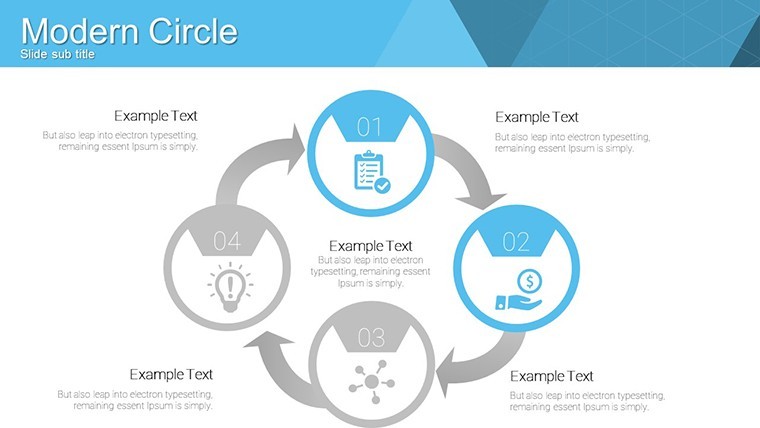
In practice you replace placeholder values with your category percentages and the modular structure holds while multi-circle interactions stay perfectly aligned.
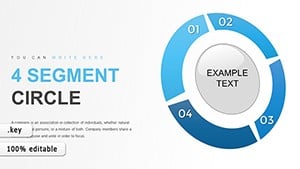
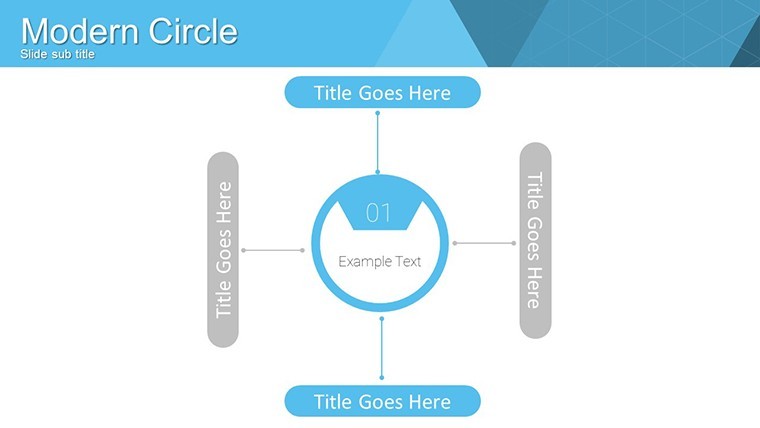
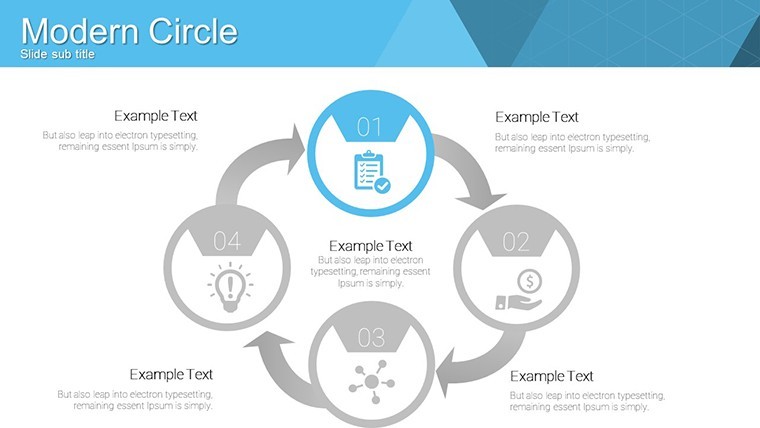
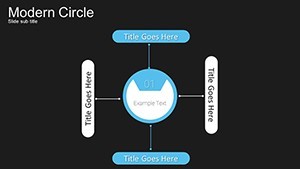
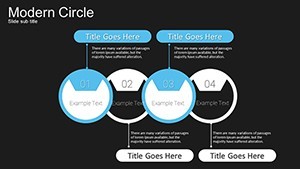
For quarterly strategy reviews with no designer the single and multi-circle layouts handle relationship mapping out of the box.
Typically this supports comparison analysis between overlapping groups so you can decide which segments to prioritize after one glance.
Use this instead of building diagrams manually in Keynote.
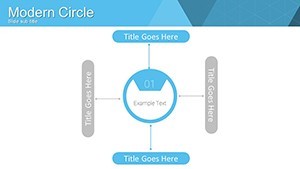
The predefined Venn-style overlaps keep structure readable on one slide so you don’t end up adjusting spacing slide by slide.
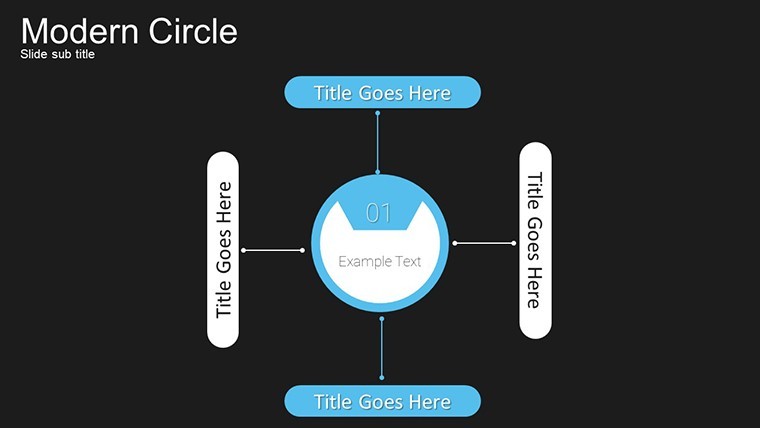
Marketing analysts presenting market segmentation to teams will benefit most.
Not ideal for linear timelines or data-heavy dashboards.
Avoid it if your presentation requires creative storytelling slides rather than structured data visuals.
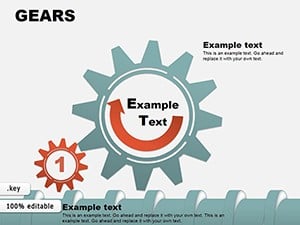
In most cases you only replace text and adjust colors via the slide master.
See more cycle keynote charts templates or the related Circle Thumbs Puzzle Keynote Charts Template.
You open the file and start editing.
Download and start editing immediately
What Keynote version is required?
The template is built exclusively for Keynote and works with current installations on macOS.
No additional plugins are needed and the KEY format opens instantly in recent versions.
Test on your setup before large edits to confirm full animation support.
How to change colors via slide master?
Open the file in Keynote then go to View > Edit Master Slides.
Select the circle elements update fill stroke or opacity and the changes apply to all 14 slides automatically.
This keeps the entire deck consistent in under two minutes.
Can I use this template for client work?
Yes the license allows commercial use in client presentations and deliverables.
You may customize and present the decks to clients without restriction.
You cannot resell or distribute the original template files themselves.
What are the free vs paid differences?
The page does not list a separate free version.
The paid download provides the complete set of 14 editable slides with animations and vibrant colors.
Everything is ready for immediate customization without additional purchases.
What are the refund conditions?
Digital downloads like this KEY file are non-refundable after delivery.
Contact support for any technical compatibility issues with your Keynote version.
Refunds are considered only in cases of proven delivery errors on our end.