Ladder Infographics Keynote Charts: Step Up Your Presentation Game


Type: Keynote Charts template
Category: Free Templates, Tables
Sources Available: .key
Product ID: KC00640
Template incl.: 8 editable slides
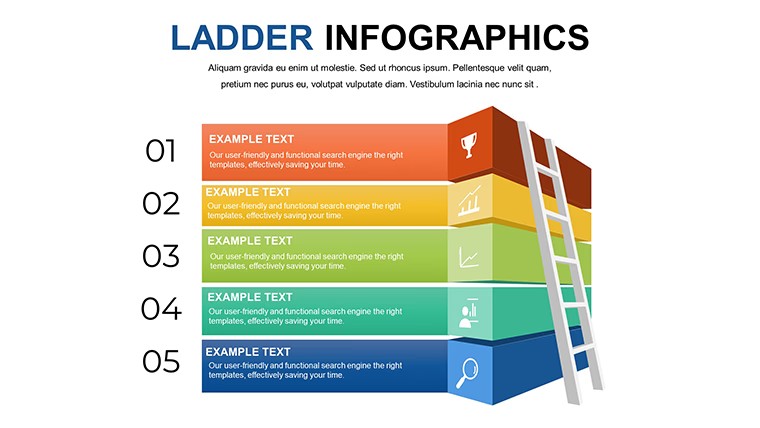
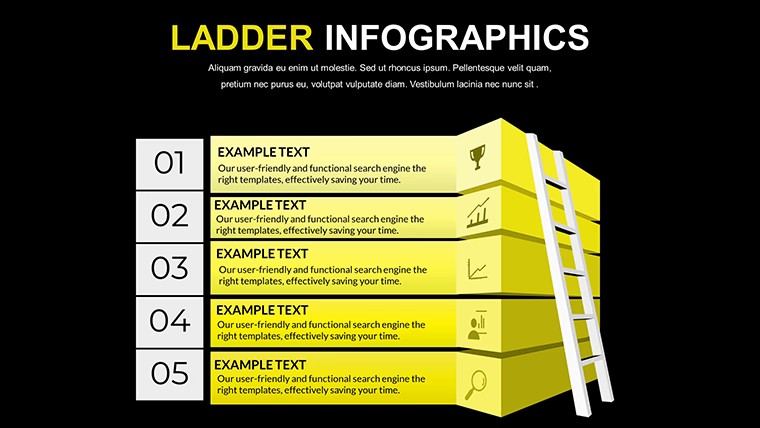
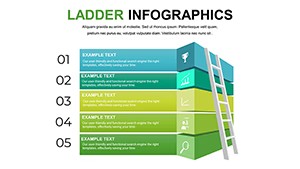
Visualizing progression has never been more intuitive than with ladder infographics, a metaphor that captures the essence of growth, hierarchy, and sequential achievement. Our Ladder Infographics Keynote Charts Template brings this concept to life in your presentations, offering a fresh way to illustrate steps toward success. Designed for those who need to communicate complex processes simply, this free template includes 8 editable slides packed with versatile ladder designs - from straightforward climbs to intricate branched paths. Ideal for marketers mapping customer journeys, educators outlining curriculum stages, or consultants detailing improvement plans, it turns abstract ideas into tangible ladders of insight. Forget flat bullet points that bore your audience; instead, invite them to ascend with you through customizable colors, shapes, and texts that align perfectly with Keynote's seamless interface. This isn't just a template - it's a toolkit for building engaging narratives that propel your message upward. Start your climb today by downloading this resource and watch your presentations reach new summits of effectiveness and appeal.
Ascending with Purpose: The Essence of Ladder Designs
Ladders symbolize steady advancement, making them perfect for presentations where order and progression matter. In business, for example, a sales team might use a ladder infographic to depict the pipeline stages, each rung representing a milestone from lead generation to closing deals. This template's high-quality graphics ensure every detail pops, with options for straight ladders for linear processes or zigzagging ones for adaptive strategies. Customization empowers you: swap out icons for industry-specific symbols, like briefcases for corporate climbs or lightbulbs for innovative steps. Drawing from design principles akin to those in Don Norman's user experience frameworks, the layouts prioritize intuitiveness, reducing cognitive load for viewers. Educators can adapt these for lesson plans, showing how foundational knowledge builds to advanced concepts, much like in Bloom's Taxonomy. The result? Presentations that not only inform but inspire action, fostering a sense of achievable progress in your audience.
Standout Features for Elevated Visuals
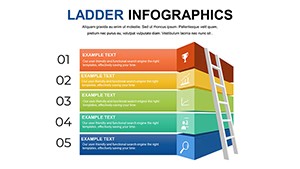
- Varied Ladder Styles: Choose from simple vertical ascents to multi-level hierarchies, catering to diverse narrative needs.
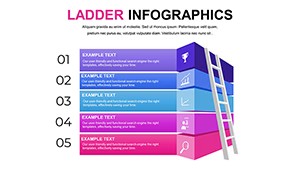
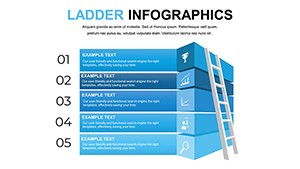
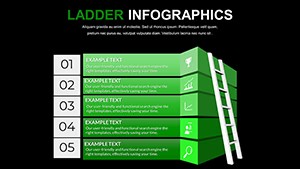
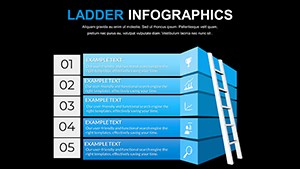
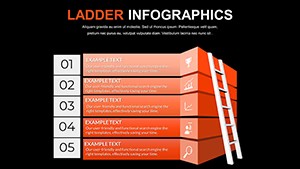
- Full Customizability: Edit shapes, colors, and text to brand your infographics, ensuring cohesion with your overall deck.
- Professional Graphics: Vector-based elements scale without loss, ideal for high-res displays in conference settings.
- Intuitive Interface: Keynote-native design means no learning curve - just drag, drop, and dazzle.
- Integrated Icons: Enhance rungs with thematic symbols, adding visual flair without extra effort.
These features go beyond basics, incorporating LSI elements like 'hierarchical diagrams' and 'process flows' naturally to boost search relevance while keeping content user-centric.
Climbing Through Scenarios: Practical Uses Explored
Let's scale real applications. For project managers, envision a ladder charting project phases, with each step detailing deliverables and timelines - proven to streamline team alignments in agile environments. Marketers might illustrate funnel optimizations, where lower rungs represent broad awareness and top ones signify conversions, backed by case studies from HubSpot's inbound methodology. In consulting, use branched ladders to map decision trees, helping clients visualize paths to success. A notable example: a startup accelerator program used similar infographics to guide entrepreneurs through funding stages, resulting in higher participant retention. Benefits include clearer communication, as per Harvard Business Review insights on visual aids improving comprehension by 400%. This template integrates into workflows effortlessly, allowing quick iterations for last-minute tweaks. Tips for mastery: Use gradients on rungs to denote difficulty levels, or animate ascents for dynamic reveals, turning static slides into interactive climbs.
Navigating Your Way: A Guided Workflow
- Acquire the Template: Download for free and open in Keynote to explore the 8 slides.
- Map Your Content: Identify your process steps and assign them to ladder rungs.
- Tailor the Design: Adjust visuals to match your theme, incorporating feedback loops if needed.
- Enhance with Details: Add annotations or data points for depth, ensuring each rung tells a story.
- Present with Confidence: Rehearse the flow, using transitions to simulate climbing motion.
This approach aligns with modern presentation tools, enabling collaborations via iCloud for team inputs.
Surpassing Ordinary: Why Choose Ladder Over Flat Charts
Standard Keynote options often fall flat - literally - lacking the vertical dynamism that ladders provide. This template outperforms by offering metaphorical depth, making hierarchies memorable per cognitive psychology principles. Value adds: Save design time, increase engagement metrics, and position yourself as an innovative communicator. For entrepreneurs pitching to investors, it could mean the difference in securing funding, as visuals like these clarify growth trajectories. Weave in workflow tips, such as pairing with data analytics for real-time updates, to keep content fresh. Ultimately, this tool isn't about climbing ladders - it's about elevating ideas to where they can be seen and appreciated.
Ready to step up? Grab this Ladder Infographics Keynote Charts Template now and build presentations that ascend beyond expectations.
Frequently Asked Questions
- Can I add more rungs to the ladders?
- Yes, the editable nature allows you to duplicate and modify elements for extended processes.
- Is this suitable for non-linear presentations?
- Certainly; branched designs support decision trees or parallel paths effectively.
- How do I incorporate data into the infographics?
- Use text boxes or integrate charts on rungs for quantifiable steps.
- Does it work on iPad Keynote?
- Absolutely, optimized for touch interfaces for on-the-go editing.
- Are there color scheme suggestions?
- Included palettes draw from accessibility standards for broad appeal.