 Click to zoom
Analysis Keynote Charts - Editable Keynote | ImagineLayout
| Format | .pptx |
| Slides | 40 unique layouts |
| Aspect ratio | 16:9 |
| Compatibility | PowerPoint |
| Animated | No |
| Language | English |
| License | Commercial |
| File size | — |
| Version | v1.0 |
| Last updated | April 2026 |
What's inside
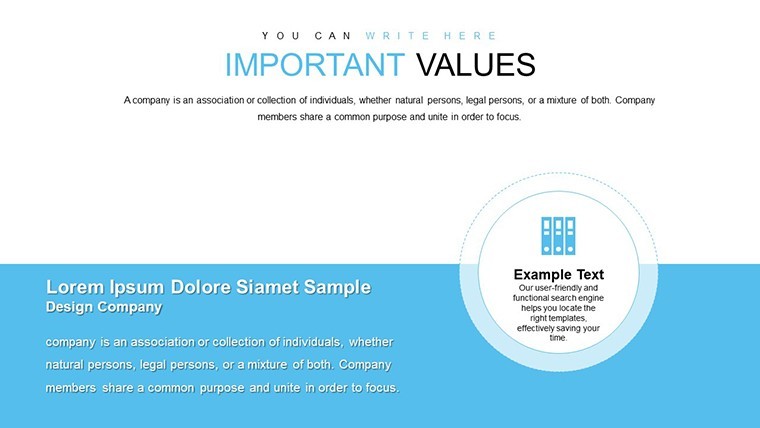
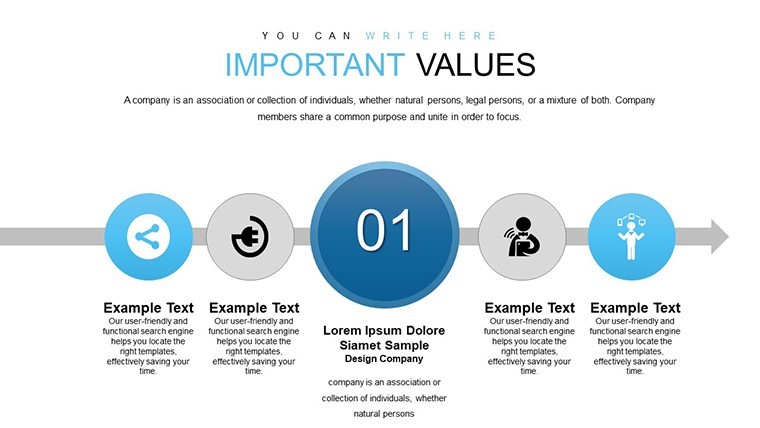
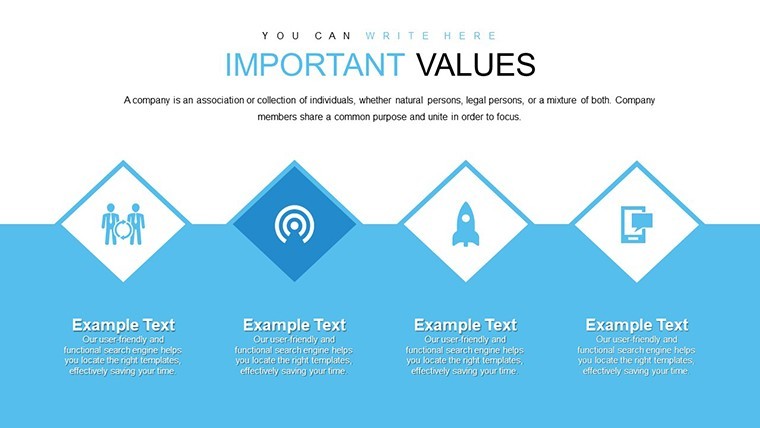
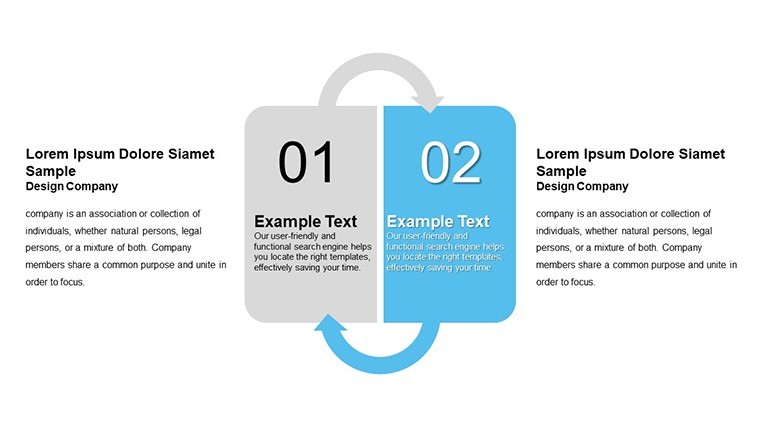
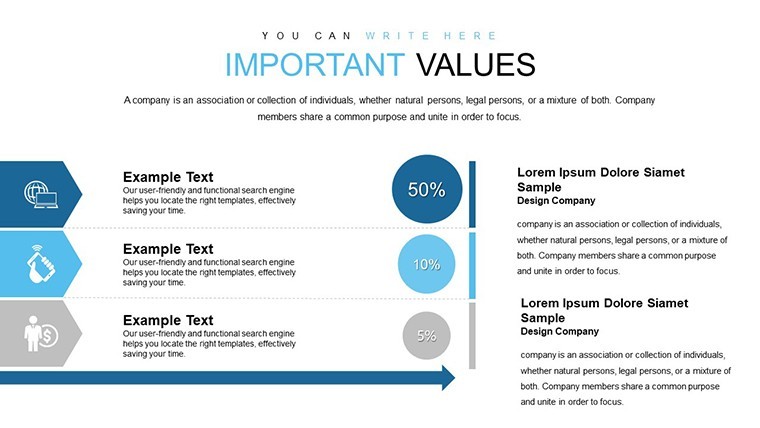
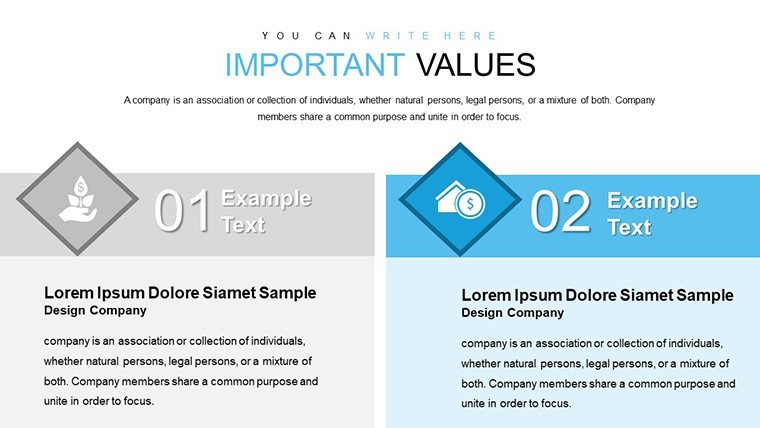
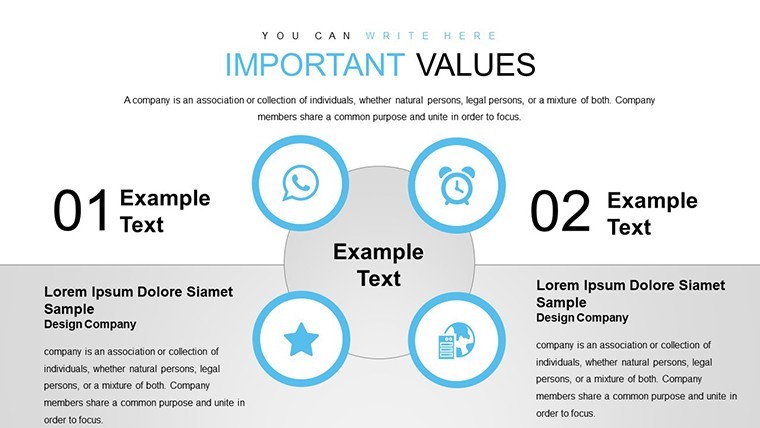
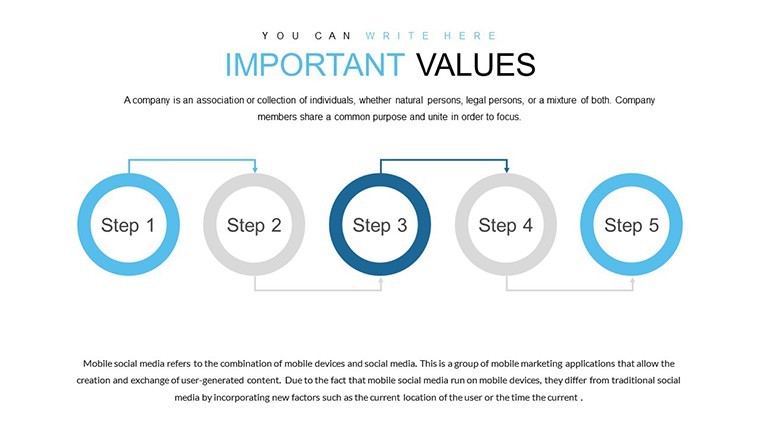
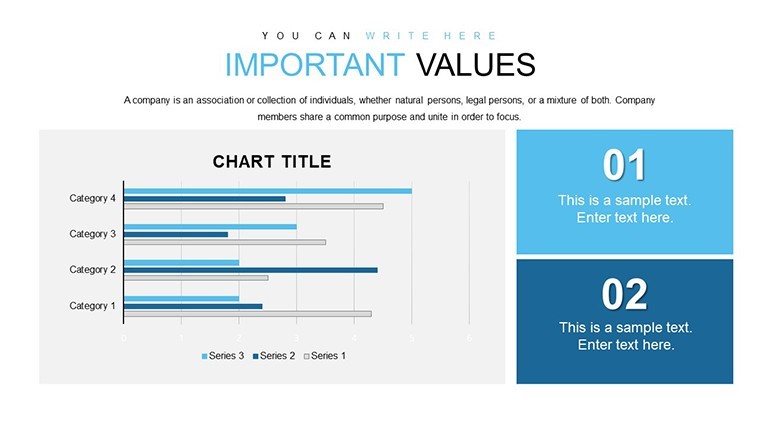
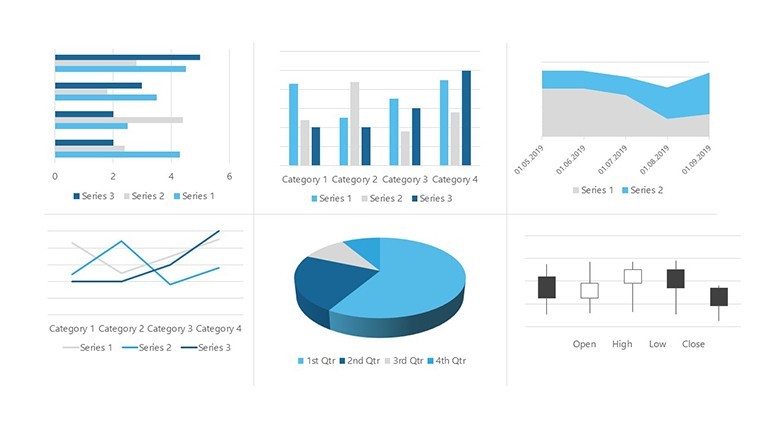
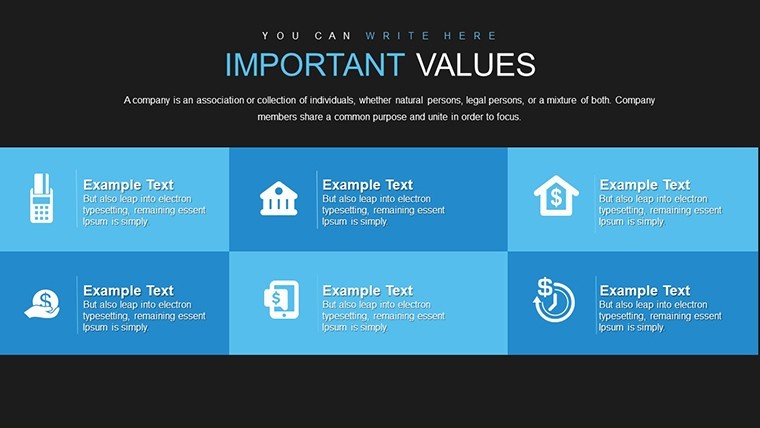
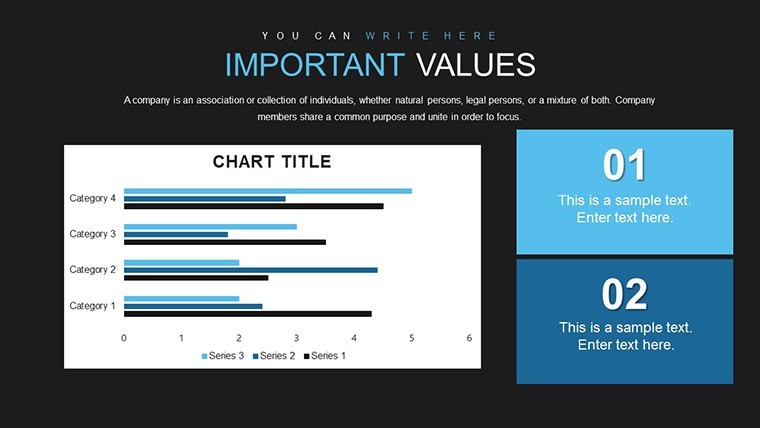
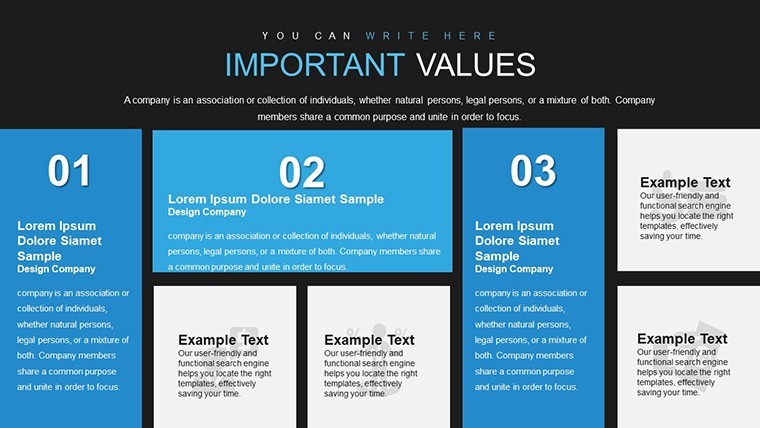
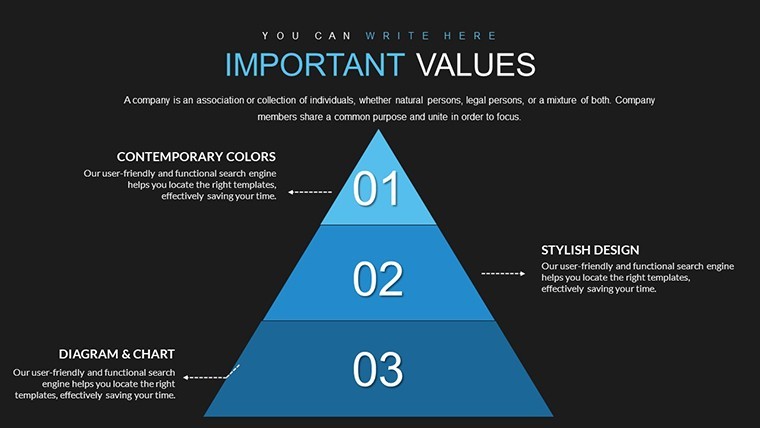
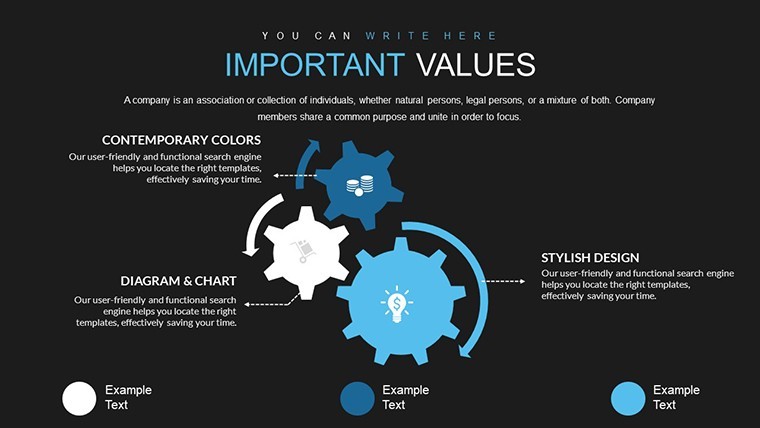
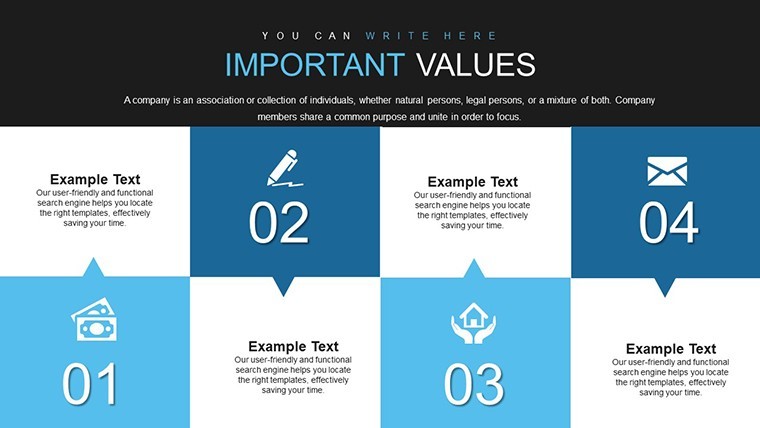
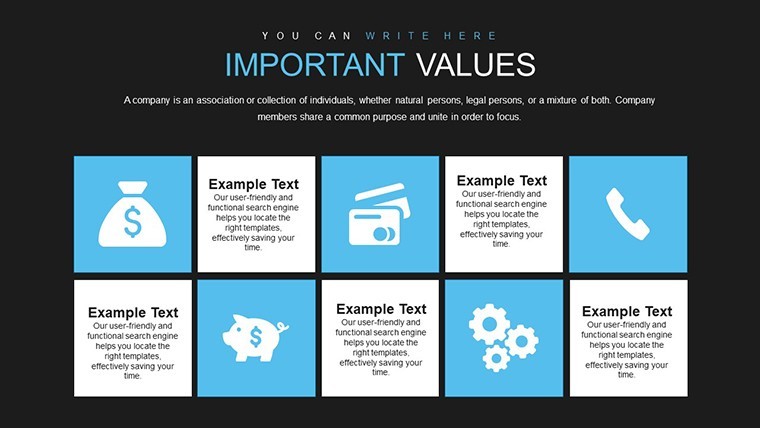
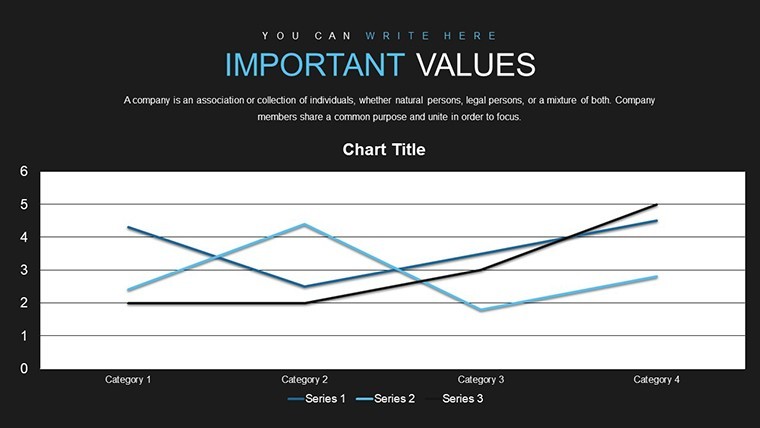
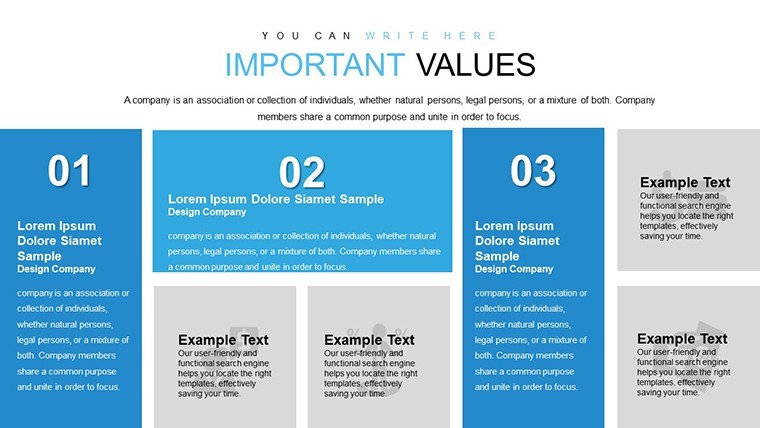
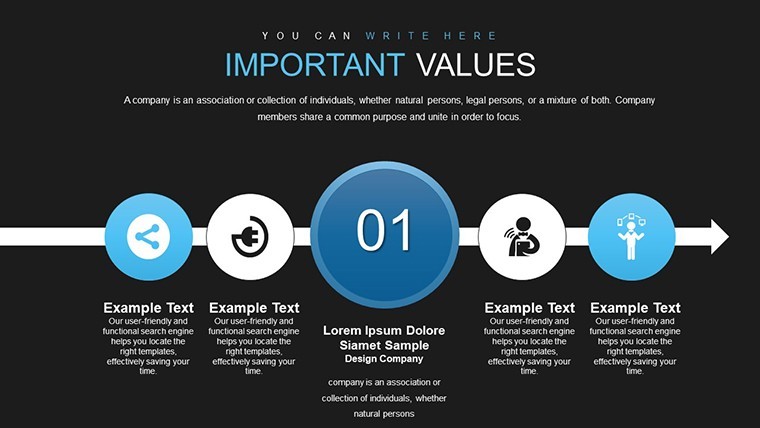
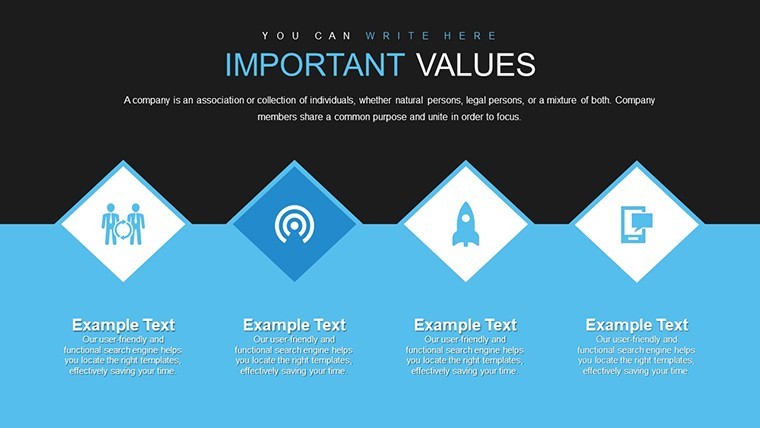
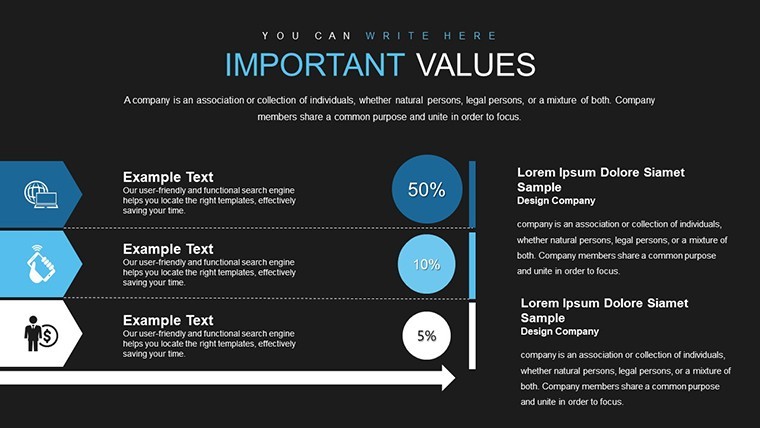
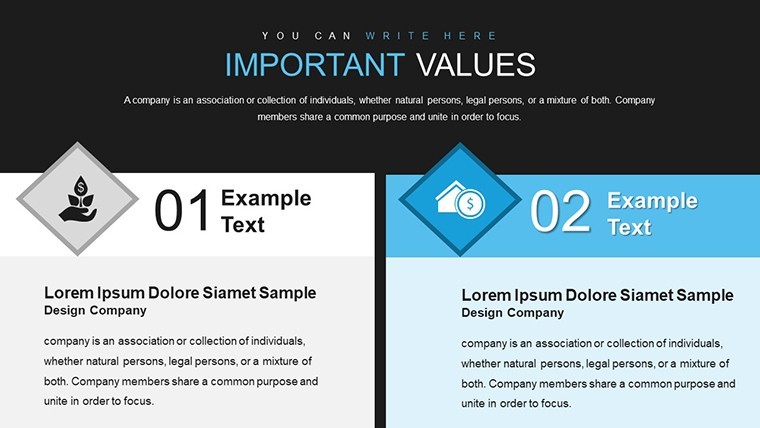
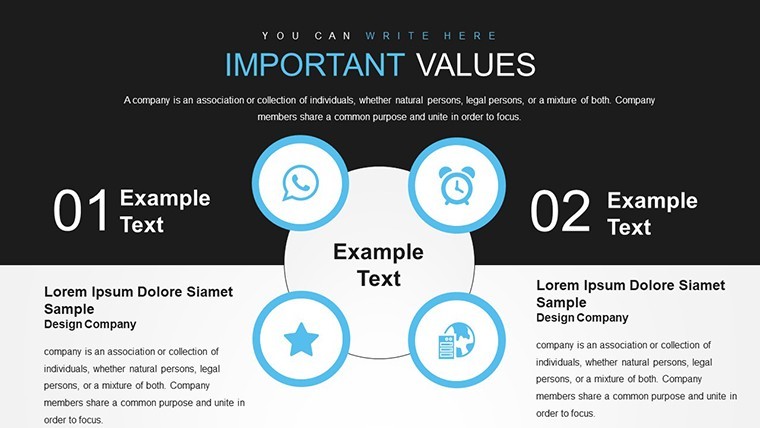
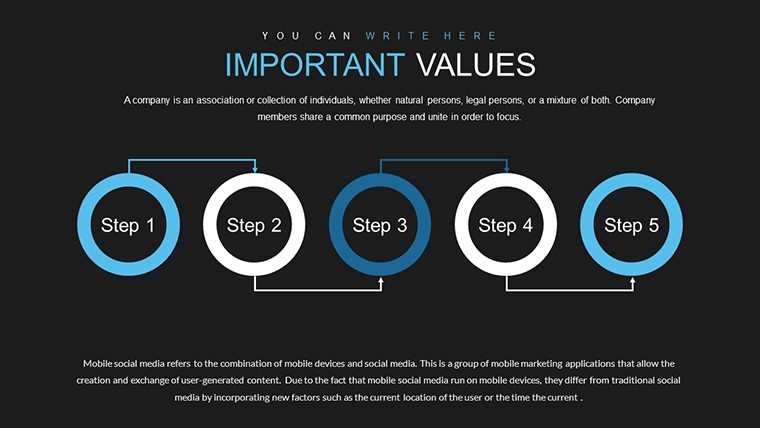
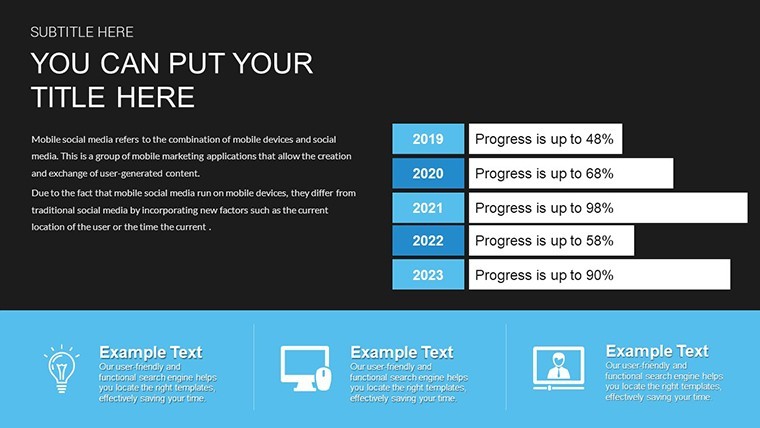
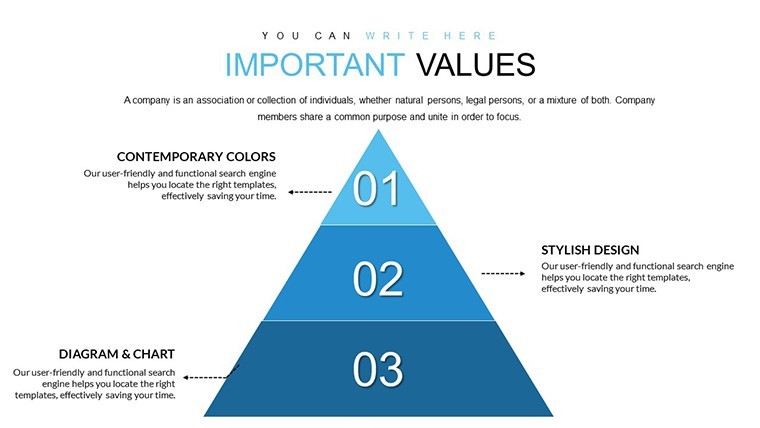
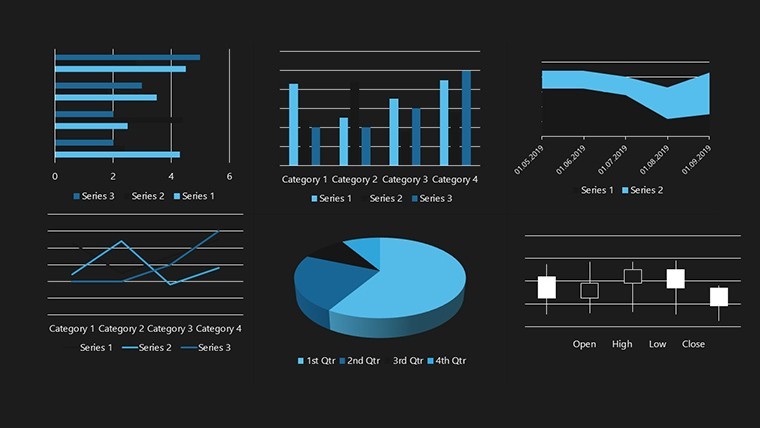
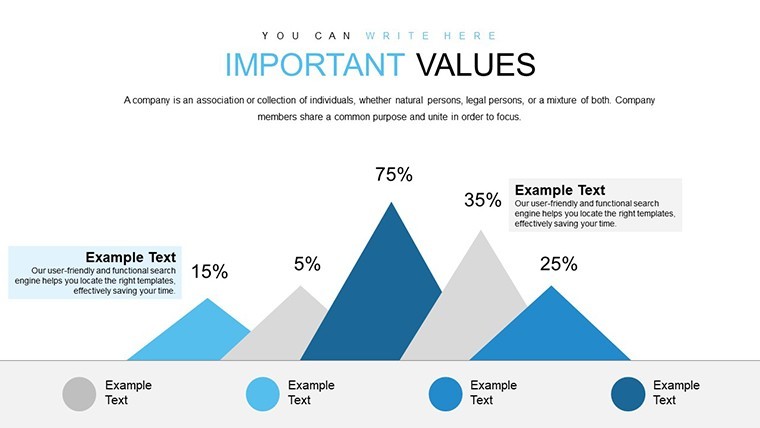
40 editable slides with bar column pie line scatter radar and heat map designs turn raw business data into clear visuals for board meetings.
No setup needed.
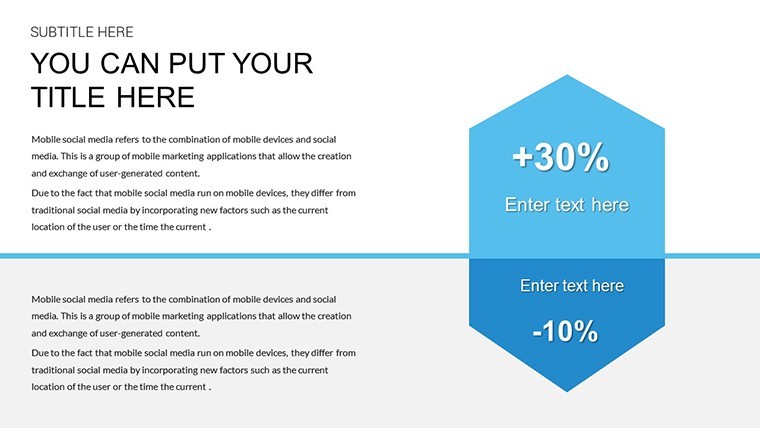
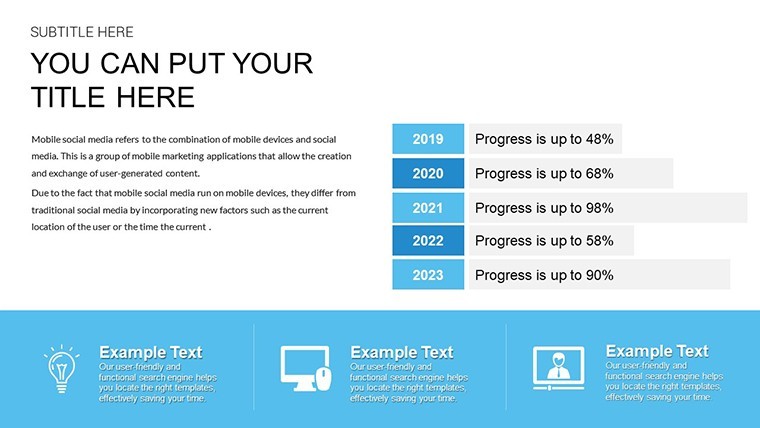
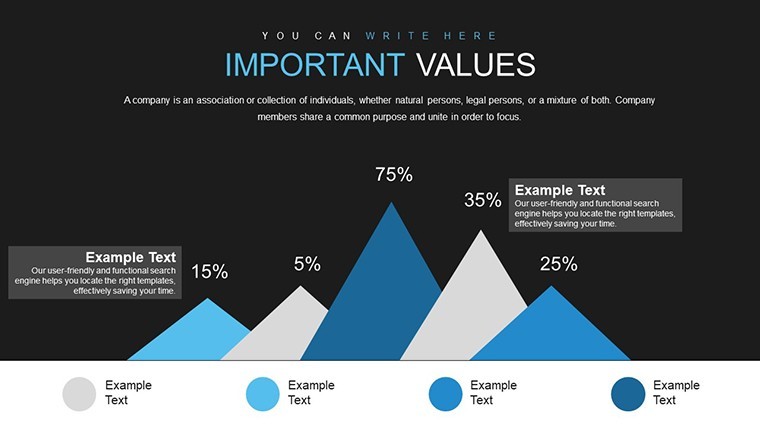
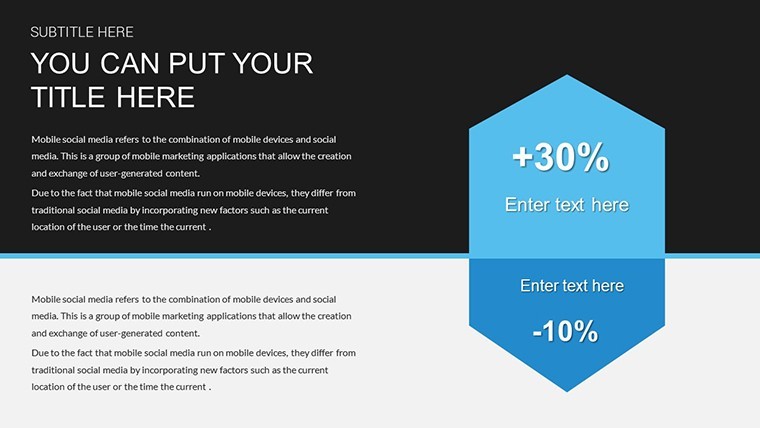
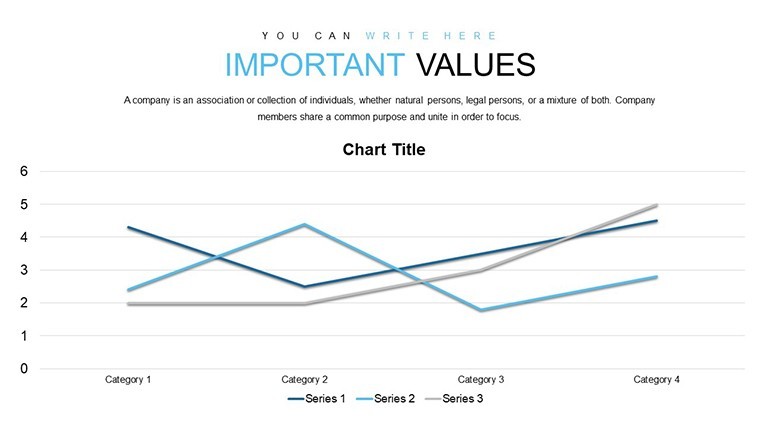
When you need to compare quarterly revenues or market shares to executives without building charts manually the bar and column layouts in this Keynote chart template handle the structure out of the box while pie and doughnut slides show percentage breakdowns and line area charts reveal trends over time.
You drop in your spreadsheet data and the structures update instantly in most cases.
In practice analysts consultants and executives rely on these charts to support comparison analysis and prioritization of metrics which helps identify which areas need immediate focus or resource reallocation.
The paid version delivers the full 40 editable slides with vector icons and custom animated effects while the page does not list separate free version contents but files follow standard KEY formats compatible with current Keynote installations.
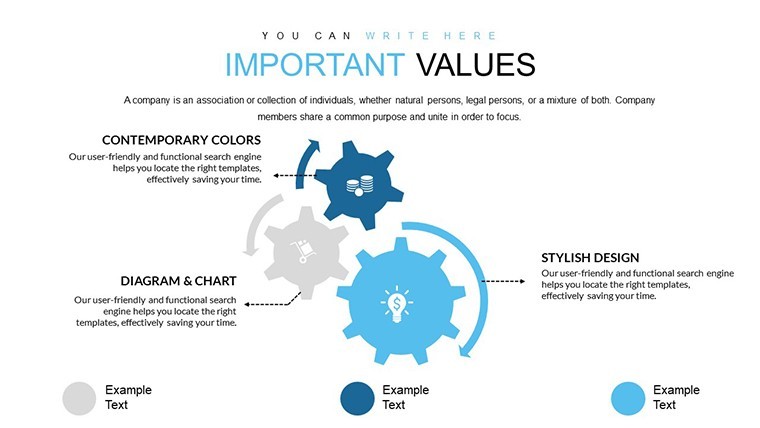
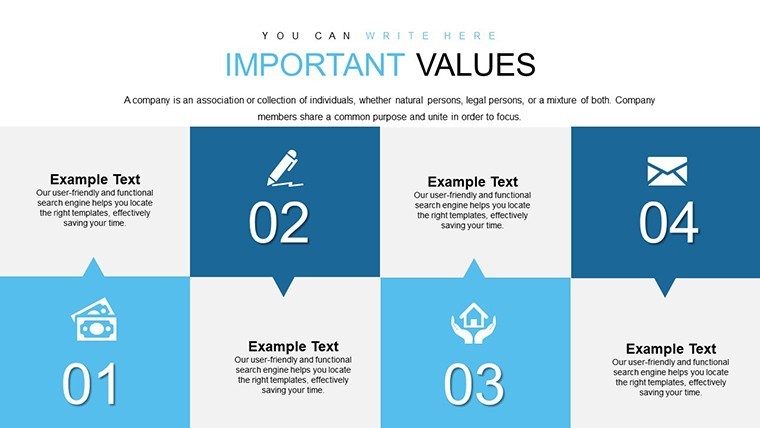
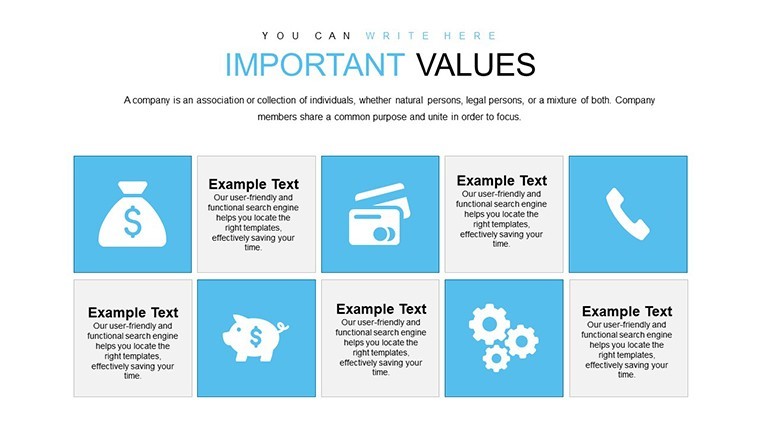
Color changes via slide master let you update the entire deck palette in one place.
This horizontal and vertical chart structure keeps everything aligned so you avoid adjusting spacing slide by slide.
Use this instead of building diagrams manually in Keynote.
The layouts work best for structured data summaries and are not ideal for creative storytelling slides or highly customized freeform designs.
Typically teams reuse the same diagram across weekly reports instead of starting from scratch each time.
After inserting your numbers the viewer can immediately see relationships and make decisions on budget adjustments or strategy shifts.
You open the file and start editing.
FeatureDetailsSlides / diagrams40 editable charts including bar column pie line scatter bubble radar and heat mapsFile format.keySoftware versionKeynote 12+ compatible with current installationsColor schemesMultiple color variations switched via slide masterEditable elementsAll charts icons text backgrounds and animations resize and recolor independentlyAspect ratio16:9 widescreenFree vs PaidPaid version delivers the full 40 slides with animations and iconsMasters / BackgroundsColor variations and vector elements includedHow do I change colors across all slides?Open the file in Keynote then select any slide and go to the slide master view. Edit the color palette once and it applies to every chart and element automatically. This works in most cases even after you have already added your own data. You can also adjust individual charts independently if needed for specific emphasis.
Can I use this template for client work?The single user license permits use in client projects as long as the template itself is not resold or distributed further. You deliver the final presentation file to your client with your content inserted. This covers internal and external presentations without additional fees in standard scenarios.
What is the difference between free and paid versions?The paid version delivers the complete 40 editable slides with full animations vector icons and custom effects. Separate free options are not detailed on the page but the full pack is the one you purchase here for complete functionality.
What are the refund conditions?Contact support within 30 days if the file does not meet your needs due to compatibility or functionality issues. Refunds are processed after verification that the template was not modified or used beyond initial testing. This policy applies to digital downloads with clear proof of purchase.
Does it work with PowerPoint 2016/2019/365/Mac?This is a native Keynote .key file so it opens directly only in Apple Keynote software. PowerPoint compatibility is not supported. The page confirms standard KEY format for current Keynote installations on Mac iPad or iPhone.
Browse more Analysis Keynote Charts
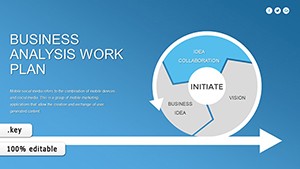
Business Analysis Work Plan Keynote Charts
You open the file and start editing.
Download and start editing immediately
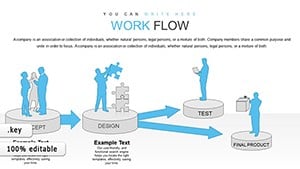
Good for
- Project roadmaps and sprint plans
- Product launch timelines
- Quarterly or annual review decks
- Company history and milestone summaries
Licence
reviews
Used it for a university report and the charts were simple
Added it to a work update and it looked organized
Worked fine for simple presentation
Just needed quick slides and it worked
FAQ
Will it work in Google Slides?
Are fonts embedded?
Can I use this for client work?
What's the refund policy?
Do you update the template after purchase?
Similar templates
See all Keynote Charts →
All 40 slides