Free Process Description Keynote Charts Template


Type: Keynote Charts template
Category: Free Templates, Tables
Sources Available: .key
Product ID: KC00616
Template incl.: 32 editable slides
Imagine transforming your convoluted business processes into crystal-clear visuals that captivate your team and stakeholders alike. Our free Process Description Keynote Charts template is your gateway to achieving just that. With 32 fully editable slides packed with flowcharts, timelines, and step-by-step diagrams, this resource is tailored for business managers, educators, consultants, and anyone who needs to communicate workflows effectively. Whether you're mapping out project timelines in a bustling corporate environment or illustrating training procedures for new hires, these charts simplify complexity without sacrificing professionalism.
Drawing from real-world applications, consider how project managers at firms like those adhering to PMI standards use such visuals to align teams on deliverables. This template not only saves hours of design time but also enhances comprehension, reducing miscommunications that can cost businesses thousands. Compatible with Apple Keynote and easily exportable to PowerPoint or Google Slides for broader collaboration, it's a versatile tool that fits seamlessly into your existing workflow. Dive in and discover how these charts can turn abstract ideas into actionable plans, fostering better decision-making and efficiency across your operations.
Unlocking the Power of Visual Process Mapping
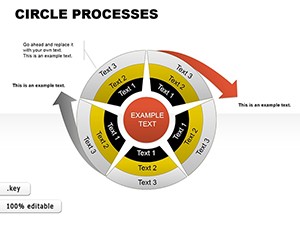
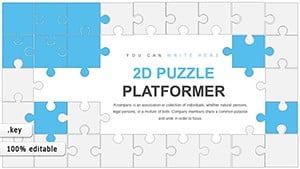
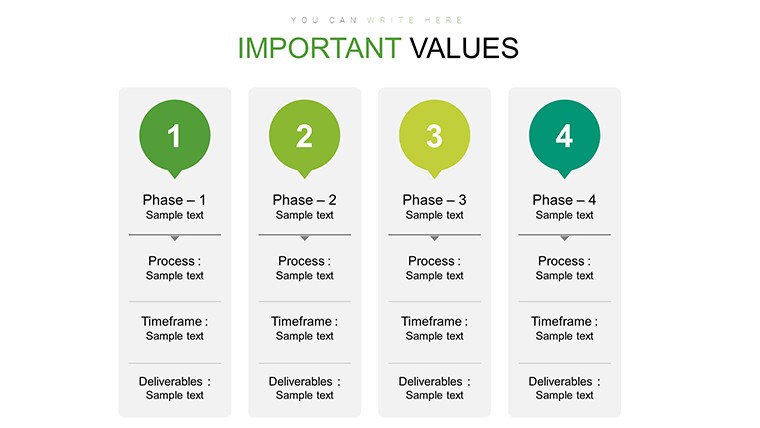
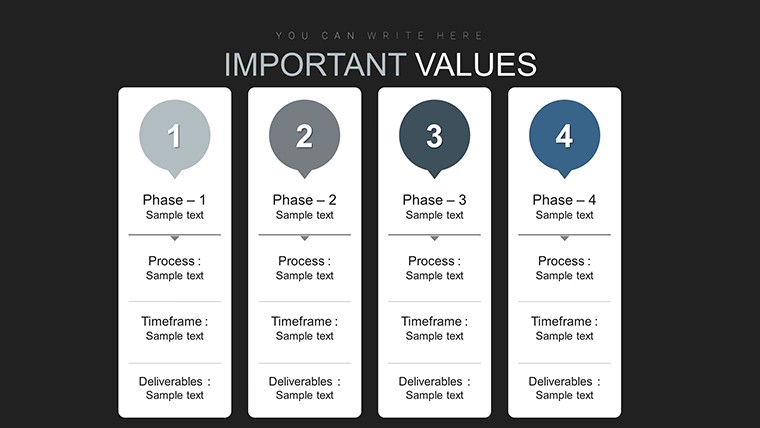
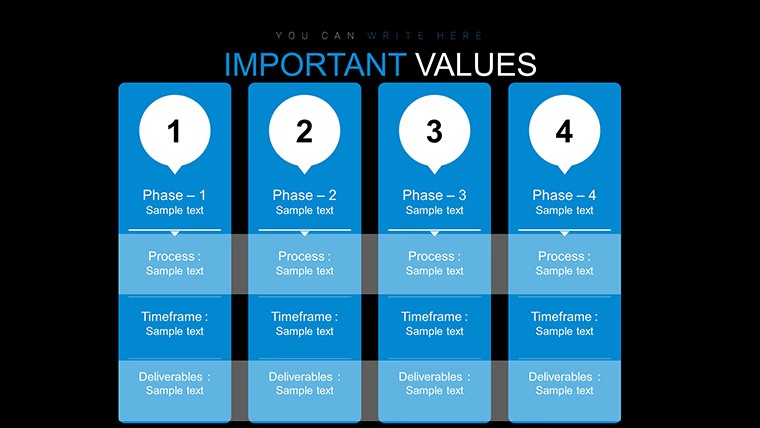
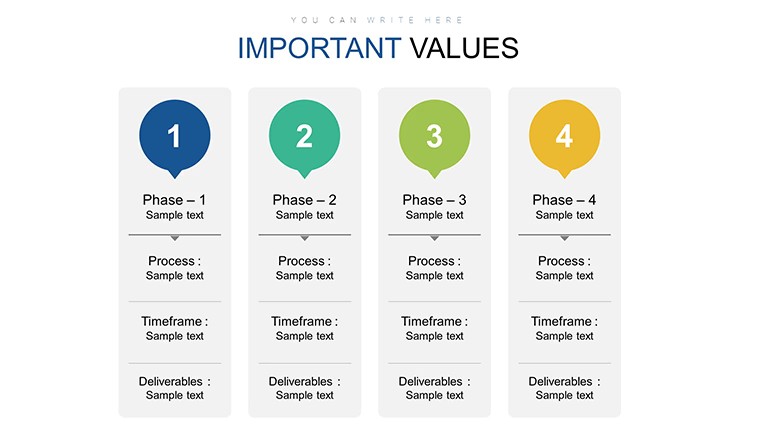
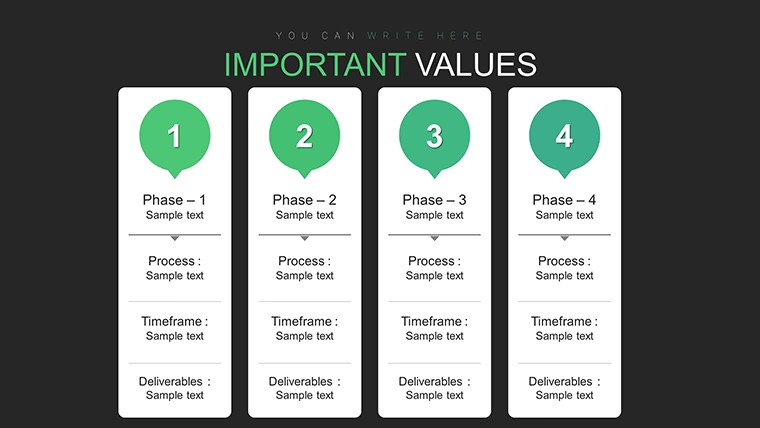
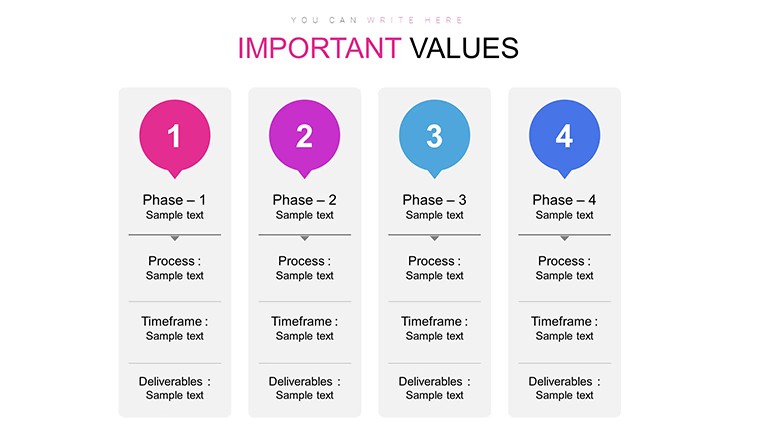
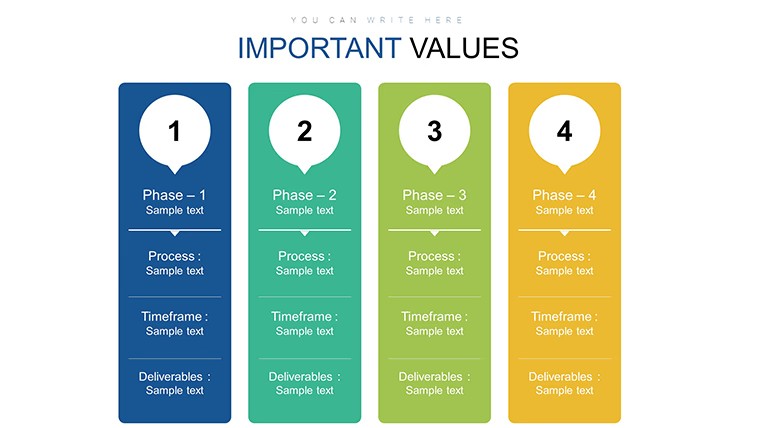
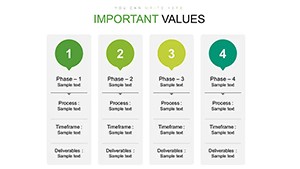
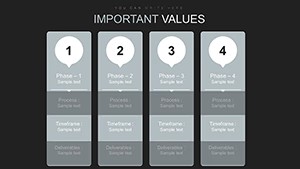
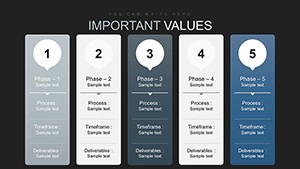
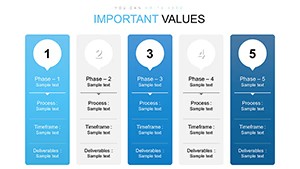
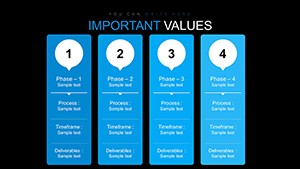
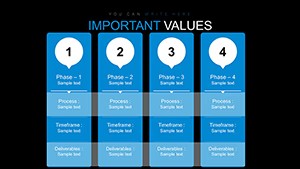
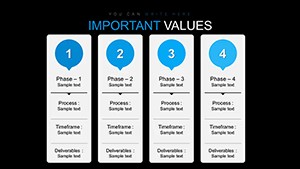
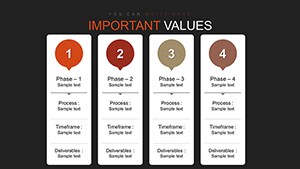
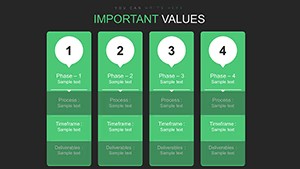
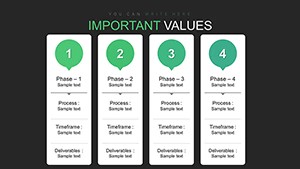
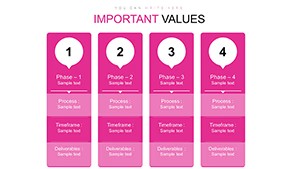
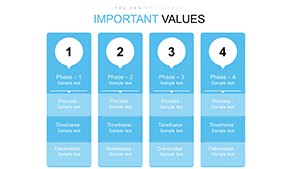
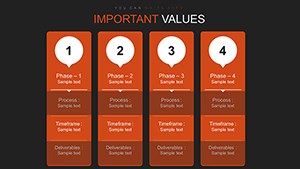
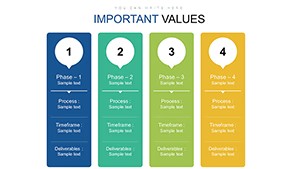
In today's fast-paced business landscape, the ability to convey processes visually is invaluable. Our Process Description Keynote Charts offer a suite of tools that go beyond basic diagrams. Each slide is meticulously designed with modern aesthetics – think clean lines, intuitive layouts, and a palette that adapts to your brand colors. For instance, the flowchart slides allow you to depict sequential steps with arrows that guide the eye naturally, making it easier for viewers to follow along during presentations.
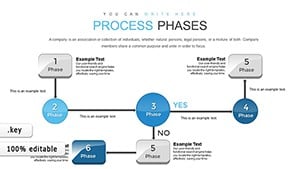
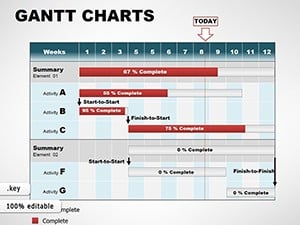
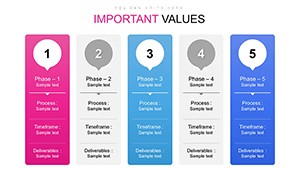
One standout feature is the timeline charts, which are perfect for showcasing project phases over time. Imagine presenting a software development lifecycle: start with ideation, move through development sprints, and end with deployment. By customizing data points, you can highlight milestones, dependencies, and potential risks, all while maintaining a professional polish that impresses executives. Educators might use these for lesson plans, breaking down historical events or scientific methods into digestible segments that engage students more effectively than text-heavy slides.
Customization That Fits Your Needs
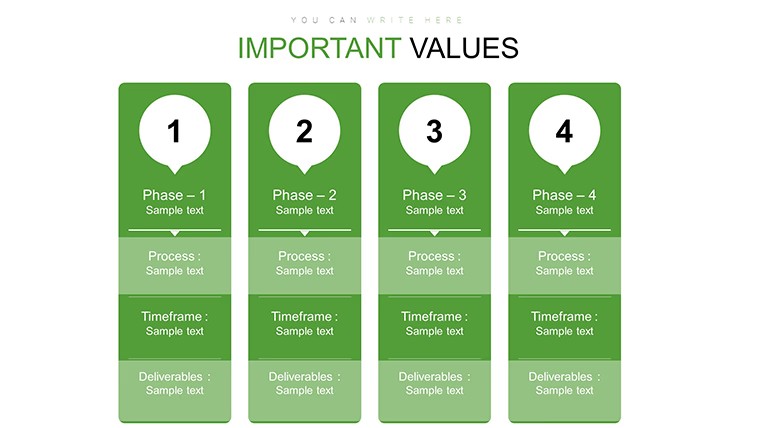
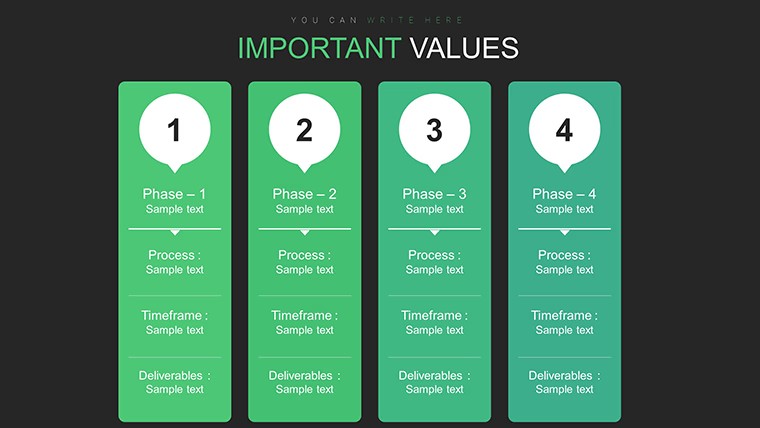
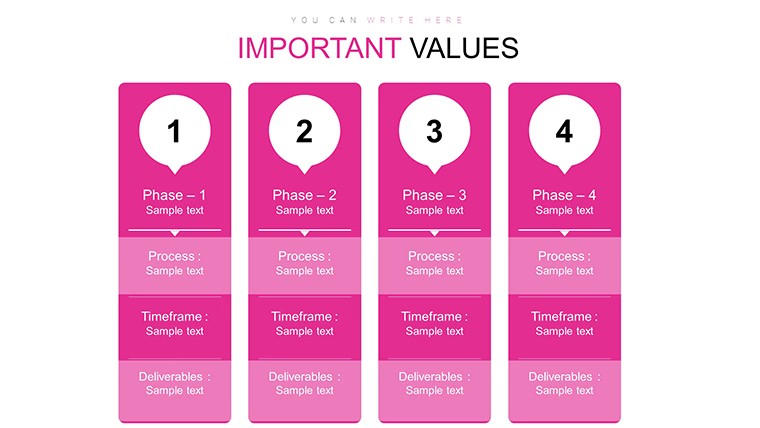
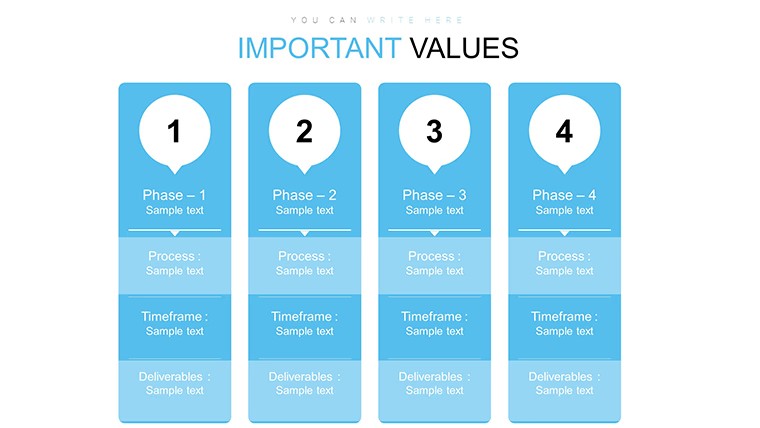
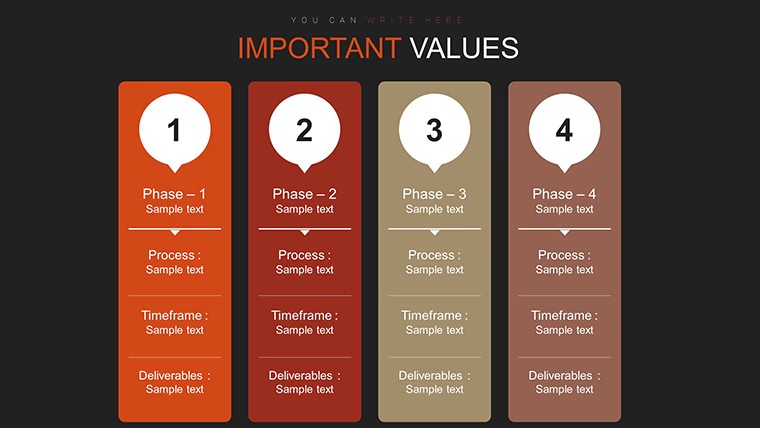
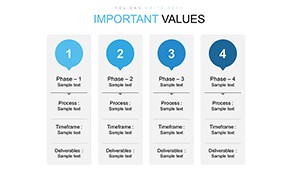
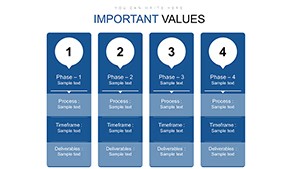
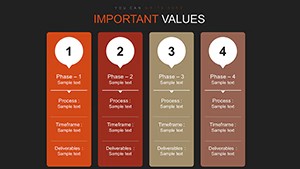
What sets this template apart is its unparalleled editability. Every element – from fonts and colors to shapes and text – can be tweaked in minutes using Keynote's intuitive interface. No graphic design degree required; just drag, drop, and adjust. This flexibility ensures your presentations align with company branding, whether you're in tech, healthcare, or finance. Plus, with high-resolution graphics, your charts look sharp on any screen, from laptops to large conference projectors.
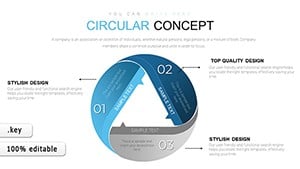
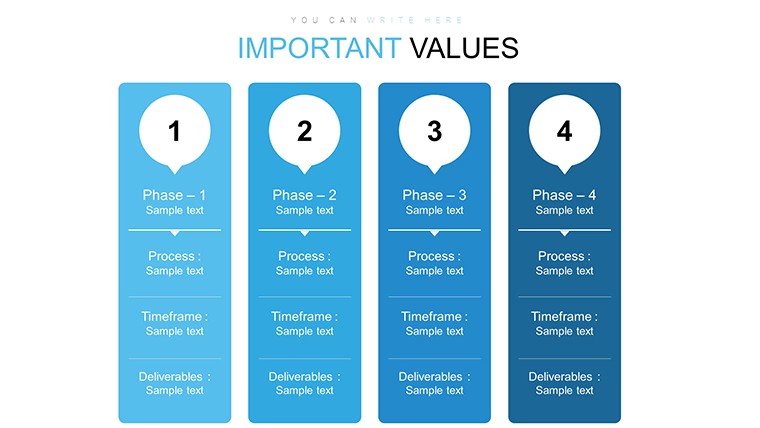
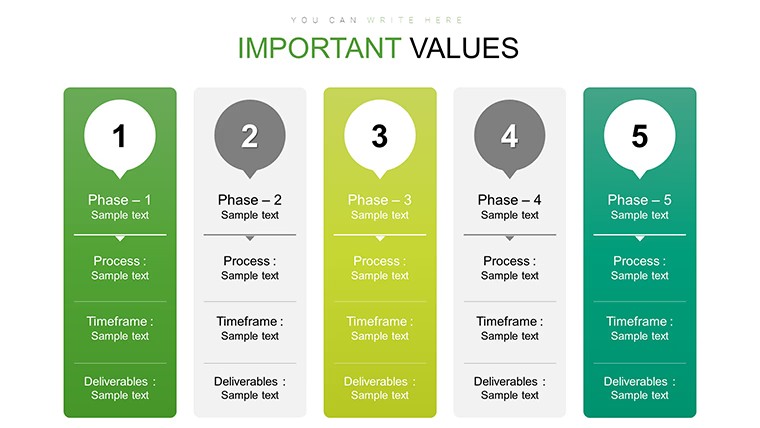
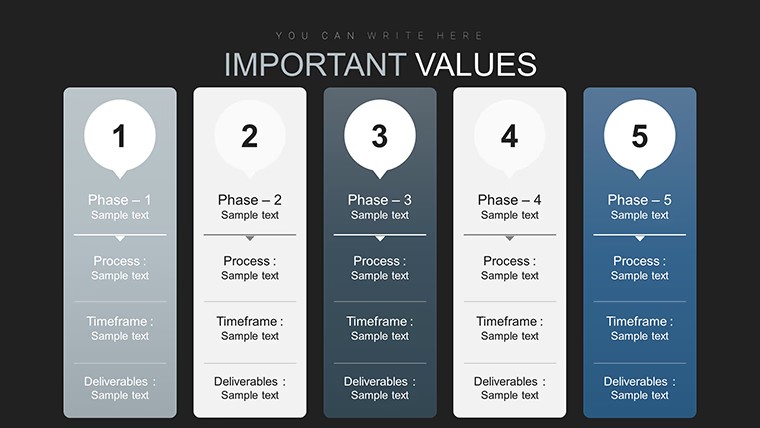
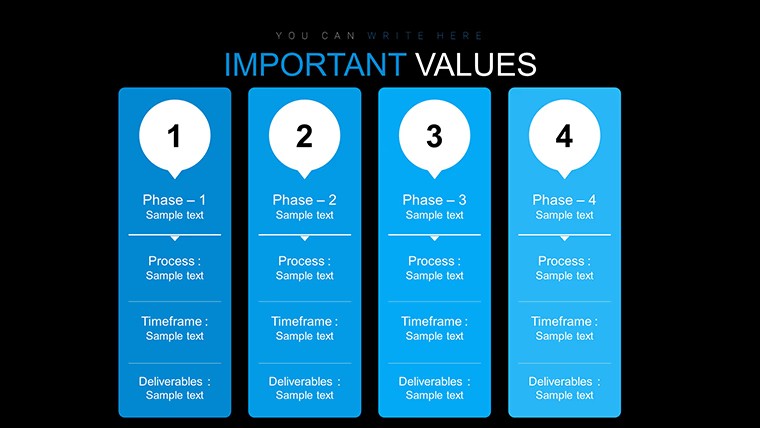
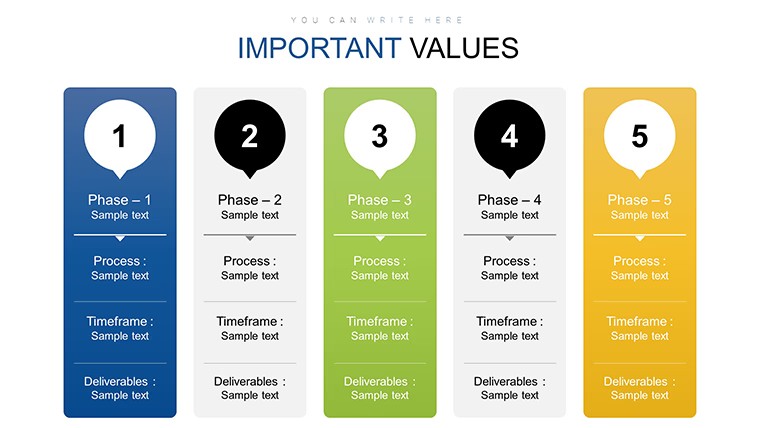
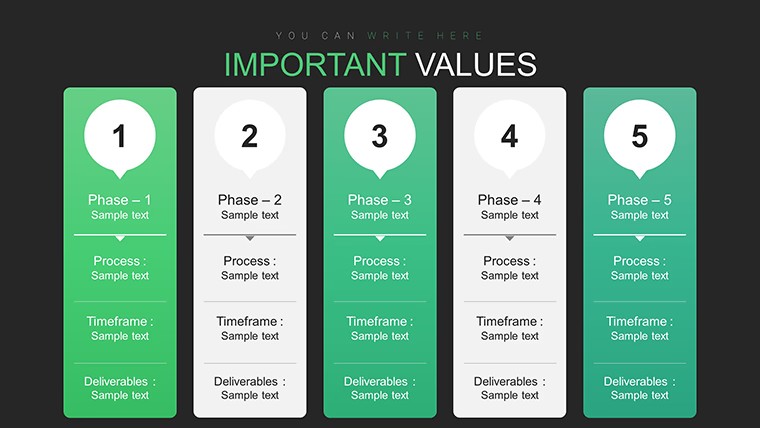
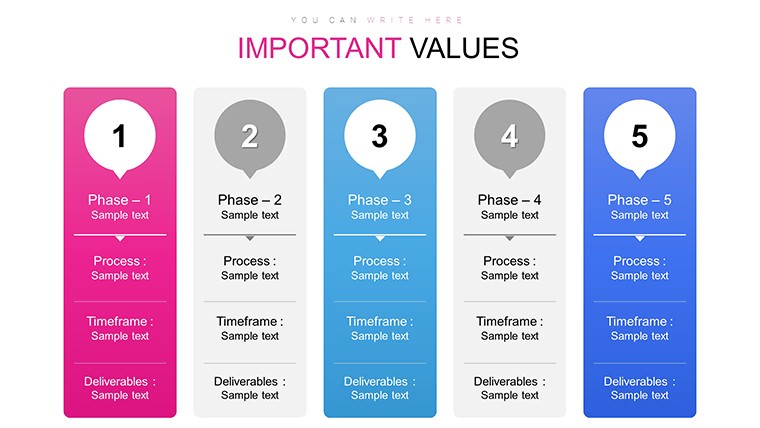
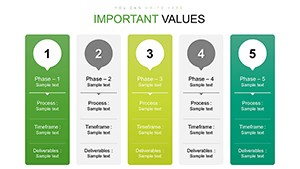
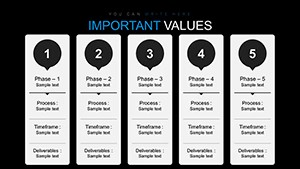
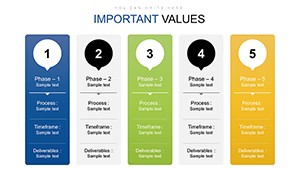
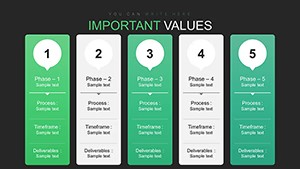
- Diverse Diagram Options: Choose from horizontal flows for linear processes or vertical stacks for hierarchical structures.
- Icon Integration: Incorporate themed icons like gears for operations or clocks for timelines to add visual flair.
- Data-Driven Elements: Embed placeholders for metrics, allowing real-time updates during meetings.
By leveraging these features, users report up to 40% faster preparation times, freeing you to focus on strategy rather than slideshows. Think of it as your secret weapon for turning routine reports into compelling narratives that drive action.
Real-World Applications Across Industries
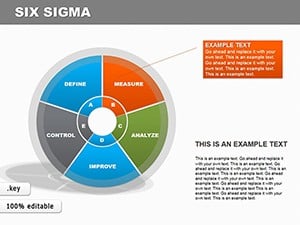
Versatility is at the heart of this template. In manufacturing, operations managers use these charts to document assembly lines, identifying bottlenecks that improve throughput. A case in point: a mid-sized factory revamped their quality control process using a customized flowchart from this template, resulting in a 25% reduction in defects as per internal audits.
For consultants, these visuals are gold when pitching process improvements to clients. Picture a management consultant illustrating a supply chain overhaul – starting with supplier evaluation, through logistics, to delivery. The step-by-step diagrams make abstract recommendations tangible, helping secure buy-in from skeptical stakeholders.
In education, trainers deploy these charts for onboarding programs. New employees can grasp company procedures quickly through visual aids, accelerating their productivity. Even in non-profits, program coordinators map out community outreach initiatives, ensuring all volunteers understand their roles in events like fundraisers or awareness campaigns.
Step-by-Step Use Case: Building a Project Workflow
- Download and open the template in Keynote.
- Select a flowchart slide and input your process steps, such as "Initiate Project" to "Close Out."
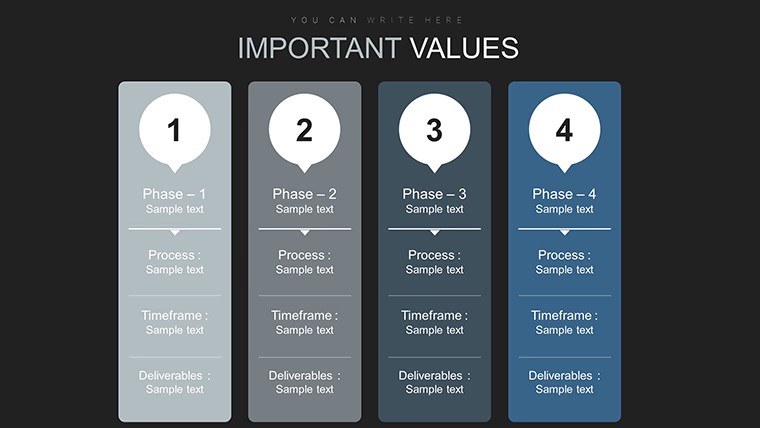
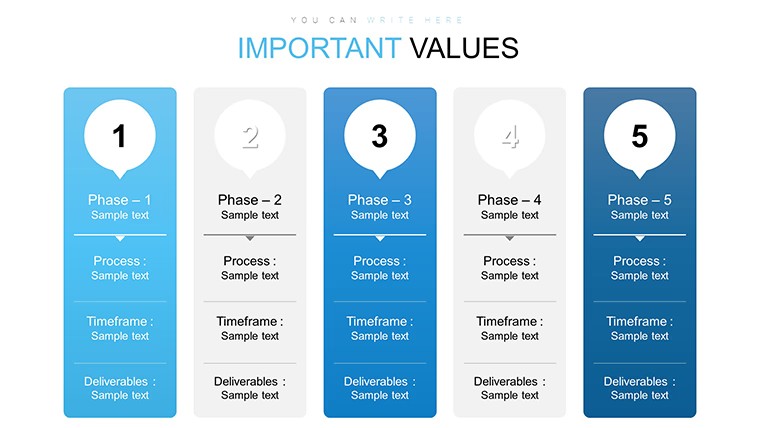
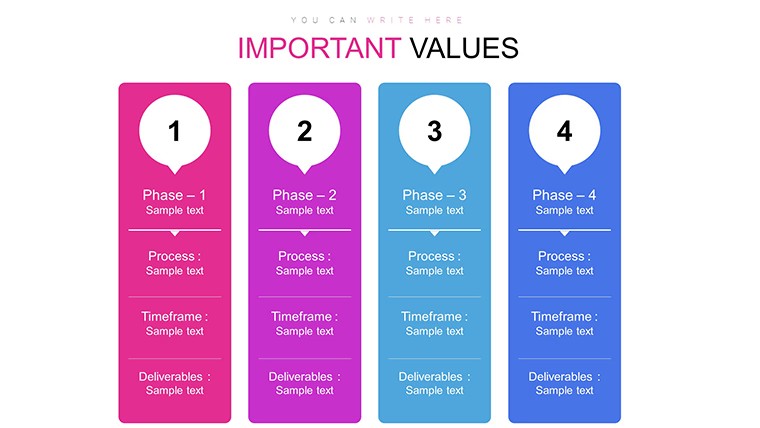
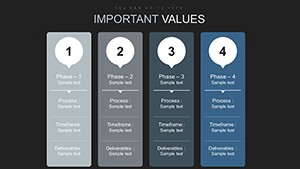
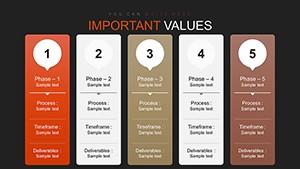
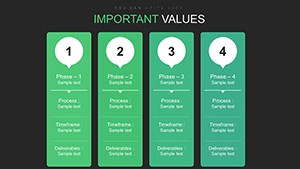
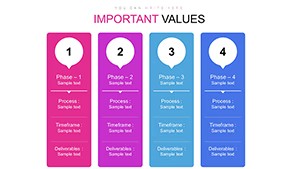
- Customize colors to match your brand – perhaps blue for planning phases and green for execution.
- Add icons and text annotations for clarity, like noting responsible parties.
- Export to PDF for sharing or present directly to gather feedback.
This straightforward approach not only streamlines your work but also positions you as an organized leader. Compared to starting from scratch in basic Keynote or PowerPoint, this template offers pre-built sophistication that elevates your output instantly.
Enhancing Engagement and Credibility
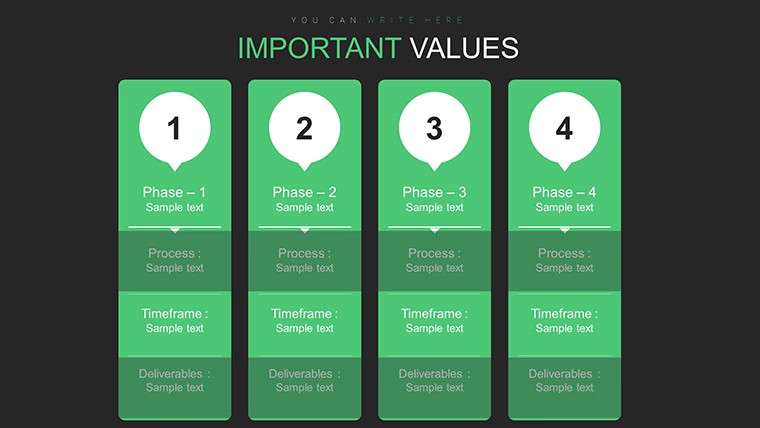
Audience retention skyrockets when presentations are visually dynamic. These charts incorporate engaging elements like animated transitions (easily added in Keynote) that reveal steps progressively, keeping viewers hooked. Trustworthiness shines through professional designs that align with industry standards, such as those from the Business Process Management Institute.
Moreover, the template's compatibility extends its reach. Export slides to Google Slides for cloud-based collaboration or PowerPoint for Windows users, ensuring no one is left out. This inclusivity is crucial in diverse teams, where seamless sharing prevents version control issues.
Tips for maximum impact: Pair charts with concise narratives – explain each step verbally while the visual reinforces. Use contrasting colors for emphasis, like red for warnings in safety procedures. Regularly update templates with fresh data to keep presentations current and relevant.
Elevate Your Process Visuals Now
Don't let outdated slides hinder your message. Grab this free Process Description Keynote Charts template and start creating presentations that inform, inspire, and influence. With its blend of functionality and style, it's the tool you need to stand out in meetings, workshops, or classrooms. Download today and watch your ideas flow effortlessly.
FAQ
Are these charts fully editable? Yes, every slide allows complete customization of text, colors, and layouts in Keynote.
Can I use this template in PowerPoint? Absolutely – export from Keynote to .pptx format for seamless compatibility.
What industries benefit most? Business, education, consulting, and more – anywhere processes need clear visualization.
Is there a limit on usage? No, download once and use indefinitely for personal or professional projects.
How do I add data to the charts? Simply replace placeholders with your metrics; no coding required.