Charts are the visual heartbeat of any Keynote presentation, turning complex data into digestible insights that keep audiences engaged. From sales metrics to project timelines, our Keynote chart templates are designed for presenters who demand clarity and creativity in equal measure. Tailored for executives, educators, and marketers, these tools help you craft slides that not only inform but inspire action.
Imagine illustrating quarterly growth with a sleek animated bar graph or mapping customer journeys via intuitive flowcharts - our templates make it effortless. Benefits include reduced design time, consistent styling across decks, and enhanced comprehension, as visuals can boost retention by up to 65% according to presentation experts. With options ranging from pie charts to scatter plots, there`s a perfect fit for every narrative.
Built with Apple`s native software in mind, each template leverages Keynote`s animation features for smooth transitions, ensuring your data unfolds dramatically. Whether prepping for a board meeting or a classroom lecture, these resources empower you to focus on your message rather than the mechanics. Scroll down to browse our curated gallery and elevate your next Keynote session with charts that command attention.
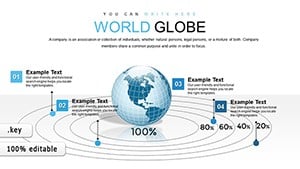
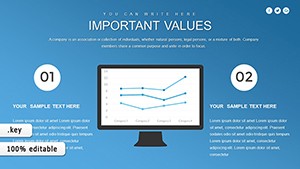


Keynote chart templates excel in business intelligence sessions, where pie and donut charts break down market shares for strategic discussions. In educational settings, line graphs track student progress over semesters, making abstract concepts tangible. Marketing teams deploy funnel charts to depict conversion paths, highlighting bottlenecks with color-coded alerts for quick fixes.
Nonprofits utilize radar charts for impact reporting, showcasing multi-faceted program outcomes to donors. Unlike Keynote`s default charts, which often feel stark and unpolished, our versions include thematic icons and gradient fills that align with brand aesthetics, fostering deeper audience connection.
Default Keynote charts require manual styling for every element, leading to inconsistencies and extra hours. Our pre-built templates offer modular components - swap datasets while retaining animations and layouts intact. This efficiency is a game-changer for iterative presentations, allowing real-time tweaks during rehearsals.
Additionally, they incorporate accessibility features like high-contrast modes and alt text placeholders, ensuring inclusivity without added effort. Users appreciate the embedded data validation, which prevents errors in large datasets, a frequent pitfall in ad-hoc designs.
Begin with your story: choose chart types that mirror your data`s flow, like area charts for cumulative trends. Layer subtle shadows for depth, but keep them under 20% opacity to avoid distraction. Animate elements sequentially to guide the eye, starting with axes for context.
These techniques ensure your charts not only look professional but also reinforce your key takeaways effectively.
Combine bubble charts with storytelling for product launches, where size represents market potential and color denotes risk levels. In workshops, interactive heat maps engage participants, revealing preferences through clickable zones. Creative agencies blend Venn diagrams with photo overlays for client mood boards, merging data with inspiration.
For TED-style talks, animated Gantt charts narrate project evolutions, syncing visuals with your spoken timeline. These applications turn static slides into dynamic experiences, captivating diverse audiences from C-suite to students.
Our templates sync effortlessly with Keynote`s iCloud features, enabling collaborative edits on the go. Download one today and watch your presentation metrics soar - clearer charts mean more memorable messages.
Curious about specifics? Check out our selection and start visualizing success immediately.
They feature advanced animations and thematic designs not found in standard libraries, optimized for high-impact storytelling.
Yes, most work with Keynote 2019 and later, with fallback options for earlier builds.
Use Keynote`s data editor to paste CSV files directly, with auto-formatting for seamless updates.
Absolutely, via Keynote`s share feature, allowing team members to refine charts simultaneously.
Export as PDF or PNG for integration into reports or social media without losing quality.
Templates are responsive, adapting perfectly to iPad Keynote for on-the-go editing.
Copyright © 2009-2026 ImagineLayout All rights reserved.