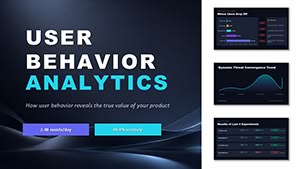
Data doesn`t speak for itself, but our PowerPoint chart templates do. Engineered for analysts, strategists, and educators, they convert raw figures into compelling visuals that uncover trends and opportunities.
Supporting everything from heat maps to Venn diagrams, these integrate seamlessly with Excel for real-time updates. Finance teams forecast budgets, while scientists model experiments with precision.
Highlights: Smart labels and trend lines that adapt to inputs. Overcome analysis paralysis with charts that clarify, not confuse.
Sift through our chart offerings and equip your slides with insight. Let data lead the way.
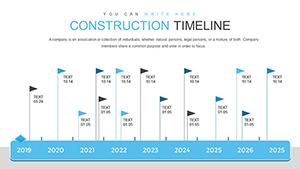
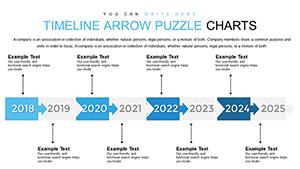
Creative Infographic Timeline Arrow PowerPoint Template: Narrate with Flair
ID: #PC00797
$18.00
(1122)
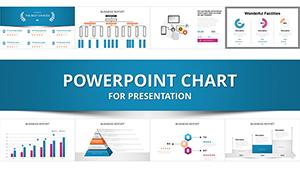
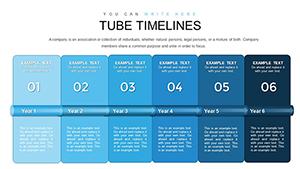
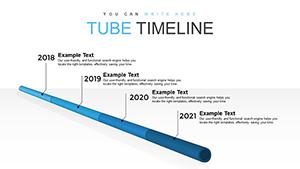
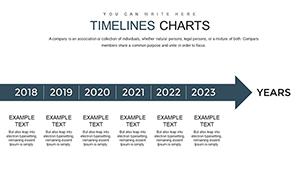
Professional Timeline PowerPoint Charts Template
ID: #PC00756
$15.00
(491)
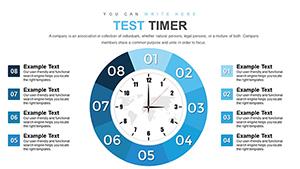
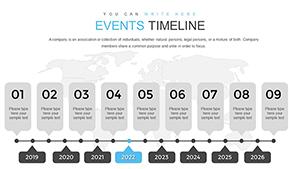
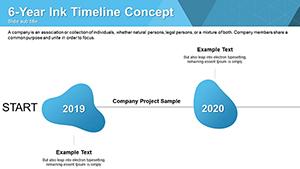
Free Ink Timelines PowerPoint Charts: Artistic Flow for Your Stories
ID: #PC00624
free
(184)
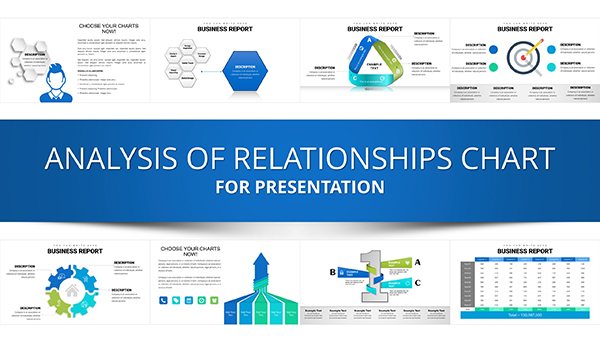
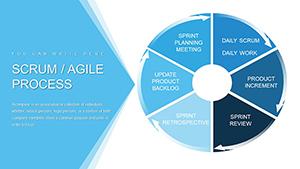
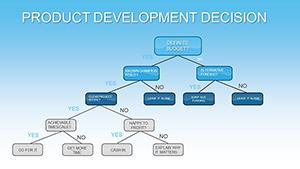
Choice and Advantages PowerPoint Charts: Master Decision Visuals
ID: #PC00563
$18.00
Targeted Uses for PowerPoint Chart Templates
HR specialists map employee demographics in pyramid charts, informing diversity initiatives. E-commerce owners dissect traffic sources via sunbursts, pinpointing high-converters.
Engineers diagram workflows with Sankey flows, tracing efficiencies.
Budget Allocations: Treemap distributions.
Survey Analysis: Radar profiles.
Risk Assessments: Bubble matrices.
Strategic Planning: Forecasting and Trends
Planners project sales with exponential curves, extrapolating from historicals. Advanced over basics with confidence intervals and annotations for context.
Recommend: Use consistent units to prevent misreads.
Scientific and Technical Fields
Lab reports feature box plots for variability, with outliers flagged automatically. Export-ready for journals, unlike fragmented inserts.
Balance axes symmetrically for unbiased views.
Superior Tools for Data Excellence
Charts come with pivot table links and conditional formatting. Exclusive: Interactive tooltips for hover details in presenter mode.
Implement today for sharper insights. Fresh additions keep pace with analytics evolutions.
Choose yours and chart success.
Frequently Asked Questions
Which data sources integrate best?
Excel, CSV, and SQL queries via Power Query for dynamic refreshes.
Can I animate chart elements separately?
Yes, sequence series or categories for progressive builds.
Are there mobile optimization tips?
Vector scaling and simplified legends ensure legibility on small screens.
How to handle missing data?
Templates include interpolation options and gap indicators.
What about multi-series charts?
Stacked, clustered, or 100% variants for comparative depth.