Environmental Impact of Projects PowerPoint Template and Charts


Overview
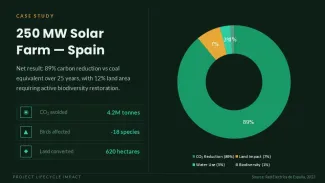
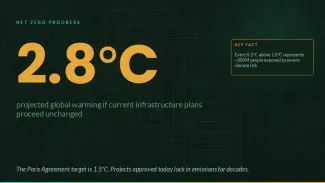
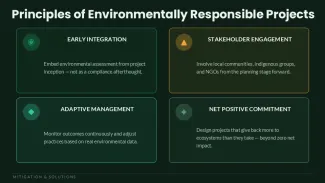
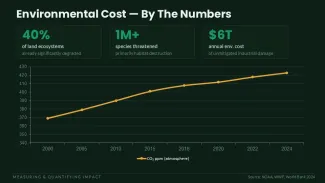
This PowerPoint Charts template is designed for project managers, sustainability teams and consultants who need to present environmental impact data of projects using cycle, graphs and flow visuals.
Practical Editing Features
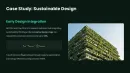
The template contains 23 fully editable slides with vector elements, chart data points and text placeholders that you can modify directly in PowerPoint.
Technical Advantages
- PPTX format compatible with standard PowerPoint versions
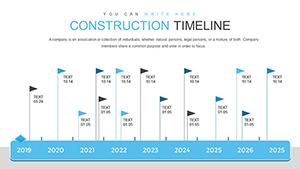
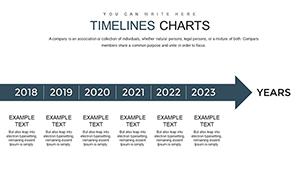
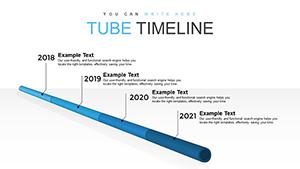
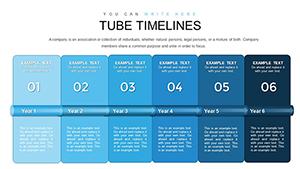
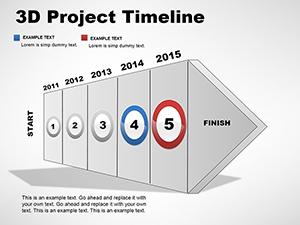
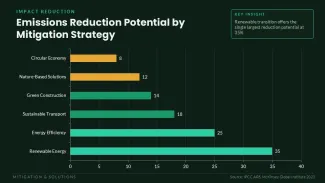
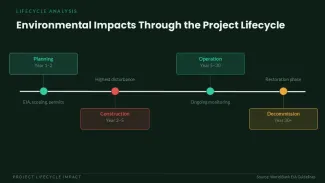
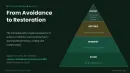
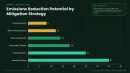
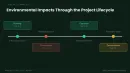
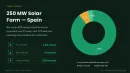
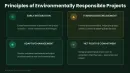
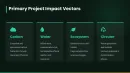
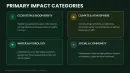
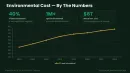
- 23 pre-designed slides with cycle, graphs and flow structures for environmental metrics
- Editable chart data points and placeholders for quick project-specific updates
- Consistent layouts help maintain visual clarity across multiple impact categories
| Specification | Details |
|---|---|
| Slides | 23 editable slides |
| File Format | PPTX |
| Aspect Ratio | Standard 16:9 |
| Categories | Cycle, Graphs, Flow |
FAQs
What types of diagrams are included?
The template includes cycle diagrams, graphs and flow layouts specifically created for visualizing environmental impact aspects of projects.
Can I edit the charts and icons?
Yes, all chart data points, vector elements and text placeholders are fully editable in PowerPoint.