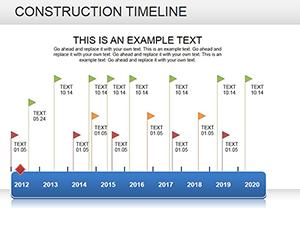
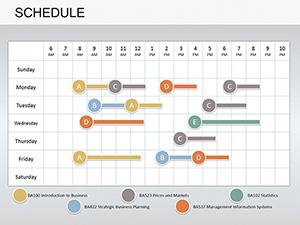
Master the art of sequencing with our timeline diagram PowerPoint templates, designed to illustrate progress, milestones, and narratives with precision and elegance. These versatile diagrams are essential for project managers, historians, and marketers who need to convey chronological stories without overwhelming complexity.
From plotting quarterly goals to recounting company evolutions, each template offers scalable lines, icons, and markers that adapt to your data. Benefit from clean, minimalist aesthetics that ensure focus remains on the journey, not the design distractions. Perfect for teams collaborating on strategies or educators breaking down historical events.
Our collection emphasizes usability, with drag-and-drop elements that let you customize durations, add annotations, and integrate photos seamlessly. Transform vague outlines into compelling visuals that drive decisions and spark discussions. Whether for boardrooms or classrooms, these templates make timelines your most powerful tool. Browse now and chart your path to success.
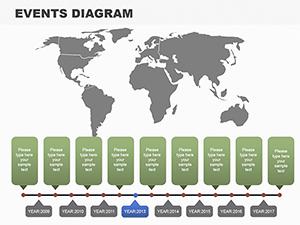
Timeline diagrams transcend simple lists by visually linking events, fostering a deeper understanding of cause and effect. Unlike scattered bullet points in standard templates, our designs use flowing arrows and tiered structures to highlight dependencies and achievements, ideal for complex projects like software rollouts or event planning.
In business, they shine in annual reports, showing revenue growth over years with upward-curving paths. Academics favor them for literature analyses, tracing plot developments. The edge? Pre-formatted nodes that auto-adjust spacing, preventing cluttered slides.
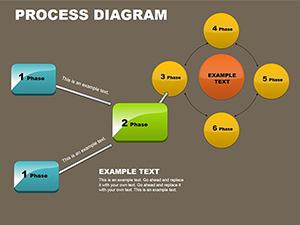
Standard PowerPoint diagrams often lack polish; ours include thematic variants like curved organics for creative flows or straight lines for corporate rigor.
Begin with a broad overview slide, zooming into details progressively to build narrative tension. Opt for consistent iconography - clocks for deadlines, targets for goals - to aid quick comprehension. Limit to 7-10 milestones per slide to avoid cognitive overload, and use color coding for categories like risks versus successes.
For innovation, incorporate interactive hyperlinks to supporting docs, turning static timelines into navigable stories. Test on various screens to verify legibility, ensuring your roadmap resonates universally.
These strategies amplify clarity, making your presentations not just informative, but influential.
Consider a startup using our vertical timeline to pitch funding rounds, visually stacking investor milestones against product betas - resulting in 30% faster closes. Or a nonprofit diagramming impact over decades, with photo integrations that humanize data, boosting donor engagement.
Such applications demonstrate how timelines bridge gaps between past lessons and future aspirations, fostering trust and momentum.
Empower your narratives with precision - select a template today and map out success. Check out related categories for more diagramming tools.
Copyright © 2009-2026 ImagineLayout All rights reserved.