Unfold your plans with our professional timeline PowerPoint charts designed for clarity and impact. Perfect for business projects educational lessons and marketing strategies
Visualize key dates tasks and milestones easily while keeping your audience engaged
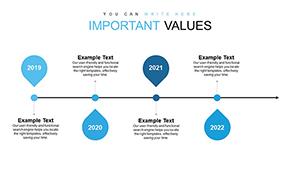
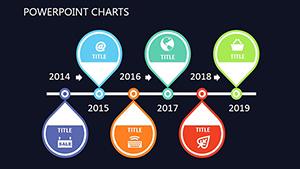
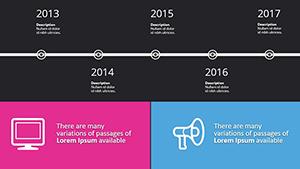
Stories Archive Dark PowerPoint Template: Editable Timelines for Historical Narratives
ID: #PC00364
$14.00
(278)
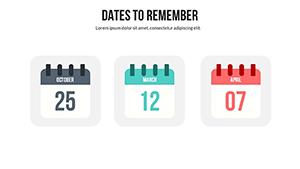
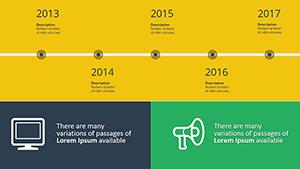
Timelines Stories Archive PowerPoint Charts Template - Download Now
ID: #PC00363
$14.00
(917)
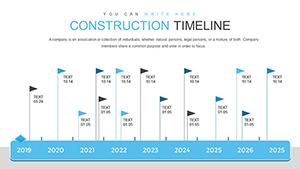
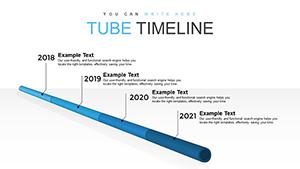
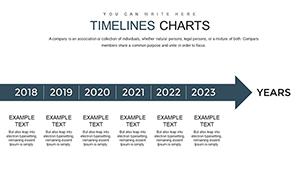
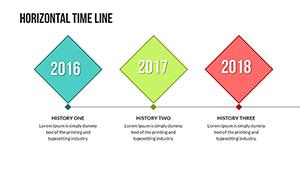
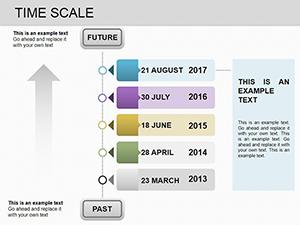
Time-Scale Timeline Charts PowerPoint Template: Chart Your Path Through Time
ID: #PC00219
$18.00
(699)
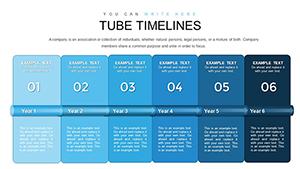
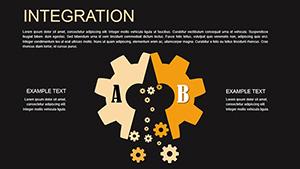
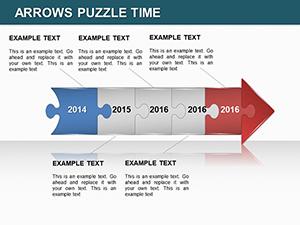
Arrows Puzzle Time PowerPoint Charts: Unlock Dynamic Timeline Visuals
ID: #PC00214
$20.00
Why Choose Our Timeline PowerPoint Charts
Our timeline charts offer a professional and engaging way to present events tasks and milestones. Unlike default templates they provide adaptable layouts and dynamic visuals that make your data come alive
Real-World Use Cases
Business Reports: Illustrate project phases and deadlines clearly
Education: Plan lessons and student timelines effectively
Marketing: Schedule campaigns and track milestones visually
Benefits Over Default Templates
Fully editable and customizable designs
Professional layouts save time and enhance presentations