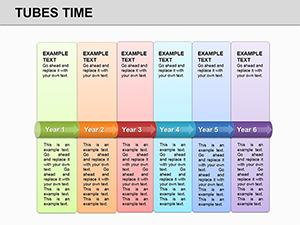
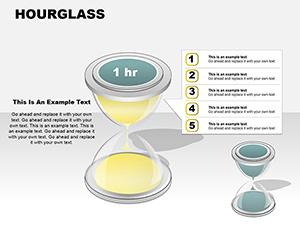
Harness the essence of progression with our time PowerPoint diagram templates, focused on clocks, Gantt charts, and process wheels. Geared toward managers, analysts, and trainers, these visuals distill temporal data into digestible, dynamic forms.
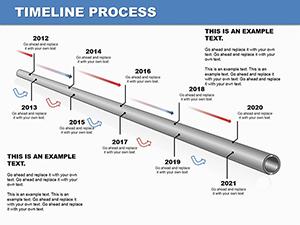
From circular hour breakdowns to linear sequence arrows, they facilitate clear communication of deadlines and durations. Tweak scales, add milestones, and animate flows to match your pace, all within PowerPoint`s robust diagramming suite.
For workshops, reports, or strategy sessions, these templates provide the backbone for time-sensitive discussions. Leaf through our gallery and clock in the diagram that ticks with your needs. Time your presentations for maximum resonance.
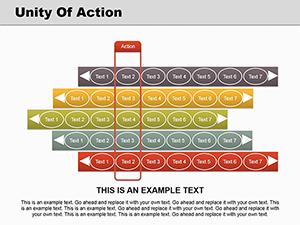
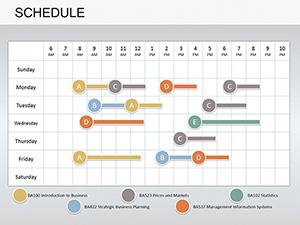
Time diagrams excel at compressing schedules into scannable overviews, using PowerPoint`s connector tools for fluid links. Productivity experts favor the Pomodoro-style cycles, while project leads rely on dependency webs for risk assessment.
They outpace static tables with phased reveals, timing information delivery to audience rhythm.
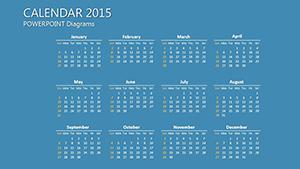
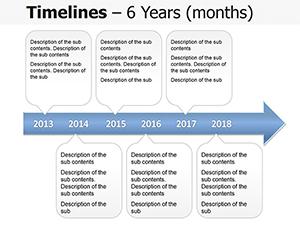
Spans from daily ops to decade-long views.
Standard shapes lack temporal scaling, causing proportion errors in long timelines. Our templates auto-adjust intervals and include buffer zones for delays, with color gradients signaling urgency levels - features absent in basics.
Integration with Excel for live updates keeps diagrams current, unlike manual redraws.
These refine your diagramming finesse.
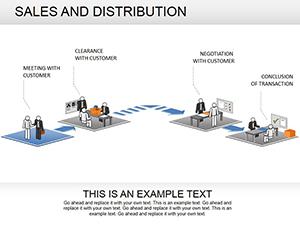
A software dev team mapped sprints via interlocking gears, accelerating feature rollouts. In healthcare, shift rotations were circled on 24-hour dials, reducing overlaps and burnout.
Marketing campaigns timed phases with arrow cascades, optimizing launch synergy. These prove diagrams` timely transformations.
Set your clock - select a time diagram and synchronize success.
What diagram types are available?Linear timelines, radial clocks, process loops, and hierarchical trees.
Integration with Outlook?Yes, pull calendar events directly into diagrams.
Custom scales possible?Adjust from minutes to years with variable increments.
Animation syncing?Builds align with duration labels for realistic flows.
Accessibility for color-blind users?Pattern fills and textures supplement hues.
Copyright © 2009-2026 ImagineLayout All rights reserved.