Secure more contracts with our targeted tender PowerPoint charts, crafted to articulate your bids with precision and persuasion. Aimed at procurement specialists, contractors, and bid teams, these charts distill intricate tender details into compelling visuals that highlight value and feasibility.
From bid evaluation matrices to cost breakdown pies, each chart employs strategic layouts to emphasize strengths and mitigate concerns. Vibrant yet professional palettes ensure readability, while editable formulas automate calculations for accuracy.
Transform routine submissions into standout proposals. Peruse our assortment and download charts that tip the scales in your favor.
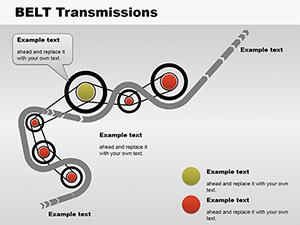
Tender PowerPoint charts are pivotal in high-stakes bidding. Procurement teams use column charts to compare supplier quotes, underscoring competitive pricing. For construction tenders, Gantt overlays chart project phases against deadlines, demonstrating reliability.
Evaluation stages shine with radar charts assessing criteria fulfillment, while financial summaries employ waterfall visuals to net out costs and savings. These charts adapt to public or private sector nuances, from EU directives to corporate RFPs.
In government bids, compliance bar charts track regulatory adherence. Corporate scenarios benefit from scatter plots correlating past performance with tender scopes.
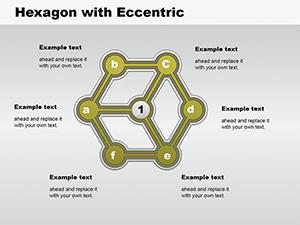
Default PowerPoint charts suffice for basics but falter in tender specificity; ours incorporate bid jargon icons like envelopes for submissions or scales for fairness. Advanced grouping allows nested data views, revealing layers without clutter.
Formula integration with tables ensures bid math integrity, a leap from manual entries prone to errors.
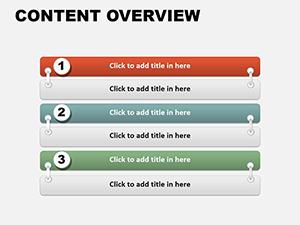
Prioritize evaluator perspectives: lead with value propositions via bold highlights. Maintain neutrality in colors to avoid bias perceptions. Cross-verify data against tender docs for alignment.
Leverage animations sparingly for reveals, like building cost stacks progressively to build narrative tension.
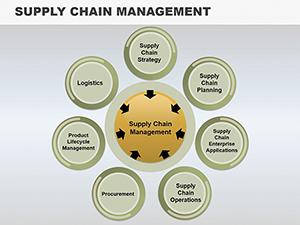
A logistics firm clinched a supply chain tender with a Sankey diagram flowing goods through optimized routes. An IT vendor won via bubble charts sizing solutions by ROI. These triumphs underscore charts` role in persuasion.
For service tenders, portfolio gauges meter expertise levels, quantifying intangibles.
Dive into our tender chart collection and equip your bids for victory. Downloads are ready - act now to outshine competitors.
Copyright © 2009-2026 ImagineLayout All rights reserved.