Nothing motivates like seeing progress toward a goal. Our target chart collection for Keynote includes more than 100 professional templates designed to showcase objectives, milestones, and results with impact.
From classic bullseye diagrams to modern gauge charts and progress trackers, these visuals help teams stay focused and celebrate wins.
Bring energy to your slides with animated reveals and bold, contemporary designs that go far beyond basic defaults.
All templates are completely editable so you can input your metrics and customize colors in minutes.
Explore the collection to find the perfect way to present your targets and achievements.
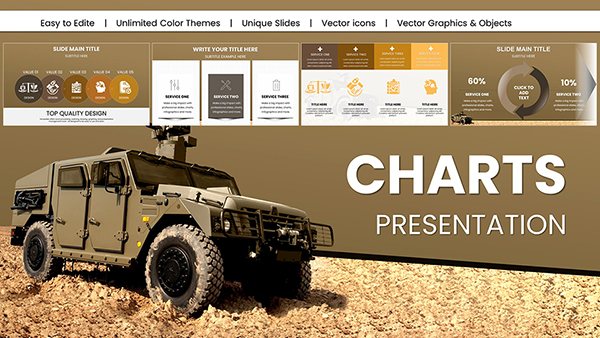
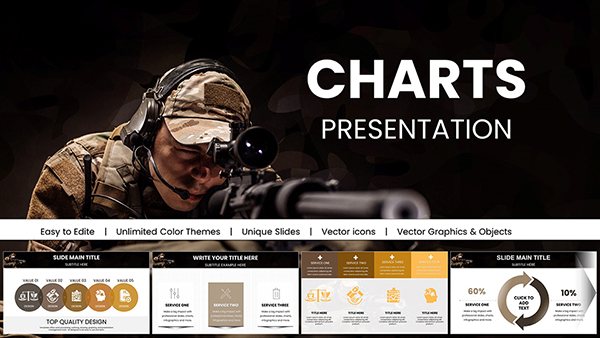
Military Vehicle Keynote Charts Presentation: Elevate Your Defense Strategies
ID: #KC01008
$20.00
(377)
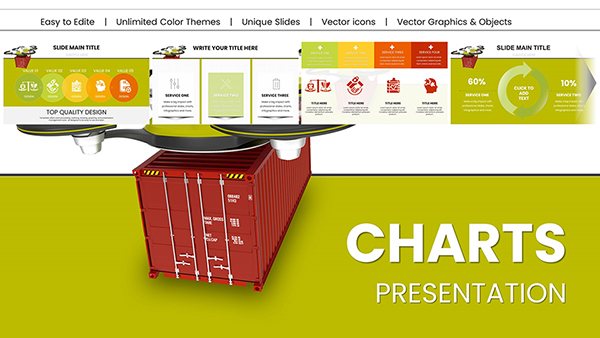
Vibrant Beauty Makeup Cosmetic Keynote Charts for Presentation
ID: #KC01004
$22.00
(1173)
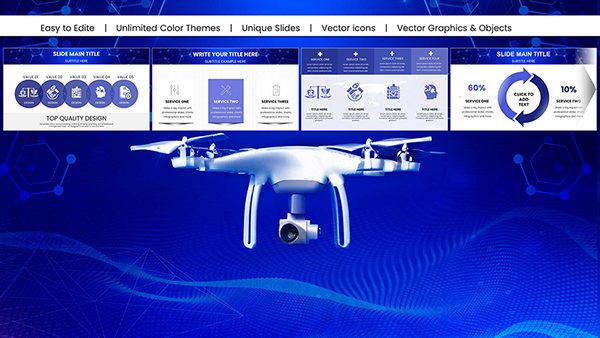
Military Technology Drones Keynote Charts for Presentation
ID: #KC00997
$18.00
(520)
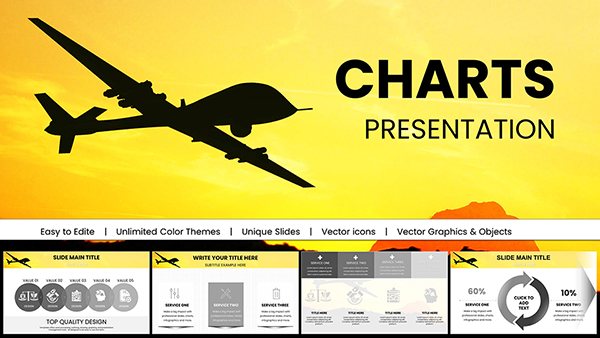
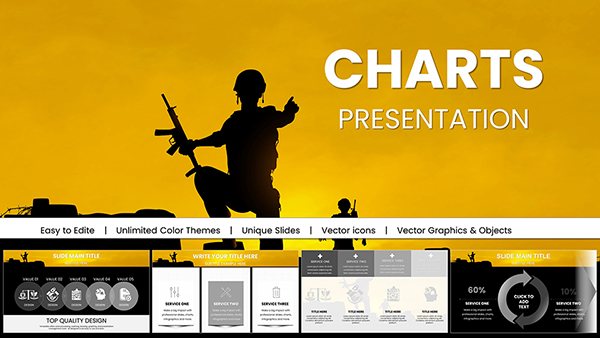
Armed Forces Keynote Charts for Military Presentation
ID: #KC00995
$18.00
(444)
Military Pay Keynote Charts Template
ID: #KC00994
$18.00
(966)
Armed Forces PowerPoint Charts for Military Presentation
ID: #KC00993
$16.00
(1062)
Army Pay Keynote Charts for Military Presentation
ID: #KC00992
$18.00
(15)
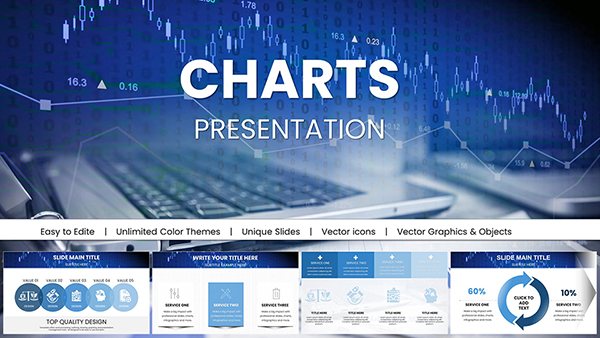
Real Estate Market Keynote Charts: Transform Data into Deals
ID: #KC00988
$18.00
(490)
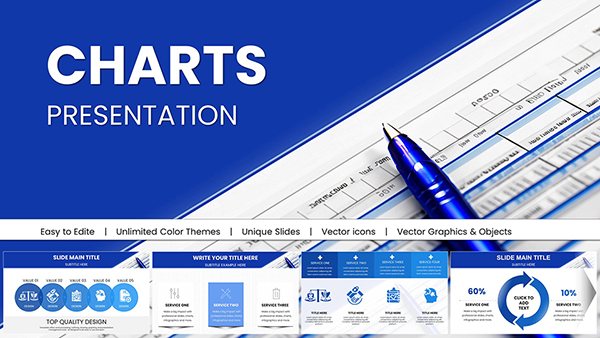
Data Financial Keynote Charts Template: Empower Fiscal Storytelling
ID: #KC00973
$20.00
(605)
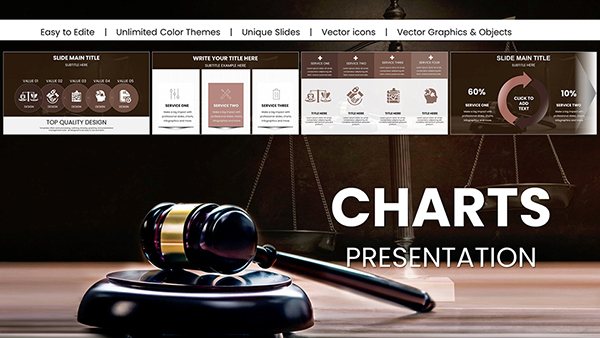
Business Correspondence Keynote Charts Template
ID: #KC00957
$20.00
(466)
Professional Business Report Keynote Charts
ID: #KC00938
$25.00
(532)
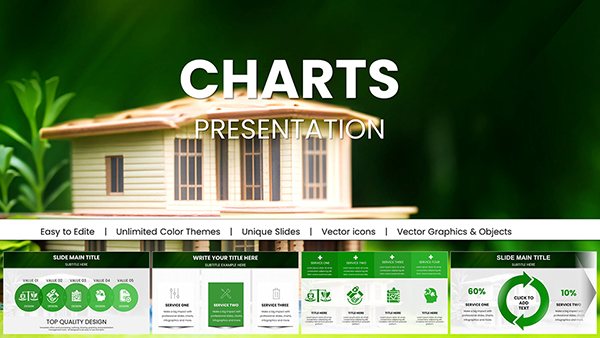
Sustainable Development Keynote Charts: Empower Your Eco-Presentations
ID: #KC00937
$25.00
(352)
Decode Financials Like a Pro: Financial Statement Analysis Keynote Charts Template
ID: #KC00932
$24.00
(556)
Master Your Finances: Statement of Financial Position Keynote Charts Template
ID: #KC00931
$24.00
(936)
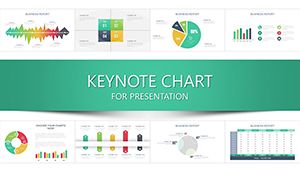
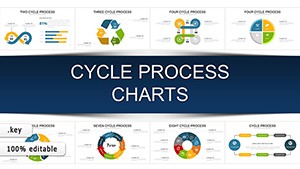
Cycle Process Keynote Charts - Instant Download | ImagineLayout
ID: #KC00922
$20.00
(88)
Financial Clarity in Design: Interim Financial Statements Keynote Charts
ID: #KC00919
$22.00
(803)
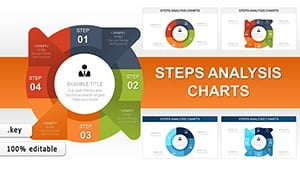
Steps Analysis Keynote Charts: Project Flows
ID: #KC00918
$18.00
Why Target Charts Drive Better Results
Visual goal tracking keeps teams aligned and motivated. These charts turn abstract numbers into tangible progress indicators that audiences connect with emotionally.
Everyday Applications for Target Charts
Sales teams display quarterly targets. Project managers show milestone completion.
Performance reviews: Highlight KPI achievement.
Strategic planning: Map long-term objectives.
Marketing campaigns: Track conversion goals.
Personal development presentations: Show growth journeys.
Tips for Compelling Target Visuals
Use green-to-red gradients to show progress intuitively.
Animate the fill effect to build excitement.
Place the most important metric in the center.
Pair with motivational quotes for extra impact.
Our templates make these techniques simple to apply.