Navigate your audience landscape with our PowerPoint chart templates focused on target markets. Ideal for marketers, product managers, and sales teams, these visuals dissect consumer segments, preferences, and trends with sharp accuracy and style.
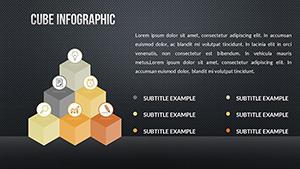
From demographic pyramids to behavior heat maps, each template is primed for quick data infusion, turning raw stats into strategic gems. Skip the guesswork and deliver pitches that hit the mark every time.
Whether mapping urban millennials or rural retirees, our charts clarify paths to engagement. Delve into the assortment and arm your team with visuals that convert insights to action. Begin refining your approach today.
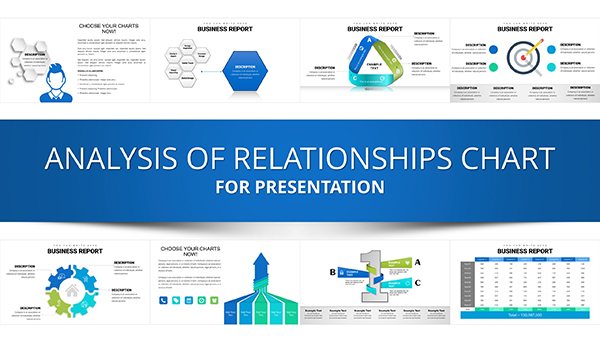
Analytics in Marketing: PowerPoint Charts to Decode Customer Insights
ID: #PC00925
$24.00
(350)
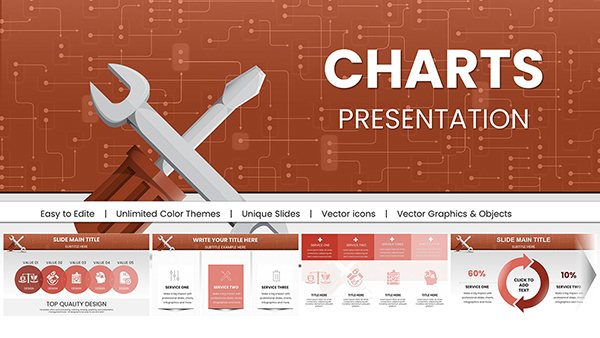
Gear Financial Risks PowerPoint Charts Template - Gear Up for Clarity
ID: #PC00858
$18.00
(196)
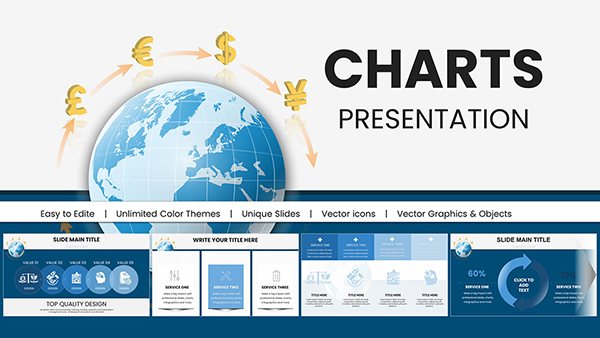
Economic Charts in PowerPoint - Fully Editable | ImagineLayout
ID: #PC00669
$24.00
(1068)
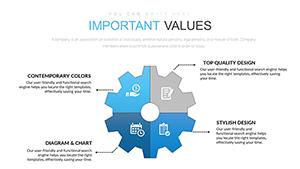
4 Sector Gears PowerPoint Charts: Gear Up for Success
ID: #PC00666
$18.00
(464)
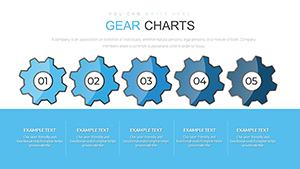
Top Gear System PowerPoint Charts Template - Presentation Designs
ID: #PC00655
$20.00
(973)
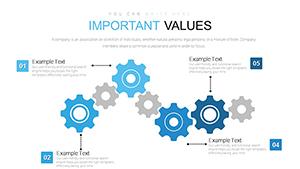
Cyclic Gears PowerPoint Charts Template
ID: #PC00647
$20.00
(755)
Marketing Analytics PowerPoint Charts Template: Master Data Visualization
ID: #PC00528
$24.00
(390)
Professional Analytics PowerPoint Charts Template: Master Data Storytelling
ID: #PC00523
$19.00
(1150)
Advertising Strategies PowerPoint Charts: Craft Winning Media Plans
ID: #PC00486
$17.00
(242)
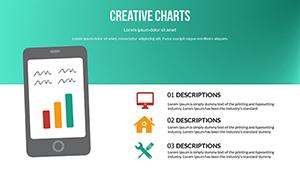
Dynamic Interactive PPT Charts Template - Engage Now
ID: #PC00476
$16.00
(296)
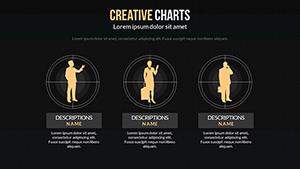
Creative Dark PPT Charts Template - Business Strategy
ID: #PC00474
$18.00
(765)
Advanced SWOT Analysis PowerPoint Charts Template
ID: #PC00452
$17.00
(488)
General Information PowerPoint Charts Template: Versatile Tools for Clear Communication
ID: #PC00285
$18.00
(845)
Research Methodology PowerPoint Charts Template: Clarity in Every Analysis
ID: #PC00250
$18.00
Sharpening Market Strategies with Chart Excellence
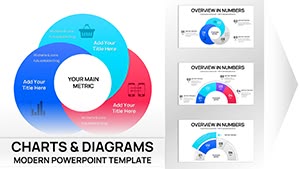
Target market charts demand nuance, and our PowerPoint templates provide it through segmented visuals like Venn diagrams for overlap analysis. They integrate psychographic icons, elevating beyond bland bar graphs.
For a launch plan, use radial charts to radiate buying journeys from awareness to loyalty.
Strategic Use Cases for Market Charts
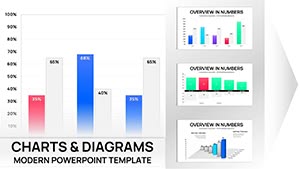
Brand Positioning: Bubble charts sizing segments by potential revenue.
Competitor Mapping: Scatter plots plotting share versus satisfaction.
Default charts ignore market context; ours layer personas with annotations for storytelling. Dynamic links update with CRM data, a leap from manual refreshes.
High-res for print collateral too.
Best Practices for Target Market Visuals
Choose Contextual Types: Treemaps for hierarchical segments like age-income crosses.
Annotate Insights: Callouts for actionable takeaways on peaks.
Iterate with Feedback: Version controls for evolving market views.
Implement to boost relevance.
Ingenious Market Chart Applications
Fuse with personas for narrative slides or Sankey diagrams for flow between niches. E-commerce teams can animate path analyses for cart abandonments.
Consultants adapt for client audits, using mosaic plots for diversity metrics. Probe multi-axis charts for cross-regional comparisons.
Target Success with Our Charts
Survey the target market collection and download to strategize. Effortless integration awaits.
Frequently Asked Questions
These charts are your compass to market mastery. Acquire now and connect deeper.