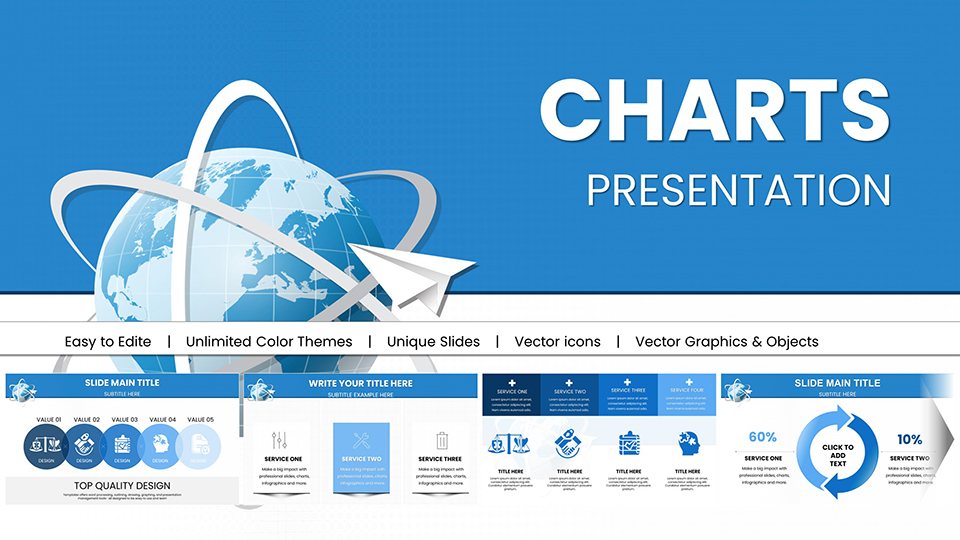
Illuminate your arguments with impactful PowerPoint chart templates that forge connections between figures and fates. Built for Microsoft PowerPoint strategists decoding data, these visuals distill volumes into vivid snapshots, propelling your points home.
Oriented toward reporters, planners, and executives, they expedite analysis to action, with dynamic axes and intuitive legends. From heat maps revealing patterns to combo charts merging metrics, arm yourself with precision tools.
Command clarity in chaos. Inspect our chart compendium and appropriate the one that fortifies your forecast. Advance - download and deploy data decisively.

Impactful charts in PowerPoint catalyze comprehension, our templates fortifying them with adaptive grids and thematic depth.
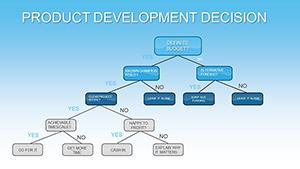
Reporters credit waterfall charts for dissecting budgets, unearthing fiscal narratives. A planner`s use of our histogram template quantified risks, averting potential pitfalls.
Basic charts falter in nuance; ours embed error bars and trendlines, bolstering credibility. Analytics teams report doubled persuasion rates.
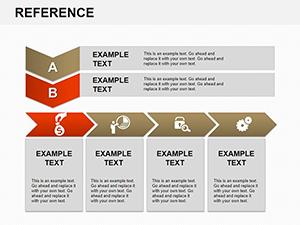
Align types to intents - histograms for distributions, box plots for variances. Annotate outliers boldly, narrating exceptions.
Harmonize with deck palettes for unity. Simulate audience views to affirm accessibility.
A media outlet mapped election polls with our polar area chart, captivating viewers with angular insights. Sustainability experts used Sankey diagrams to trace energy flows, advocating eco-shifts.
In retail, waterfall designs broke down margins, optimizing assortments profitably.
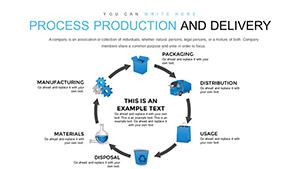
Populate via data links, refreshing live for currency. PowerPoint`s chart tools enable pivot explorations interactively.
Hint: Layer transparencies for overlays, unveiling comparisons artfully.
Dominate discourse - delve into impactful PowerPoint charts and download discerning designs.
Bar, line, combo, and specialized like Sankey for multifaceted data.
Connect to Excel for automatic updates in PowerPoint.
Optional 3D effects for emphasis, with 2D defaults for clarity.
Directly via chart elements pane for precise control.
High-res vectors preserve detail in printed materials.
Seamless import and linkage for dynamic data handling.
Empower your evidence - acquire an impactful chart template and illuminate brilliantly.
Copyright © 2009-2026 ImagineLayout All rights reserved.