Architect your ambitions using strategic PowerPoint diagrams, precision-crafted for organizers and influencers. This lineup spans flowcharts to org structures, enabling you to diagram strategies with unmatched clarity and elegance.
They facilitate everything from process optimizations to alliance mappings, making intricate ideas accessible at a glance. Essential for planning cycles, they ground visions in visual reality.
For forward-thinkers, this category provides the scaffolding for stellar strategies. Select a diagram and build your blueprint to brilliance.


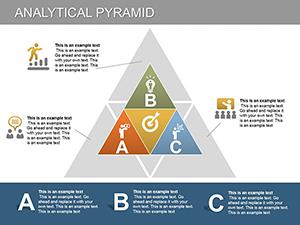


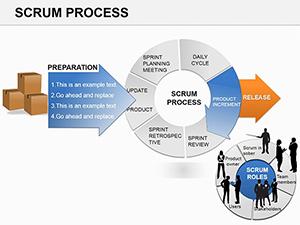
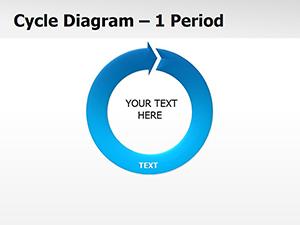
Strategic PowerPoint diagrams demystify operations with connector-rich layouts - think decision trees branching into action branches or cycle diagrams looping feedback. They excel in change management or innovation pipelines.
Project leads orchestrate timelines, executives overview empires. SmartArt enhancements speed customization.
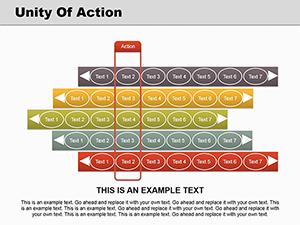
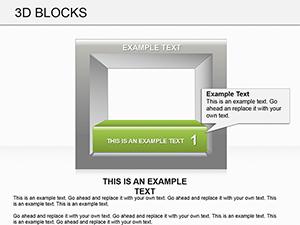
An event planner`s orchestration: cascade diagrams flow from ideation to execution, nodes swelling with task details - a living blueprint.
Defaults are linear; ours branch multidimensionally with curved connectors, capturing nuances. Infinite scalability trumps rigid grids.
Standardize symbols for consistency. Tip: Color-code paths by priority to navigate visually.
Offers shape libraries for thematic consistency.
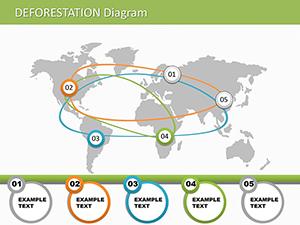
For supply chains: fishbone diagrams probing disruptions, with expandable causes. Flair: Animate along paths for sequential storytelling.
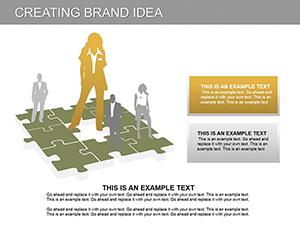
In R&D, mind maps radiating ideas. Tip: Use dashed lines for contingencies.
Version history tracks evolutions, ideal for iterative strategies.
CTA: Construct confidently - download diagrams to diagram destiny.
Demystifying diagram dynamics. Immerse in the category.
CTA: Design your future - start diagramming now.
Copyright © 2009-2026 ImagineLayout All rights reserved.